

The DOI matches its Crossref record; 8 of the 8 references it cites were found in a registry or an index.
An interactive meta-analysis of MRI biomarkers of myelin
Published version of a preprint
Abstract
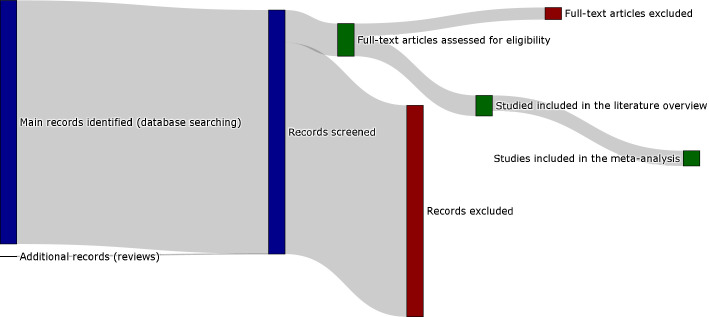
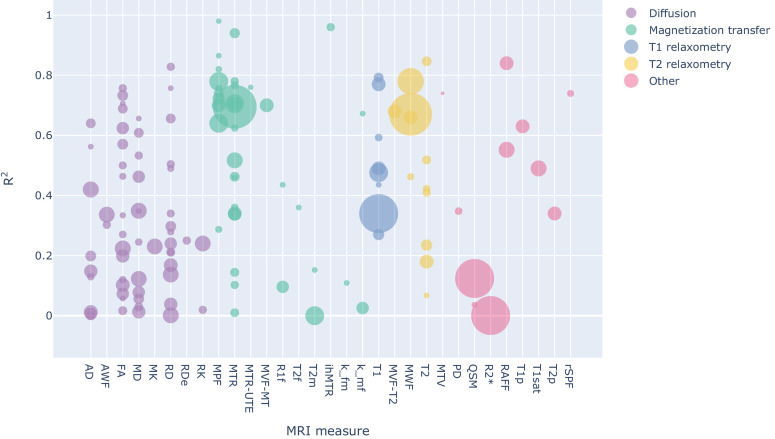
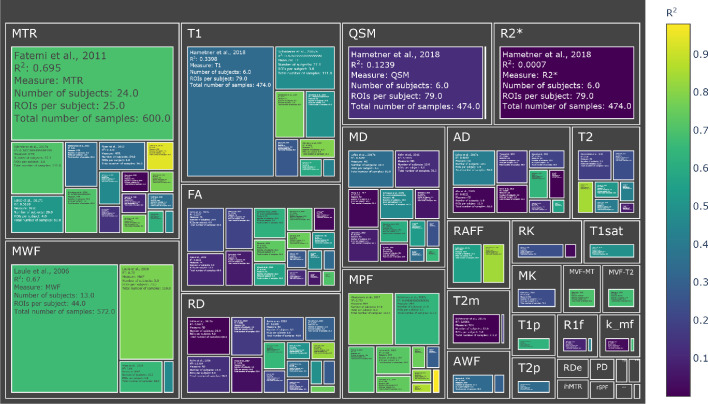
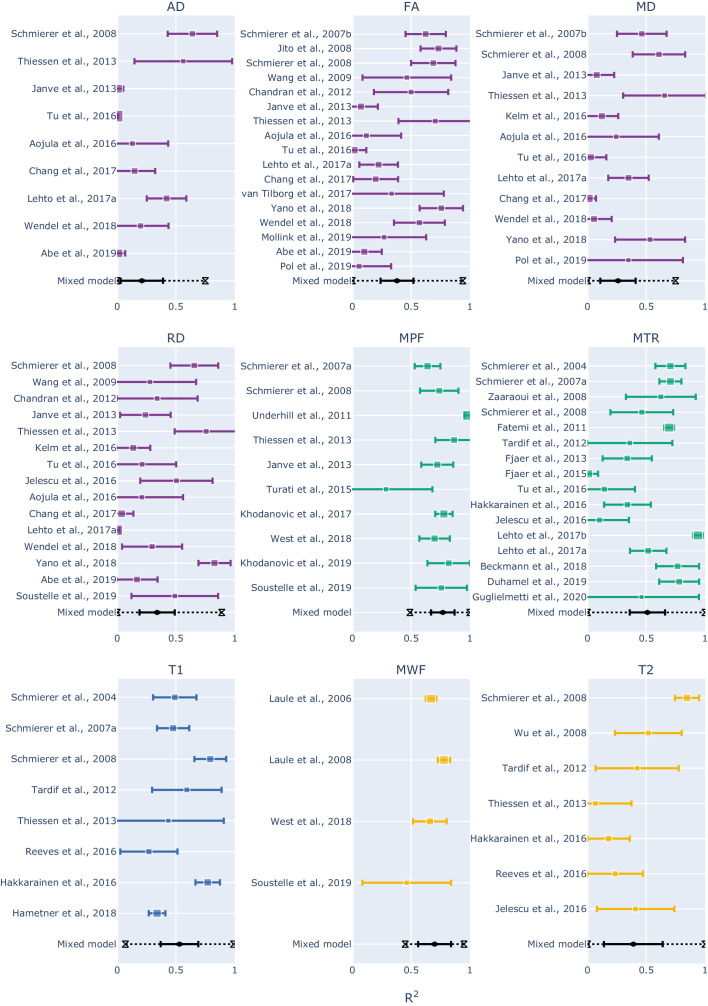
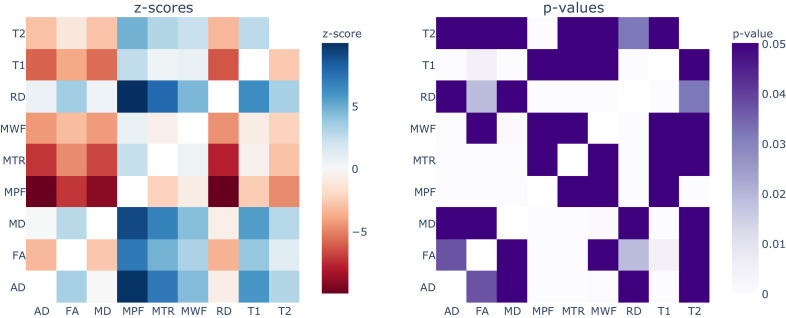
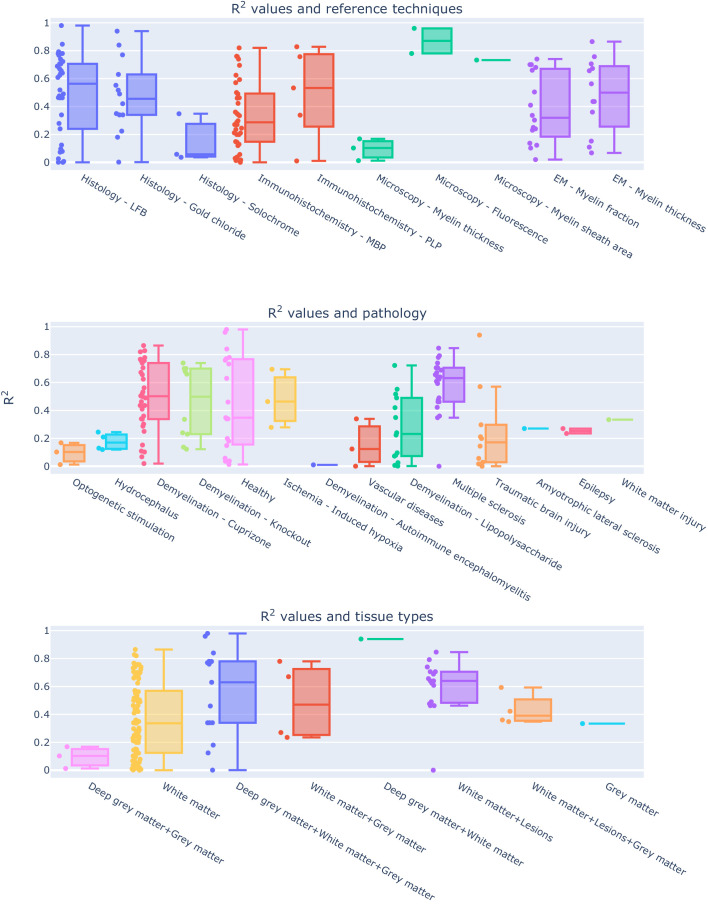
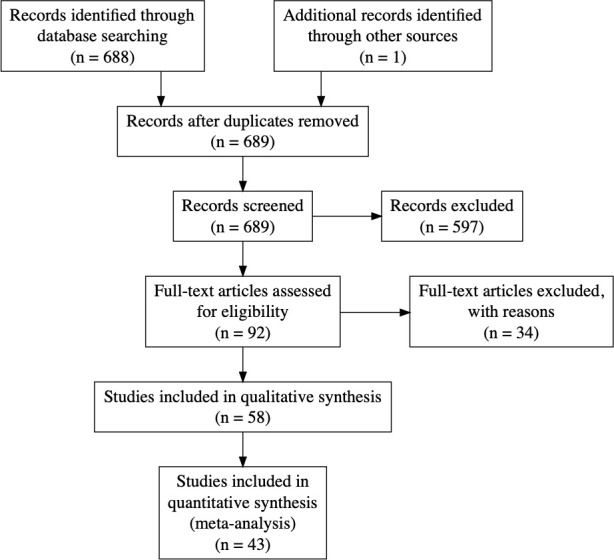
Several MRI measures have been proposed as in vivo biomarkers of myelin, each with applications ranging from plasticity to pathology. Despite the availability of these myelin-sensitive modalities, specificity and sensitivity have been a matter of discussion. Debate about which MRI measure is the most suitable for quantifying myelin is still ongoing. In this study, we performed a systematic review of published quantitative validation studies to clarify how different these measures are when compared to the underlying histology. We analyzed the results from 43 studies applying meta-analysis tools, controlling for study sample size and using interactive visualization ( https://neurolibre.github.io/myelin-meta-analysis ). We report the overall estimates and the prediction intervals for the coefficient of determination and find that MT and relaxometry-based measures exhibit the highest correlations with myelin content. We also show which measures are, and which measures are not statistically different regarding their relationship with histology.
Overview
The claims and statistics of this paper haven’t been checked yet.
Run the check — free, no account needed. It reads the open-access text and checks the sources it cites.
Integrity signals
Registry
Cites
Statistics
Figures
Verification
Claims the paper makes
The claims and statistics of this paper haven’t been checked yet.
Run the check — free, no account needed. It reads the open-access text and checks the sources it cites.
Claims other papers make about this one
Each is checked against this paper’s own text: does it say what the citing paper says it does?
The cited source says what the claim attributes to it.
In the citing paper
“However, conflicting evidence was also presented in a meta-analysis showing a low correlation between myelin content and FA.52”
From A spatial imaging-transcriptomics paradigm for deciphering the molecular basis of microscopic MRI in the normal brain and Alzheimer’s disease (2025) · cites this paper as [52]
Self-check
Percentages, sums and reported differences re-computed from the paper’s own numbers.
The self-check needs the paper’s full text.
Citations
Cites
The basis of anisotropic water diffusion in the nervous system—A technical review.
Beaulieu, C. (2002) · NMR in Biomedicine · doi:10.1002/nbm.782 · Cited by 4,628
The Handbook of Research Synthesis and Meta-Analysis
(2019) · doi:10.7758/9781610448864 · Cited by 4,553
Elements of Large-Sample Theory
(1999) · Springer Texts in Statistics · doi:10.1007/b98855 · Cited by 677
Diffusion tensor imaging of post mortem multiple sclerosis brain
Schmierer, K., Wheeler-Kingshott, C. A. M., Boulby, P. A., Scaravilli, F., Altmann, D. R., Barker, G. J., Tofts, P. S., & Miller, D. H. (2007) · NeuroImage · doi:10.1016/j.neuroimage.2006.12.010 · Cited by 395
Magnetic Resonance Imaging of Myelin
Laule, C., Vavasour, I. M., Kolind, S. H., Li, D. K. B., Traboulsee, T. L., Moore, G. R. W., & MacKay, A. L. (2007) · Neurotherapeutics · doi:10.1016/j.nurt.2007.05.004 · Cited by 334
Jelescu, I. O., Zurek, M., Winters, K. V., Veraart, J., Rajaratnam, A., Kim, N. S., Babb, J. S., Shepherd, T. M., Novikov, D. S., Kim, S. G., et al. (2016) · NeuroImage · doi:10.1016/j.neuroimage.2016.02.004 · Cited by 188
Histological validation of high-resolution DTI in human post mortem tissue
Seehaus, A., Roebroeck, A., Bastiani, M., Fonseca, L., Bratzke, H., Lori, N., Vilanova, A., Goebel, R., & Galuske, R. (2015) · Frontiers in Neuroanatomy · doi:10.3389/fnana.2015.00098 · Cited by 149
Praet, J., Manyakov, N. V., Muchene, L., Mai, Z., Terzopoulos, V., de Backer, S., Torremans, A., Guns, P.-J., Van De Casteele, T., Bottelbergs, A., et al. (2018) · Alzheimer's Research & Therapy · doi:10.1186/s13195-017-0329-8 · Cited by 133
Research works printed but not linked: 83
- Abe, 2019, Correlative study using structural MRI and super-resolution microscopy to detect structural alterations induced by long-term optogenetic stimulation of striatal medium spiny neurons, Neurochemistry International, 125, 163, 10.1016/j.neuint.2019.02.017 · DOI
- Aojula, 2016, Diffusion tensor imaging with direct cytopathological validation: characterisation of decorin treatment in experimental juvenile communicating hydrocephalus, Fluids and Barriers of the CNS, 13, 10.1186/s12987-016-0033-2 · DOI
- Beaulieu, 2009, Diffusion MRI, 105, 10.1016/B978-0-12-374709-9.00006-7 · DOI
- Beckmann, 2018, Brain region-specific enhancement of remyelination and prevention of demyelination by the CSF1R kinase inhibitor BLZ945, Acta Neuropathologica Communications, 6, 10.1186/s40478-018-0510-8 · DOI · Paper page
- Berman, 2018, Evaluating g-ratio weighted changes in the corpus callosum as a function of age and sex, NeuroImage, 182, 304, 10.1016/j.neuroimage.2017.06.076 · DOI · Paper page
- Cercignani, 2018, Quantitative MRI of the Brain
- Chandran, 2012, Magnetic resonance imaging and histological evidence for the blockade of cuprizone-induced demyelination in C57BL/6 mice, Neuroscience, 202, 446, 10.1016/j.neuroscience.2011.10.051 · DOI
- Chang, 2017, Diffusion tensor imaging measures of white matter compared to myelin basic protein immunofluorescence in tissue cleared intact brains, Data in Brief, 10, 438, 10.1016/j.dib.2016.12.018 · DOI
- Chen, 2017, Validating myelin water imaging with transmission electron microscopy in a rat spinal cord injury model, NeuroImage, 153, 122, 10.1016/j.neuroimage.2017.03.065 · DOI
- Cohen-Adad, 2018, Microstructural imaging in the spinal cord and validation strategies, NeuroImage, 182, 169, 10.1016/j.neuroimage.2018.04.009 · DOI · Paper page
- Cohen-Adad, 2014, Quantitative MRI of the Spinal Cord
- Does, 2018, Inferring brain tissue composition and microstructure via MR relaxometry, NeuroImage, 182, 136, 10.1016/j.neuroimage.2017.12.087 · DOI
- Does, 2000, Rapid acquisition transverse relaxometric imaging, Journal of Magnetic Resonance, 147, 116, 10.1006/jmre.2000.2168 · DOI
- Du, 2009, Ultrashort TE imaging with off-resonance saturation contrast (UTE-OSC), Magnetic Resonance in Medicine, 62, 527, 10.1002/mrm.22007 · DOI
- Duhamel, 2019, Validating the sensitivity of inhomogeneous magnetization transfer (ihMT) MRI to myelin with fluorescence microscopy, NeuroImage, 199, 289, 10.1016/j.neuroimage.2019.05.061 · DOI
- Dula, 2010, Multiexponential T2, magnetization transfer, and quantitative histology in white matter tracts of rat spinal cord, Magnetic Resonance in Medicine, 63, 902, 10.1002/mrm.22267 · DOI
- Fatemi, 2011, In vivo magnetization transfer MRI shows dysmyelination in an ischemic mouse model of periventricular leukomalacia, Journal of Cerebral Blood Flow & Metabolism, 31, 2009, 10.1038/jcbfm.2011.68 · DOI
- Feinberg, 1991, GRASE (gradient- and spin-echo) MR imaging: a new fast clinical imaging technique, Radiology, 181, 597, 10.1148/radiology.181.2.1924811 · DOI
- Fields, 2015, A new mechanism of nervous system plasticity: activity-dependent myelination, Nature Reviews Neuroscience, 16, 756, 10.1038/nrn4023 · DOI · Paper page
- Fjær, 2013, Deep gray matter demyelination detected by magnetization transfer ratio in the cuprizone model, PLOS ONE, 8, 10.1371/journal.pone.0084162 · DOI
- Fjær, 2015, Magnetization transfer ratio does not correlate to myelin content in the brain in the MOG-EAE mouse model, Neurochemistry International, 83-84, 28, 10.1016/j.neuint.2015.02.006 · DOI
- Guglielmetti, 2020, Longitudinal evaluation of demyelinated lesions in a multiple sclerosis model using ultrashort Echo time magnetization transfer (UTE-MT) imaging, NeuroImage, 208, 10.1016/j.neuroimage.2019.116415 · DOI
- Hakkarainen, 2016, MRI relaxation in the presence of fictitious fields correlates with myelin content in normal rat brain, Magnetic Resonance in Medicine, 75, 161, 10.1002/mrm.25590 · DOI
- Hametner, 2018, The influence of brain iron and myelin on magnetic susceptibility and effective transverse relaxation - A biochemical and histological validation study, NeuroImage, 179, 117, 10.1016/j.neuroimage.2018.06.007 · DOI
- Harkins, 2012, Effect of intercompartmental water exchange on the apparent myelin water fraction in multiexponential T2 measurements of rat spinal cord, Magnetic Resonance in Medicine, 67, 793, 10.1002/mrm.23053 · DOI
- Harkins, 2013, In-vivo multi-exponential T2, magnetization transfer and quantitative histology in a rat model of intramyelinic edema, NeuroImage: Clinical, 2, 810, 10.1016/j.nicl.2013.06.007 · DOI
- Higgins, 2002, Quantifying heterogeneity in a meta-analysis, Statistics in Medicine, 21, 1539, 10.1002/sim.1186 · DOI · Paper page
- Höftberger, 2018, Handbook of Clinical Neurology, 263
- Janve, 2013, The radial diffusivity and magnetization transfer pool size ratio are sensitive markers for demyelination in a rat model of type III multiple sclerosis (MS) lesions, NeuroImage, 74, 298, 10.1016/j.neuroimage.2013.02.034 · DOI · Paper page
- Jito, 2008, Maturational changes in diffusion anisotropy in the rat corpus callosum: comparison with quantitative histological evaluation, Journal of Magnetic Resonance Imaging, 28, 847, 10.1002/jmri.21496 · DOI
- Kelm, 2016, Evaluation of diffusion kurtosis imaging in ex vivo hypomyelinated mouse brains, NeuroImage, 124, 612, 10.1016/j.neuroimage.2015.09.028 · DOI
- Khodanovich, 2017, Histological validation of fast macromolecular proton fraction mapping as a quantitative myelin imaging method in the cuprizone demyelination model, Scientific Reports, 7, 10.1038/srep46686 · DOI
- Khodanovich, 2019, Quantitative imaging of white and gray matter remyelination in the cuprizone demyelination model using the macromolecular proton fraction, Cells, 8, 10.3390/cells8101204 · DOI
- Kozlowski, 2008, Characterizing white matter damage in rat spinal cord with quantitative MRI and histology, Journal of Neurotrauma, 25, 653, 10.1089/neu.2007.0462 · DOI · Paper page
- Kozlowski, 2014, In vivo longitudinal myelin water imaging in rat spinal cord following dorsal column transection injury, Magnetic Resonance Imaging, 32, 250, 10.1016/j.mri.2013.12.006 · DOI
- Laule, 2006, Myelin water imaging in multiple sclerosis: quantitative correlations with histopathology, Multiple Sclerosis Journal, 12, 747, 10.1177/1352458506070928 · DOI · Paper page
- Laule, 2008, Myelin water imaging of multiple sclerosis at 7 T: correlations with histopathology, NeuroImage, 40, 1575, 10.1016/j.neuroimage.2007.12.008 · DOI
- Laule, 2011, Pathological basis of diffusely abnormal white matter: insights from magnetic resonance imaging and histology, Multiple Sclerosis Journal, 17, 144, 10.1177/1352458510384008 · DOI · Paper page
- Laule, 2018, Myelin water imaging to detect demyelination and remyelination and its validation in pathology, Brain Pathology, 28, 750, 10.1111/bpa.12645 · DOI
- Lehto, 2017, Lysophosphatidyl choline induced demyelination in rat probed by relaxation along a fictitious field in high rank rotating frame, Frontiers in Neuroscience, 11, 10.3389/fnins.2017.00433 · DOI
- Lehto, 2017, Magnetization transfer SWIFT MRI consistently detects histologically verified myelin loss in the thalamocortical pathway after a traumatic brain injury in rat, NMR in Biomedicine, 30, 10.1002/nbm.3678 · DOI
- MacKay, 1994, In vivo visualization of myelin water in brain by magnetic resonance, Magnetic Resonance in Medicine, 31, 673, 10.1002/mrm.1910310614 · DOI
- MacKay, 2016, Magnetic resonance of myelin water: an in vivo Marker for Myelin, Brain Plasticity, 2, 71, 10.3233/BPL-160033 · DOI
- Mollink, 2019, White matter changes in the perforant path area in patients with amyotrophic lateral sclerosis, Neuropathology and Applied Neurobiology, 45, 570, 10.1111/nan.12555 · DOI · Paper page
- Nave, 2014, Myelination of the nervous system: mechanisms and functions, Annual Review of Cell and Developmental Biology, 30, 503, 10.1146/annurev-cellbio-100913-013101 · DOI · Paper page
- Odrobina, 2005, MR properties of excised neural tissue following experimentally induced demyelination, NMR in Biomedicine, 18, 277, 10.1002/nbm.951 · DOI
- Peters, 2019, White matter mean diffusivity correlates with myelination in tuberous sclerosis complex, Annals of Clinical and Translational Neurology, 6, 1178, 10.1002/acn3.793 · DOI · Paper page
- Petiet, 2019, Ultrahigh field imaging of myelin disease models: toward specific markers of myelin integrity?, Journal of Comparative Neurology, 527, 2179, 10.1002/cne.24598 · DOI
- Pol, 2019, Teriflunomide's Effect on Glia in Experimental Demyelinating Disease: A Neuroimaging and Histologic Study, Journal of Neuroimaging, 29, 52, 10.1111/jon.12561 · DOI
- Prasloski, 2012, Rapid whole cerebrum myelin water imaging using a 3D GRASE sequence, NeuroImage, 63, 533, 10.1016/j.neuroimage.2012.06.064 · DOI
- Pun, 2005, Histological and magnetic resonance analysis of sciatic nerves in the tellurium model of neuropathy, Journal of the Peripheral Nervous System : JPNS, 10, 38, 10.1111/j.1085-9489.2005.10107.x · DOI
- Reeves, 2016, Combined ex vivo 9.4 T MRI and Quantitative Histopathological Study in Normal and Pathological Neocortical Resections in Focal Epilepsy, Brain Pathology, 26, 319, 10.1111/bpa.12298 · DOI
- Rooney, 2007, Magnetic field and tissue dependencies of human brain longitudinal 1h2o relaxation in vivo, Magnetic Resonance in Medicine, 57, 308, 10.1002/mrm.21122 · DOI
- Sampaio-Baptista, 2017, White matter plasticity in the adult brain, Neuron, 96, 1239, 10.1016/j.neuron.2017.11.026 · DOI
- Schmierer, 2004, Magnetization transfer ratio and myelin in postmortem multiple sclerosis brain, Annals of Neurology, 56, 407, 10.1002/ana.20202 · DOI
- Schmierer, 2007, Quantitative magnetization transfer imaging in postmortem multiple sclerosis brain, Journal of Magnetic Resonance Imaging, 26, 41, 10.1002/jmri.20984 · DOI
- Schmierer, 2008, Quantitative magnetic resonance of postmortem multiple sclerosis brain before and after fixation, Magnetic Resonance in Medicine, 59, 268, 10.1002/mrm.21487 · DOI · Paper page
- Schmierer, 2010, High field (9.4 tesla) magnetic resonance imaging of cortical grey matter lesions in multiple sclerosis, Brain, 133, 858, 10.1093/brain/awp335 · DOI
- Sled, 2018, Modelling and interpretation of magnetization transfer imaging in the brain, NeuroImage, 182, 128, 10.1016/j.neuroimage.2017.11.065 · DOI
- Soustelle, 2019, Correlations of quantitative MRI metrics with myelin basic protein (MBP) staining in a murine model of demyelination, NMR in Biomedicine, 32, 10.1002/nbm.4116 · DOI
- Stanisz, 1999, Characterizing white matter with magnetization transfer and T(2), Magnetic Resonance in Medicine, 42, 1128, 10.1002/(SICI)1522-2594(199912)42:6<1128::AID-MRM18>3.0.CO;2-9 · DOI
- Stanisz, 2004, MR properties of excised neural tissue following experimentally induced inflammation, Magnetic Resonance in Medicine, 51, 473, 10.1002/mrm.20008 · DOI · Paper page
- Takagi, 2009, Visualization of peripheral nerve degeneration and regeneration: monitoring with diffusion tensor tractography, NeuroImage, 44, 884, 10.1016/j.neuroimage.2008.09.022 · DOI
- Tardif, 2012, Quantitative magnetic resonance imaging of cortical multiple sclerosis pathology, Multiple Sclerosis International, 2012, 1, 10.1155/2012/742018 · DOI
- Thiessen, 2013, Quantitative MRI and ultrastructural examination of the cuprizone mouse model of demyelination, NMR in Biomedicine, 26, 1562, 10.1002/nbm.2992 · DOI · Paper page
- Tu, 2016, Radiological-pathological correlation of diffusion tensor and magnetization transfer imaging in a closed head traumatic brain injury model, Annals of Neurology, 79, 907, 10.1002/ana.24641 · DOI
- Turati, 2015, In vivo quantitative magnetization transfer imaging correlates with histology during de- and remyelination in cuprizone-treated mice, NMR in Biomedicine, 28, 327, 10.1002/nbm.3253 · DOI
- Turner, 2019, Myelin and modeling: bootstrapping cortical microcircuits, Frontiers in Neural Circuits, 13, 10.3389/fncir.2019.00034 · DOI
- Underhill, 2011, Fast bound pool fraction imaging of the in vivo rat brain: association with myelin content and validation in the C6 glioma model, NeuroImage, 54, 2052, 10.1016/j.neuroimage.2010.10.065 · DOI
- van Tilborg, 2018, Combined fetal inflammation and postnatal hypoxia causes myelin deficits and autism-like behavior in a rat model of diffuse white matter injury, Glia, 66, 78, 10.1002/glia.23216 · DOI
- Varma, 2015, Magnetization transfer from Inhomogeneously broadened lines: a potential marker for myelin, Magnetic Resonance in Medicine, 73, 614, 10.1002/mrm.25174 · DOI
- Viechtbauer, 2010, Conducting Meta-Analyses in R with the metafor Package, Journal of Statistical Software, 36, 10.18637/jss.v036.i03 · DOI · Paper page
- Wang, 2009, Mild hypoxic-ischemic injury in the neonatal rat brain: longitudinal evaluation of white matter using diffusion tensor MR imaging, American Journal of Neuroradiology, 30, 1907, 10.3174/ajnr.A1697 · DOI
- Wang, 2014, Diffusion basis spectrum imaging detects and distinguishes coexisting subclinical inflammation, demyelination and axonal injury in experimental autoimmune encephalomyelitis mice, NMR in Biomedicine, 27, 843, 10.1002/nbm.3129 · DOI
- Wang, 2015, Differentiation and quantification of inflammation, demyelination and axon injury or loss in multiple sclerosis, Brain, 138, 1223, 10.1093/brain/awv046 · DOI
- Wei, 2018, MRI gradient-echo phase contrast of the brain at ultra-short TE with off-resonance saturation, NeuroImage, 175, 1, 10.1016/j.neuroimage.2018.03.066 · DOI
- Wendel, 2018, Corpus callosum vasculature predicts white matter microstructure abnormalities after pediatric mild traumatic brain injury, Journal of Neurotrauma, 23, 10.1089/neu.2018.5670 · DOI
- West, 2018, Myelin volume fraction imaging with MRI, NeuroImage, 182, 511, 10.1016/j.neuroimage.2016.12.067 · DOI
- Wu, 2008, MRI identification of the rostral-caudal pattern of pathology within the corpus callosum in the cuprizone mouse model, Journal of Magnetic Resonance Imaging : JMRI, 27, 446, 10.1002/jmri.21111 · DOI
- Yano, 2018, Quantitative temporal changes in DTI values coupled with histological properties in cuprizone-induced demyelination and remyelination, Neurochemistry International, 119, 151, 10.1016/j.neuint.2017.10.004 · DOI
- Yarnykh, 2012, Fast macromolecular proton fraction mapping from a single off-resonance magnetization transfer measurement, Magnetic Resonance in Medicine, 68, 166, 10.1002/mrm.23224 · DOI
- Zaaraoui, 2008, Monitoring demyelination and remyelination by magnetization transfer imaging in the mouse brain at 9.4 T, Magnetic Resonance Materials in Physics, Biology and Medicine, 21, 357, 10.1007/s10334-008-0141-3 · DOI
- Zhang, 2009, Diffusion tensor magnetic resonance imaging of wallerian degeneration in rat spinal cord after dorsal root axotomy, Journal of Neuroscience, 29, 3160, 10.1523/JNEUROSCI.3941-08.2009 · DOI
Cited by
Sorted by citations
Zhang, F., Daducci, A., He, Y., Schiavi, S., Seguin, C., Smith, R. E., Yeh, C.-H., Zhao, T., & O’Donnell, L. J. (2022) · NeuroImage · doi:10.1016/j.neuroimage.2021.118870 · Cited by 302
“, 2014a), myelin sensitive maps (Lee et al., 2020; Mancini et al., 2020; Piredda et al., 2021) and g-ratio (Campbell et al.”
BackgroundJelescu, I. O., de Skowronski, A., Geffroy, F., Palombo, M., & Novikov, D. S. (2022) · NeuroImage · doi:10.1016/j.neuroimage.2022.119277 · Cited by 177
Lazari, A., & Lipp, I. (2021) · NeuroImage · doi:10.1016/j.neuroimage.2021.117744 · Cited by 176
Positron emission tomography in multiple sclerosis - straight to the target
Bodini, B., Tonietto, M., Airas, L., & Stankoff, B. (2021) · Nature Reviews Neurology · doi:10.1038/s41582-021-00537-1 · Cited by 74
Remyelination in the central nervous system
Franklin, R. J. M., Bodini, B., & Goldman, S. A. (2024) · Cold Spring Harbor Perspectives in Biology · doi:10.1101/cshperspect.a041371 · Cited by 40
Shen, Y., Shen, Y., Wang, M., Jin, K., Yang, P., Cao, Z., Zhu, Q., Zhao, Z., Li, H., Han, L., et al. (2025) · Cell Reports · doi:10.1016/j.celrep.2025.116073 · Cited by 16
Reveley, C., Ye, F. Q., & Leopold, D. A. (2024) · Imaging Neuroscience · doi:10.1162/imag_a_00368 · Cited by 14
Metadata
- Authors
- Mancini, M., Karakuzu, A., Cohen-Adad, J., Cercignani, M., Nichols, T. E., & Stikov, N.
- Affiliations
- Department of Neuroscience, Brighton and Sussex Medical School, University of Sussex, Brighton, United Kingdom
- NeuroPoly Lab, Polytechnique Montreal, Montreal, Canada
- Wellcome Centre for Integrative Neuroimaging (WIN FMRIB), University of Oxford, Oxford, United Kingdom
- Venue
- eLife
- Publisher
- eLife Sciences Publications, Ltd
- Published
- 2020-10-21
- Volume
- 9
- ISSN
- 2050-084X
- PMC
- PMC7647401
- Cited by
- 168
- References
- 8
- Language
- en
- Licence
- Funders
- Wellcome Trust (213722/Z/18/Z)
- National Institutes of Health (R01MH096906)
About these checks
Registry, retraction, Cites and statistics results are computed, not judged, with one exception: a printed reference that no index lists is read once by a model before it counts as a citation error. Claims are extracted by a model and kept only when their quote appears verbatim in the text; each cited source is then checked, with a model’s help, for whether it says what the claim relies on. Those verdicts can be wrong — read the claim’s quote and the cited source before relying on one.
Statistics and arithmetic are recomputed, not judged.
Confidence bands are shown only for fields calibrated on our annotated test set. None is calibrated yet, so no band is shown.
What counts as a claim ›How we measure confidence ›How we check this ›
Are you an author, or do you see a problem with this page? Request a review
