Cited by 18

The DOI matches its Crossref record; 10 of the 10 references it cites were found in a registry or an index.

In Vitro Transcribed mRNA Immunogenicity Induces Chemokine‐Mediated Lymphocyte Recruitment and Can Be Gradually Tailored by Uridine Modification

Drzeniek, Norman M., Kahwaji, Nourhan, Picht, Samira, Dimitriou, Ioanna Maria, Schlickeiser, Stephan, Moradian, Hanieh, Geissler, Sven, Schmueck‐Henneresse, Michael, Gossen, Manfred, Volk, Hans‐Dieter·2024·Advanced Science

Abstract

Beyond SARS‐CoV2 vaccines, mRNA drugs are being explored to overcome today's greatest healthcare burdens, including cancer and cardiovascular disease. Synthetic mRNA triggers immune responses in transfected cells, which can be reduced by chemically modified nucleotides. However, the side effects of mRNA‐triggered immune activation on cell function and how different nucleotides, such as the N1‐methylpseudouridine (m1Ψ) used in SARS‐CoV2 vaccines, can modulate cellular responses is not fully understood. Here, cellular responses toward a library of uridine‐modified mRNAs are investigated in primary human cells. Targeted proteomics analyses reveal that unmodified mRNA induces a pro‐inflammatory paracrine pattern marked by the secretion of chemokines, which recruit T and B lymphocytes toward transfected cells. Importantly, the magnitude of mRNA‐induced changes in cell function varies quantitatively between unmodified, Ψ‐, m1Ψ‐, and 5moU‐modified mRNA and can be gradually tailored, with implications for deliberately exploiting this effect in mRNA drug design. Indeed, both the immunosuppressive effect of stromal cells on T‐cell proliferation, and the anti‐inflammatory effect of IL‐10 mRNA are enhanced by appropriate uridine modification. The results provide new insights into the effects of mRNA drugs on cell function and cell‐cell communication and open new possibilities to tailor mRNA‐triggered immune activation to the desired pro‐ or anti‐inflammatory application.

Overview

The claims and statistics of this paper haven’t been checked yet.

Run the check — free, no account needed. It reads the open-access text and checks the sources it cites.

A few free checks a day · papers already verified open instantly · results are public

Integrity signals

Registry

Crossref · 10.1002/advs.202308447

Cites

10 of 10 references verified0 citation errors · 0 not checkable

Statistics

Figures

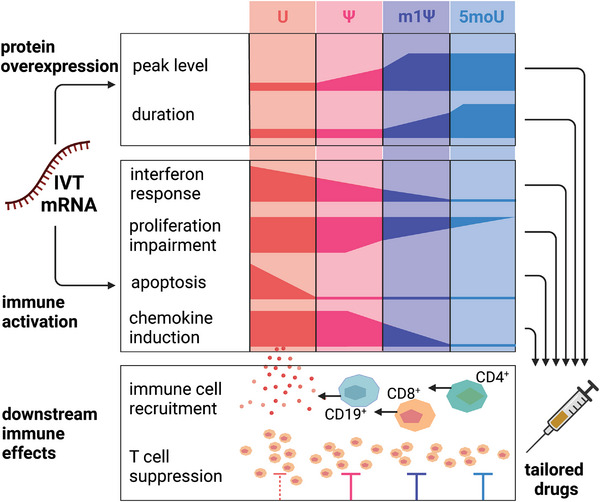
Scheme 1 Study concept and overview. Synthetic mRNA has not one, but two effects on cells: it serves as a template for protein overexpression but also as an immune stimulatory agent. We find that in addition to affecting a range of other cell functions, unmodified mRNA triggers an anti‐viral‐like response in transfected cells and induces a pro‐inflammatory paracrine pattern marked by the secretion of lymphocyte‐attracting chemokines. This mRNA‐induced secretome pattern recruits both T and B lymphocytes, which bears implications and opportunities for consciously exploiting this effect in mRNA drugs.
Scheme 1 Study concept and overview. Synthetic mRNA has not one, but two effects on cells: it serves as a template for protein overexpression but also as an immune stimulatory agent. We find that in addition to affecting a range of other cell functions, unmodified mRNA triggers an anti‐viral‐like response in transfected cells and induces a pro‐inflammatory paracrine pattern marked by the secretion of lymphocyte‐attracting chemokines. This mRNA‐induced secretome pattern recruits both T and B lymphocytes, which bears implications and opportunities for consciously exploiting this effect in mRNA drugs.CC BY · PubMed Central
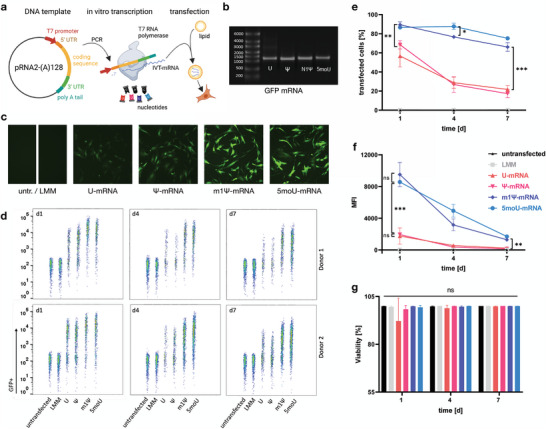
Figure 1 Chemical uridine modifications differently affect mRNA expression levels and kinetics. a) A linearized plasmid containing the coding sequence of interest was used as a template for mRNA in vitro transcription, incorporating the different chemically modified nucleotide triphosphates. This IVT‐mRNA was complexed with cationic lipid and introduced into BMSCs. b) The IVT‐mRNA was run on an agarose gel to exclude impurities and ensure integrity prior to transfection. Single bands are visible for all four transcripts of GFP‐mRNA containing different uridine analogues. c) At day 1 post transfection, BMSCs displayed different levels of GFP fluorescence depending on the mRNA used. d–f) The transfection efficacy and expression levels (MFI = mean fluorescence intensity) was quantified using flow cytometry 1, 3 and 7 days after transfection. m1Ψ‐ and 5moU‐modified mRNA resulted in higher transfection efficacy, expression peaks and durations compared to U‐ or Ψ‐mRNA. Using the same data as input, d) is a dot plot showing the distribution of GFP signal at single cell resolution for one sample of each tested biological donor, e) visualizes the mean percentage of GFP+ cells and f) summarizes the changes in MFI over time. g) mRNA transfection did not reduce cell viability. Only U‐mRNA resulted in a tendential viability drop 1 day after transfection. Data in e)‐g) presented as mean ± SD, n = 4. P‐values are calculated using two‐way ANOVA with Tukey's post‐hoc test, * p<0,05; ** p<0,01; *** p<0001; ns = not significant.
Figure 1 Chemical uridine modifications differently affect mRNA expression levels and kinetics. a) A linearized plasmid containing the coding sequence of interest was used as a template for mRNA in vitro transcription, incorporating the different chemically modified nucleotide triphosphates. This IVT‐mRNA was complexed with cationic lipid and introduced into BMSCs. b) The IVT‐mRNA was run on an agarose gel to exclude impurities and ensure integrity prior to transfection. Single bands are visible for all four transcripts of GFP‐mRNA containing different uridine analogues. c) At day 1 post transfection, BMSCs displayed different levels of GFP fluorescence depending on the mRNA used. d–f) The transfection efficacy and expression levels (MFI = mean fluorescence intensity) was quantified using flow cytometry 1, 3 and 7 days after transfection. m1Ψ‐ and 5moU‐modified mRNA resulted in higher transfection efficacy, expression peaks and durations compared to U‐ or Ψ‐mRNA. Using the same data as input, d) is a dot plot showing the distribution of GFP signal at single cell resolution for one sample of each tested biological donor, e) visualizes the mean percentage of GFP+ cells and f) summarizes the changes in MFI over time. g) mRNA transfection did not reduce cell viability. Only U‐mRNA resulted in a tendential viability drop 1 day after transfection. Data in e)‐g) presented as mean ± SD, n = 4. P‐values are calculated using two‐way ANOVA with Tukey's post‐hoc test, * p<0,05; ** p<0,01; *** p<0001; ns = not significant.CC BY · PubMed Central
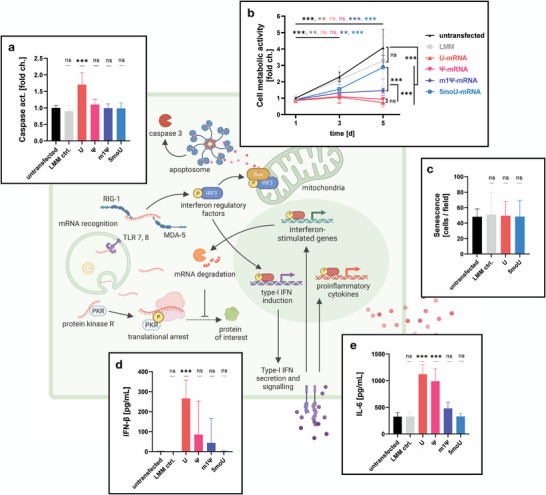
Figure 2 IVT‐mRNA immunogenicity affects phenotype and fitness of transfected cells. White panels display primary data collected for BMSCs. The green background schematic illustrates corresponding known anti‐viral responses against endogenous mRNA, which are further explained in the introduction. a) Compared to untransfected BMSCs and the lipofectamin‐only control (LMM ctrl.), unmodified EGFP mRNA (U) induced a significant increase in caspase activity. n = 8, P‐values are calculated using one‐way ANOVA with Dunnett's post‐hoc test for many‐to‐one comparisons. b) Cell metabolic activity was traced over 5 days post‐transfection to quantify cell proliferation. U‐ and Ψ‐mRNA impaired cell proliferation. n = 8, except d5: n = 12, mixed‐effects analysis with Tukey's post‐hoc test for multiple comparisons. c) mRNA did not induce senescence in transfected cells. Cultures were stained for senescence‐associated β‐galactosidase on day 5 post‐transfection and senescent cells were quantified. n = 6, one‐way ANOVA with Dunnett's post‐hoc test. d) IFN‐β secretion was induced by mRNA transfection, especially with U‐mRNA. In untransfected cells or the 5moU group no IFN‐β was detected in cell supernatants. n = 9, one‐way ANOVA with Dunnett's post‐hoc test. e) IL‐6 secretion was increased by mRNA transfection, especially with U‐mRNA and Ψ‐mRNA. Significance in a, d, e is shown in relation to untransfected BMSCs. n = 9, one‐way ANOVA with Dunnett's post‐hoc test. All data presented as mean ± SD. * p<0,05; ** p<0,01; *** p<0001; ns = not significant.
Figure 2 IVT‐mRNA immunogenicity affects phenotype and fitness of transfected cells. White panels display primary data collected for BMSCs. The green background schematic illustrates corresponding known anti‐viral responses against endogenous mRNA, which are further explained in the introduction. a) Compared to untransfected BMSCs and the lipofectamin‐only control (LMM ctrl.), unmodified EGFP mRNA (U) induced a significant increase in caspase activity. n = 8, P‐values are calculated using one‐way ANOVA with Dunnett's post‐hoc test for many‐to‐one comparisons. b) Cell metabolic activity was traced over 5 days post‐transfection to quantify cell proliferation. U‐ and Ψ‐mRNA impaired cell proliferation. n = 8, except d5: n = 12, mixed‐effects analysis with Tukey's post‐hoc test for multiple comparisons. c) mRNA did not induce senescence in transfected cells. Cultures were stained for senescence‐associated β‐galactosidase on day 5 post‐transfection and senescent cells were quantified. n = 6, one‐way ANOVA with Dunnett's post‐hoc test. d) IFN‐β secretion was induced by mRNA transfection, especially with U‐mRNA. In untransfected cells or the 5moU group no IFN‐β was detected in cell supernatants. n = 9, one‐way ANOVA with Dunnett's post‐hoc test. e) IL‐6 secretion was increased by mRNA transfection, especially with U‐mRNA and Ψ‐mRNA. Significance in a, d, e is shown in relation to untransfected BMSCs. n = 9, one‐way ANOVA with Dunnett's post‐hoc test. All data presented as mean ± SD. * p<0,05; ** p<0,01; *** p<0001; ns = not significant.CC BY · PubMed Central
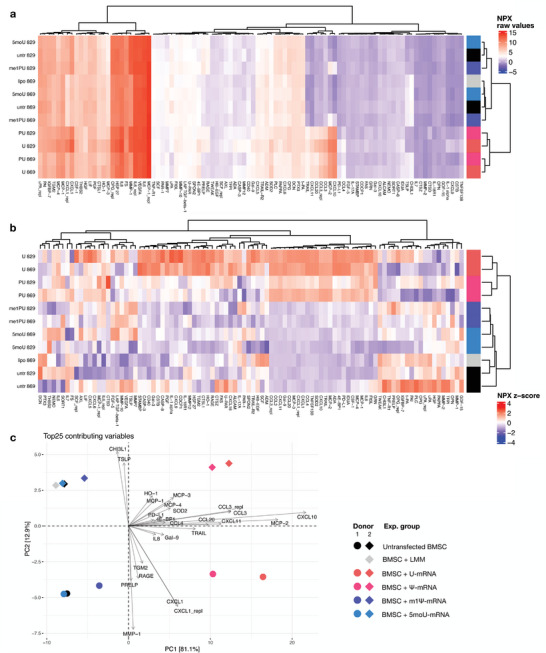
Figure 3 Chemical modification of IVT‐mRNA changes the secretion profile of transfected BMSCs. a) Secretome profiling of mRNA‐transfected and untransfected BMSCs. A cluster of cytokines was strongly induced by U‐ and Ψ‐mRNA. Raw NPX values are shown. b) shows the same data but differences between analyte concentrations in experimental groups are shown as fold change for each individual analyte. Complex shifts in the paracrine pattern were induced by U‐mRNA and by Ψ‐mRNA, irrespective of difference in MSC donor. The secretome pattern of 5moU‐ or m1Ψ‐transfected BMSC and LMM (Lipofectamine Messenger Max) treated BMSCs clustered with that of untreated cells. c) The biplot shows loading vectors (arrows) of the top 25 analytes which contributed most strongly to the total variation within the data. It is overlaid with scores (colored dots and diamonds representing experimental groups) for the two highest ranking principal components of data variation within the principal component analysis (PCA). The PCA reveals that primarily the secretion of chemokines in the U‐ and Ψ‐mRNA groups ‐and to a lesser degree in the m1Ψ group‐ contributed to differences between the different secretomes, with CXCL10 being the most strongly induced factor. Biological differences between BMSC donors (PC2) accounted for 12.9% of the overall data variation. The effect of mRNAs (PC1) was orthogonal to donor differences and comparable in both cell donors. n = 2 cell donors.
Figure 3 Chemical modification of IVT‐mRNA changes the secretion profile of transfected BMSCs. a) Secretome profiling of mRNA‐transfected and untransfected BMSCs. A cluster of cytokines was strongly induced by U‐ and Ψ‐mRNA. Raw NPX values are shown. b) shows the same data but differences between analyte concentrations in experimental groups are shown as fold change for each individual analyte. Complex shifts in the paracrine pattern were induced by U‐mRNA and by Ψ‐mRNA, irrespective of difference in MSC donor. The secretome pattern of 5moU‐ or m1Ψ‐transfected BMSC and LMM (Lipofectamine Messenger Max) treated BMSCs clustered with that of untreated cells. c) The biplot shows loading vectors (arrows) of the top 25 analytes which contributed most strongly to the total variation within the data. It is overlaid with scores (colored dots and diamonds representing experimental groups) for the two highest ranking principal components of data variation within the principal component analysis (PCA). The PCA reveals that primarily the secretion of chemokines in the U‐ and Ψ‐mRNA groups ‐and to a lesser degree in the m1Ψ group‐ contributed to differences between the different secretomes, with CXCL10 being the most strongly induced factor. Biological differences between BMSC donors (PC2) accounted for 12.9% of the overall data variation. The effect of mRNAs (PC1) was orthogonal to donor differences and comparable in both cell donors. n = 2 cell donors.CC BY · PubMed Central
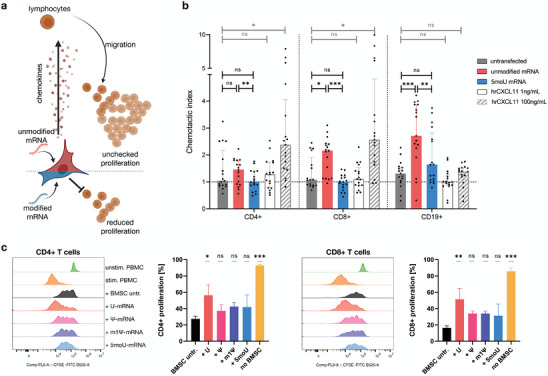
Figure 4 BMSCs transfected with unmodified mRNA attract lymphocytes and display reduced immunomodulatory function. a) Schematic summary of the investigated crosstalk between transfected BMSCs and immune cells. b) PBMC migration was stimulated with BMSC‐conditioned media. BMSCs transfected with unmodified mRNA attracted CD4+ and CD8+ T cells and CD19+ B cells. These effects were not observed for untransfected BMSCs or BMSCs transfected with 5moU‐mRNA. Data presented as median with interquartile range, n = 17. P‐values are calculated using RM one‐way ANOVA with Tukey's post‐hoc test. c) CFSE‐stained PBMCs were polyclonally stimulated and co‐cultured with mRNA‐transfected BMSCs for 5 days. Dilution of the CFSE dye by cell division allowed to quantify T cell proliferation using flow cytometry. BMSCs reduced the proliferation of CD4+ (left) and CD8+ (right) T cells in response to stimulus (histograms). This effect was significantly impaired for U‐mRNA‐transfected BMSCs (bar graphs). Significance is shown in comparison to untransfected BMSCs. Data presented as mean ± SD, n = 3, one‐way ANOVA with Tukey's post‐hoc test. * p<0,05; ** p<0,01; *** p<0001; ns = not significant.
Figure 4 BMSCs transfected with unmodified mRNA attract lymphocytes and display reduced immunomodulatory function. a) Schematic summary of the investigated crosstalk between transfected BMSCs and immune cells. b) PBMC migration was stimulated with BMSC‐conditioned media. BMSCs transfected with unmodified mRNA attracted CD4+ and CD8+ T cells and CD19+ B cells. These effects were not observed for untransfected BMSCs or BMSCs transfected with 5moU‐mRNA. Data presented as median with interquartile range, n = 17. P‐values are calculated using RM one‐way ANOVA with Tukey's post‐hoc test. c) CFSE‐stained PBMCs were polyclonally stimulated and co‐cultured with mRNA‐transfected BMSCs for 5 days. Dilution of the CFSE dye by cell division allowed to quantify T cell proliferation using flow cytometry. BMSCs reduced the proliferation of CD4+ (left) and CD8+ (right) T cells in response to stimulus (histograms). This effect was significantly impaired for U‐mRNA‐transfected BMSCs (bar graphs). Significance is shown in comparison to untransfected BMSCs. Data presented as mean ± SD, n = 3, one‐way ANOVA with Tukey's post‐hoc test. * p<0,05; ** p<0,01; *** p<0001; ns = not significant.CC BY · PubMed Central
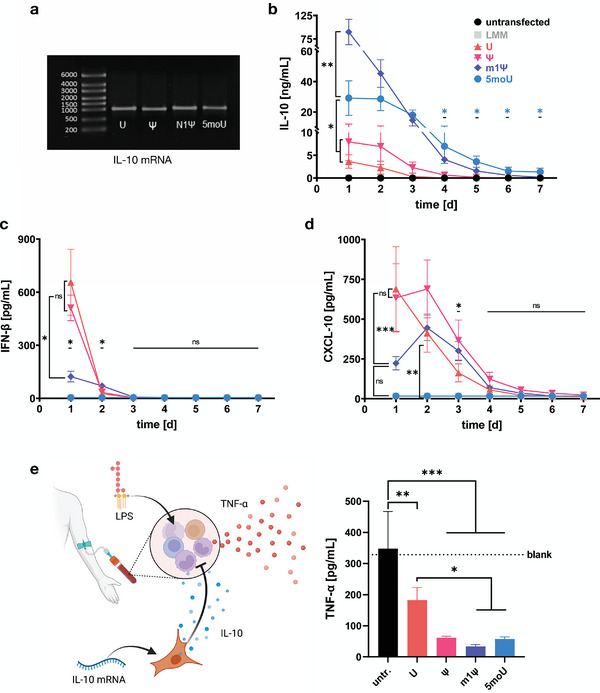
Figure 5 mRNA nucleotide chemistry determines the effectiveness of IL‐10 overexpressing BMSCs in sepsis attenuation model. a) IVT‐mRNA coding for IL‐10 shows high integrity and purity. b) IL‐10 was secreted from transfected BMSCs for up to 6 days (significance shown for 5moU). U‐ and Ψ‐mRNA yielded lower and shorter expression than m1Ψ‐ and 5moU‐mRNA. n ≥ 6. P‐values are calculated using mixed‐effects analysis with Tukey's post‐hoc test. c)‐d) IFN‐β and CXCL10 secretion were measured to assess the immune response against IL‐10‐mRNA. INF‐β was induced by U‐, Ψ‐, and m1Ψ‐mRNA and peaked 1 day post transfection. CXCL10 was secreted in the U‐, and Ψ‐mRNA groups ‐and to a lesser degree in the m1Ψ‐mRNA group‐ until up to 3 days post‐transfection. n = 4, two‐way ANOVA with Tukey's post‐hoc test. e) The efficacy of BMSC‐overexpressed IL‐10 was assessed in a sepsis attenuation model. Human donor blood was challenged with lipopolysaccharide (LPS) and TNF‐α secretion was measured in response. IL‐10 from transfected BMSCs was hypothesized to attenuate the TNF‐α response (schematic). Compared to untransfected BMSCs, all IL‐10 secreting BMSC groups reduced the TNF‐α response. This was significantly less effective in BMSCs transfected with U‐mRNA compared to the m1Ψ and 5moU mRNAs. n = 4, two‐way ANOVA with Tukey's post‐hoc test. All data presented as mean ± SD. * p<0,05; ** p<0,01; *** p<0001; ns = not significant.
Figure 5 mRNA nucleotide chemistry determines the effectiveness of IL‐10 overexpressing BMSCs in sepsis attenuation model. a) IVT‐mRNA coding for IL‐10 shows high integrity and purity. b) IL‐10 was secreted from transfected BMSCs for up to 6 days (significance shown for 5moU). U‐ and Ψ‐mRNA yielded lower and shorter expression than m1Ψ‐ and 5moU‐mRNA. n ≥ 6. P‐values are calculated using mixed‐effects analysis with Tukey's post‐hoc test. c)‐d) IFN‐β and CXCL10 secretion were measured to assess the immune response against IL‐10‐mRNA. INF‐β was induced by U‐, Ψ‐, and m1Ψ‐mRNA and peaked 1 day post transfection. CXCL10 was secreted in the U‐, and Ψ‐mRNA groups ‐and to a lesser degree in the m1Ψ‐mRNA group‐ until up to 3 days post‐transfection. n = 4, two‐way ANOVA with Tukey's post‐hoc test. e) The efficacy of BMSC‐overexpressed IL‐10 was assessed in a sepsis attenuation model. Human donor blood was challenged with lipopolysaccharide (LPS) and TNF‐α secretion was measured in response. IL‐10 from transfected BMSCs was hypothesized to attenuate the TNF‐α response (schematic). Compared to untransfected BMSCs, all IL‐10 secreting BMSC groups reduced the TNF‐α response. This was significantly less effective in BMSCs transfected with U‐mRNA compared to the m1Ψ and 5moU mRNAs. n = 4, two‐way ANOVA with Tukey's post‐hoc test. All data presented as mean ± SD. * p<0,05; ** p<0,01; *** p<0001; ns = not significant.CC BY · PubMed Central
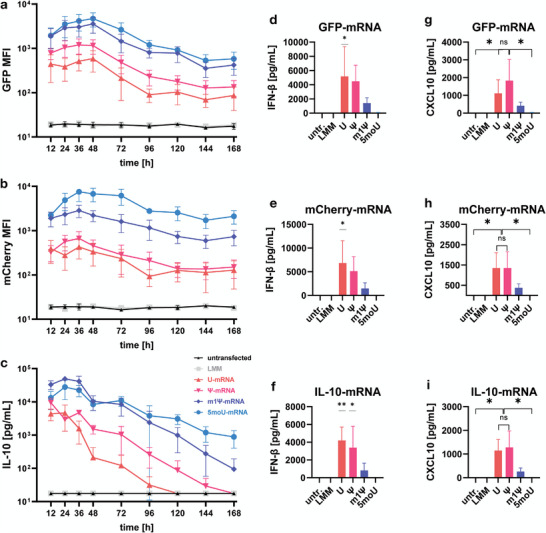
Figure 6 Generalizability of cellular responses to mRNA with different coding sequences. BMSCs were transfected side by side using 3 sets of IVT‐mRNAs coding for EGFP, mCherry or IL‐10. Expression kinetics of the target protein a–c), immune activation represented by the induction of IFN‐β d–f), and chemokine induction g–i) were compared: a,b) The mean fluorescence intensity (MFI) kinetics of the two different fluorescence proteins were quantified using flow cytometry and are closely comparable. c) Secreted IL‐10 was measured in supernatants and shows a similar relationship between mRNA modifications. d–f) The relationship between nucleotide chemistry and IFN‐β induction was closely comparable, regardless of which protein was encoded by the IVT‐mRNA. One‐way ANOVA with Dunnett's post‐hoc test for many‐to‐one comparisons. g–i) The relationship between nucleotide chemistry and CXCL10 induction was closely comparable between mRNAs with different coding sequences. One‐way ANOVA with Tukey's post‐hoc test. All data presented as mean ± SD, all n = 3. * p<0,05; ** p<0,01; *** p<0001; ns = not significant.
Figure 6 Generalizability of cellular responses to mRNA with different coding sequences. BMSCs were transfected side by side using 3 sets of IVT‐mRNAs coding for EGFP, mCherry or IL‐10. Expression kinetics of the target protein a–c), immune activation represented by the induction of IFN‐β d–f), and chemokine induction g–i) were compared: a,b) The mean fluorescence intensity (MFI) kinetics of the two different fluorescence proteins were quantified using flow cytometry and are closely comparable. c) Secreted IL‐10 was measured in supernatants and shows a similar relationship between mRNA modifications. d–f) The relationship between nucleotide chemistry and IFN‐β induction was closely comparable, regardless of which protein was encoded by the IVT‐mRNA. One‐way ANOVA with Dunnett's post‐hoc test for many‐to‐one comparisons. g–i) The relationship between nucleotide chemistry and CXCL10 induction was closely comparable between mRNAs with different coding sequences. One‐way ANOVA with Tukey's post‐hoc test. All data presented as mean ± SD, all n = 3. * p<0,05; ** p<0,01; *** p<0001; ns = not significant.CC BY · PubMed Central

Verification

Claims the paper makes

The claims and statistics of this paper haven’t been checked yet.

Run the check — free, no account needed. It reads the open-access text and checks the sources it cites.

A few free checks a day · papers already verified open instantly · results are public

Claims other papers make about this one

Each is checked against this paper’s own text: does it say what the citing paper says it does?

Self-check

Percentages, sums and reported differences re-computed from the paper’s own numbers.

The self-check needs the paper’s full text.

Citations

Cites

Show all 10 references

Research works printed but not linked: 38

  1. 10.1126/science.aay5967 · DOI · Paper page
  2. 10.1038/s41586-023-06063-y · DOI · Paper page
  3. 10.1038/s41573-021-00355-6 · DOI
  4. 10.1016/j.omtm.2020.05.030 · DOI
  5. 10.1182/blood-2013-04-495119 · DOI
  6. 10.1038/nbt.2682 · DOI · Paper page
  7. 10.1016/j.bbrc.2010.02.150 · DOI
  8. 10.1158/1078-0432.CCR-21-4384 · DOI
  9. 10.1172/JCI61852 · DOI
  10. 10.1021/acs.bioconjchem.6b00090 · DOI
  11. 10.1016/j.omtn.2021.07.009 · DOI
  12. 10.1016/j.tcb.2015.02.001 · DOI
  13. 10.1016/j.biomaterials.2022.121971 · DOI
  14. 10.1021/acs.nanolett.9b04246 · DOI · Paper page
  15. 10.1038/s41467-019-08852-4 · DOI
  16. 10.1016/j.immuni.2005.06.008 · DOI · Paper page
  17. 10.1016/j.jconrel.2015.08.051 · DOI · Paper page
  18. 10.1016/j.stem.2018.05.004 · DOI · Paper page
  19. 10.3390/cells10113101 · DOI
  20. 10.1124/pr.55.2.4 · DOI
  21. 10.1038/nri2436 · DOI
  22. 10.1038/nrmicro2655 · DOI
  23. 10.1002/eji.200737744 · DOI
  24. 10.1128/JVI.02133-10 · DOI
  25. 10.1371/journal.pone.0011756 · DOI
  26. 10.1042/BC20080221 · DOI
  27. 10.1126/scitranslmed.3000112 · DOI
  28. 10.1126/scitranslmed.abb3735 · DOI
  29. 10.3389/fimmu.2019.02474 · DOI · Paper page
  30. 10.1097/SHK.0000000000000557 · DOI
  31. 10.1136/thx.51.2.143 · DOI
  32. 10.1126/scitranslmed.3004754 · DOI
  33. 10.1002/term.1505 · DOI
  34. 10.1186/ar2823 · DOI
  35. 10.1084/jem.187.4.655 · DOI
  36. 10.4049/jimmunol.172.5.2731 · DOI · Paper page
  37. 10.1088/1758-5090/ac0a32 · DOI
  38. 10.3389/fnins.2010.00181 · DOI

Cited by

Sorted by citations

See all 18

Metadata

Authors
Drzeniek, N. M., Kahwaji, N., Picht, S., Dimitriou, I. M., Schlickeiser, S., Moradian, H., Geissler, S., Schmueck‐Henneresse, M., Gossen, M., & Volk, H.
Affiliations
  • Charité – Universitätsmedizin Berlin, corporate member of Freie Universitaet Berlin and Humboldt‐Universitaet zu Berlin Institute of Medical Immunology Augustenburger Platz 1 13353 Berlin Germany
  • Berlin Institute of Health at Charité – Universitätsmedizin Berlin BIH Center for Regenerative Therapies (BCRT) Föhrer Straße 15 13353 Berlin Germany
  • Institute of Active Polymers Helmholtz‐Zentrum Hereon Kantstraße 55 14513 Teltow Germany
Venue
Advanced Science
Publisher
Wiley
Published
2024-03-16
Volume
11
Issue
21
ISSN
2198-3844
Cited by
18
References
10
Language
en
Funders
  • Deutsche Forschungsgemeinschaft (CollaborativeResearchCenter1444(CRC1444))
  • European Health and Digital Executive Agency (101095635—PROTO)
  • Einstein Stiftung Berlin (Advanced_Scientist_Kickbox)
  • Horizon 2020 Framework Programme (733006, 779293)

About these checks

Registry, retraction, Cites and statistics results are computed, not judged, with one exception: a printed reference that no index lists is read once by a model before it counts as a citation error. Claims are extracted by a model and kept only when their quote appears verbatim in the text; each cited source is then checked, with a model’s help, for whether it says what the claim relies on. Those verdicts can be wrong — read the claim’s quote and the cited source before relying on one.

Statistics and arithmetic are recomputed, not judged.

Confidence bands are shown only for fields calibrated on our annotated test set. None is calibrated yet, so no band is shown.

What counts as a claim ›How we measure confidence ›How we check this ›

Are you an author, or do you see a problem with this page? Request a review

How to cite

Cite CoChat for the checks on this page, and the paper for its own findings.

This page
CoChat. (2026). Citation check: In Vitro Transcribed mRNA Immunogenicity Induces Chemokine‐Mediated Lymphocyte Recruitment and Can Be Gradually Tailored by Uridine Modification. https://app.cochat.ai/papers/10.1002/advs.202308447
The paper
Drzeniek, N. M., Kahwaji, N., Picht, S., Dimitriou, I. M., Schlickeiser, S., Moradian, H., Geissler, S., Schmueck‐Henneresse, M., Gossen, M., & Volk, H. (2024). In Vitro Transcribed mRNA Immunogenicity Induces Chemokine‐Mediated Lymphocyte Recruitment and Can Be Gradually Tailored by Uridine Modification. Advanced Science. https://doi.org/10.1002/advs.202308447