Student or educator? Sign up with your school email and get 6 months of Pro free.
Cited by 26

The DOI matches its Crossref record; 16 of the 16 references it cites were found in a registry or an index.

The tau isoform 1N4R confers vulnerability of MAPT knockout human iPSC‐derived neurons to amyloid beta and phosphorylated tau‐induced neuronal dysfunction

Buchholz, Sarah, Kabbani, Mohamed Aghyad Al, Bell‐Simons, Michael, Kluge, Lena, Cagmak, Cagla, Klimek, Jennifer, Haag, Natja, Iohan, Lukas C., Coulon, Audrey, Costa, Marcos R., Kilinc, Devrim, Zempel, Hans·2025·Alzheimer's & Dementia

Abstract

INTRODUCTION: Human tau protein, composed of six brain‐specific isoforms, is a major driver of Alzheimer's disease (AD). The role of its isoforms however remains unclear and human AD models are scarce. METHODS: We generated human MAPT – (tau–) knockout (KO) induced pluripotent stem cells (iPSC) using CRISPR/Cas9, differentiated these into glutamatergic neurons, and assessed isoform‐specific functions of tau in these neurons. We used omic‐ approaches, live‐cell imaging, subcompartmental analysis, and lentivirus‐based reintroduction of specific tau isoforms to investigate isoform‐mediated neuronal dysfunction in an AD model. RESULTS: Tau KO human iPSC‐derived neurons showed decreased neurite outgrowth and axon initial segment length and, notably, resisted amyloid beta oligomer (AβO)–induced neuronal activity reduction. Introducing the 1N4R‐tau isoform, but not other isoforms, confers AβO vulnerability and increases KxGS phosphorylation of tau, without altering neuronal activity or microtubule modifications. DISCUSSION: While tau KO impacts neuronal development and activity, tau‐KO also confers resistance against AβO insult. 1N4R‐tau likely mediates AβO‐induced and phosphorylated tau toxicity, representing a novel prime therapeutic target for AD. Highlights: Tau knockout alters neurite growth and axon initial segment formation in human neurons. Tau isoforms show differential axonal localization in human neurons. Tau depletion protects against amyloid beta oligomer (AβO)–mediated neurotoxicity. 1N4R tau mediates AβO‐induced toxicity in human neurons.

Overview

The claims and statistics of this paper haven’t been checked yet.

Run the check — free, no account needed. It reads the open-access text and checks the sources it cites.

A few free checks a day · papers already verified open instantly · results are public

Integrity signals

Registry

Crossref · 10.1002/alz.14403

Cites

16 of 16 references verified0 citation errors · 0 not checkable

Statistics

Figures

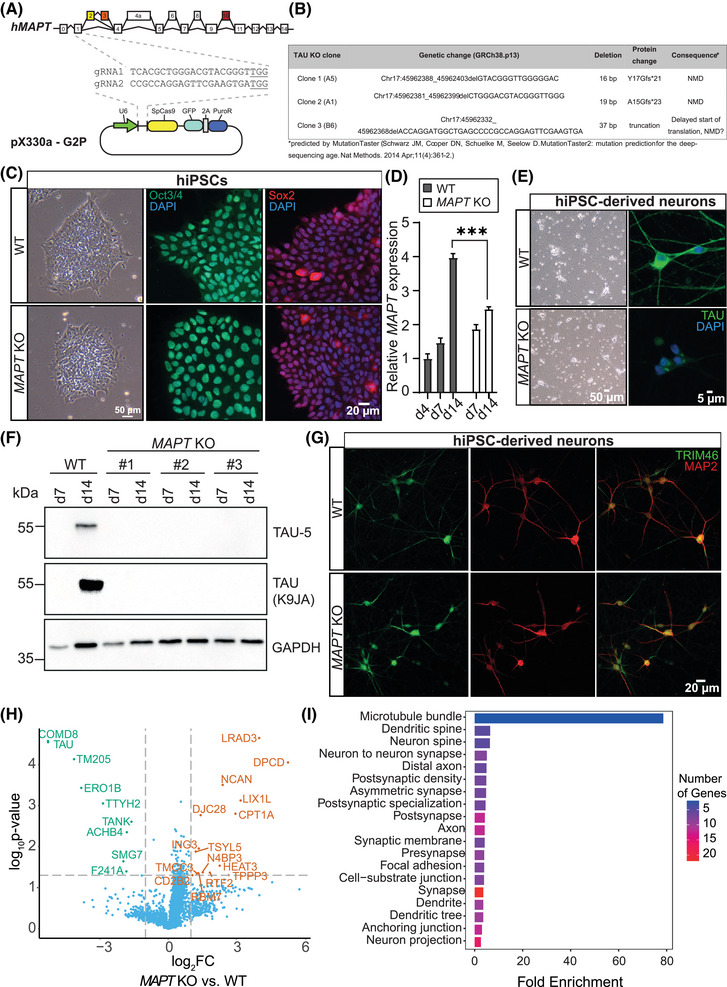
FIGURE 1 Generation of MAPT KO hiPSCs using CRISPR/Cas9. A, Schematic representation of CRISPR/Cas9 editing strategy to generate MAPT KO (= tau KO) hiPSCs. GuideRNAs (gRNAs) were designed to target exon 1 (which is included in all human tau isoforms; see Table S1 in supporting information for sequences) of the MAPT gene and cloned into the Cas9‐expressing vector pX330a‐G2P, harboring a puromycin resistance (PuroR) as well as a GFP, both serving as selection markers. B, Overview of the generated tau KO clones used in this study. All three clones harbor homozygous deletions in exon 1 of the MAPT gene, which likely cause NMD and, subsequently, a PTC. C, Representative brightfield images of WT and tau KO hiPSCs (left panel) and validation of stem cell status by pluripotency markers Oct3/4 (middle panel) and Sox2 (right panel) demonstrate no apparent differences in stem cell properties. D, MAPT mRNA expression (measured by qPCR) in hiPSC‐derived WT and tau KO neurons (iNeurons) shows a clear reduction after neuronal differentiation for 14 days. Error bars represent SEM. Shapiro–Wilk test was performed to test for normal distribution; afterward, statistical analysis was performed by one‐way ANOVA with correction for multiple comparisons (Tukey test). Statistical significance: ***P ≤ 0.001. E, Tau KO iNeurons show normal neuronal morphology in brightfield images (left panel) but lack detectable tau expression in immunofluorescence staining using a monoclonal anti‐tau antibody (right panel, Table S5 in supporting information). F, Absence of tau protein expression was validated in iNeurons of all three tau‐KO clones by western blot analysis. G, Overview immunofluorescence stainings of WT (upper panels) and tau KO iNeurons (lower panels) for the neuronal dendrite marker MAP2 (red), and AIS marker TRIM46 (green) show no apparent differences in neuronal morphology, polarity, or differentiation capacity between the genotypes. H, Volcano plot of differentially regulated proteins identified in tau KO iNeurons compared to WT iNeurons using whole proteome analysis. I, Analysis of GO cellular component of differentially expressed proteins in tau KO iNeurons indicating that most changed proteins are associated with MTs, synapses, and dendritic spines. AIS, axon initial segment; ANOVA, analysis of variance; GFP, green fluorescent protein; GO, Gene Ontology; hiPSCs, human induced pluripotent stem cells; KO, knockout; NMD, nonsense‐medicated decay; PTC, premature termination codon; qPCR, quantitative polymerase chain reaction; SEM, standard error of the mean; WT, wild type
FIGURE 1 Generation of MAPT KO hiPSCs using CRISPR/Cas9. A, Schematic representation of CRISPR/Cas9 editing strategy to generate MAPT KO (= tau KO) hiPSCs. GuideRNAs (gRNAs) were designed to target exon 1 (which is included in all human tau isoforms; see Table S1 in supporting information for sequences) of the MAPT gene and cloned into the Cas9‐expressing vector pX330a‐G2P, harboring a puromycin resistance (PuroR) as well as a GFP, both serving as selection markers. B, Overview of the generated tau KO clones used in this study. All three clones harbor homozygous deletions in exon 1 of the MAPT gene, which likely cause NMD and, subsequently, a PTC. C, Representative brightfield images of WT and tau KO hiPSCs (left panel) and validation of stem cell status by pluripotency markers Oct3/4 (middle panel) and Sox2 (right panel) demonstrate no apparent differences in stem cell properties. D, MAPT mRNA expression (measured by qPCR) in hiPSC‐derived WT and tau KO neurons (iNeurons) shows a clear reduction after neuronal differentiation for 14 days. Error bars represent SEM. Shapiro–Wilk test was performed to test for normal distribution; afterward, statistical analysis was performed by one‐way ANOVA with correction for multiple comparisons (Tukey test). Statistical significance: ***P ≤ 0.001. E, Tau KO iNeurons show normal neuronal morphology in brightfield images (left panel) but lack detectable tau expression in immunofluorescence staining using a monoclonal anti‐tau antibody (right panel, Table S5 in supporting information). F, Absence of tau protein expression was validated in iNeurons of all three tau‐KO clones by western blot analysis. G, Overview immunofluorescence stainings of WT (upper panels) and tau KO iNeurons (lower panels) for the neuronal dendrite marker MAP2 (red), and AIS marker TRIM46 (green) show no apparent differences in neuronal morphology, polarity, or differentiation capacity between the genotypes. H, Volcano plot of differentially regulated proteins identified in tau KO iNeurons compared to WT iNeurons using whole proteome analysis. I, Analysis of GO cellular component of differentially expressed proteins in tau KO iNeurons indicating that most changed proteins are associated with MTs, synapses, and dendritic spines. AIS, axon initial segment; ANOVA, analysis of variance; GFP, green fluorescent protein; GO, Gene Ontology; hiPSCs, human induced pluripotent stem cells; KO, knockout; NMD, nonsense‐medicated decay; PTC, premature termination codon; qPCR, quantitative polymerase chain reaction; SEM, standard error of the mean; WT, wild typeCC BY-NC-ND · PubMed Central
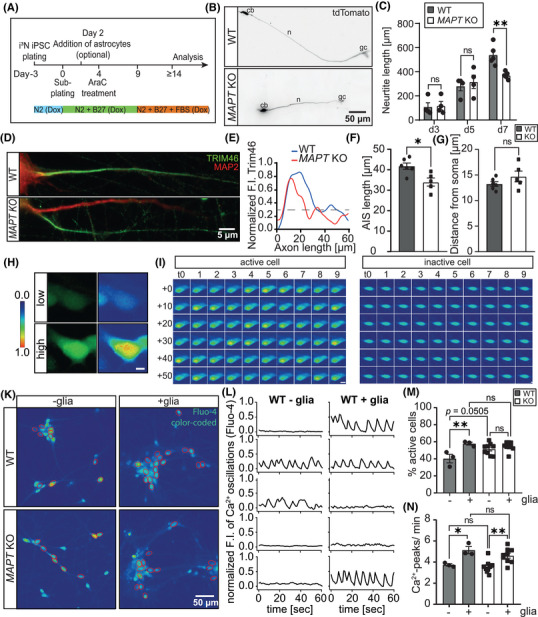
FIGURE 2 Knockout of tau causes mild deficits in neurite growth and AIS formation but does not alter neuronal activity. A, Schematic overview of the differentiation protocol for hiPSCs into glutamatergic neurons based on the doxycycline‐induced expression of transcription factor Ngn2. 35 , 36 B, Representative fluorescence images of WT (stitched) and tau KO iNeurons (d7) transfected with tdTomato, indicating reduced neurite length of tau KO iNeurons. C, Quantification of neurite length of WT and tau KO iNeurons 3, 5, and 7 days after the start of differentiation demonstrate reduced neurite extensions only after d7. Error bars represent SEM; Shapiro–Wilk test was performed to test for normal distribution; afterward, statistical analysis was performed by one‐way ANOVA with correction for multiple comparisons (Tukey test). N = 4, n = 20. Statistical significance: **P ≤ 0.01. D, Representative immunofluorescence images of WT and tau KO iNeurons stained for the axon initial segment marker TRIM46 (green) at d18 of differentiation. Axons were defined by the absence of MAP2 (dendritic marker, red) signal and the presence of TRIM46 staining. E, Representative profile of normalized Trim46 signal from the AIS depicted in (D). The AIS was defined as a TRIM46 signal > 0.3 of the maximum F.I. Quantification of the AIS length (F) and distance from soma (G) in d18 WT and tau KO iNeurons: tau KO leads to reduced AIS length but may not change the distance from soma. Error bars represent SEM; Shapiro–Wilk test was performed to test for normal distribution; afterward, statistical analysis was performed by a two‐tailed unpaired t test. N = 4, n = 20. Statistical significance: *P ≤ 0.05, ns, not significant. H, Example images of an inactive cell (characterized by low levels of Fluo‐4, upper panels) and an active cell (characterized by elevated levels of Fluo‐4, lower panels); scale bar = 5 µm. Serial images of an active (I) and an inactive cell (J) over the whole recording period, from t = 0 seconds to t = 60 seconds as indicated; scale bar = 10 µm. K, Representative images of WT and tau KO iNeurons stained with calcium sensor Fluo‐4 (pseudo‐colored). Red circles mark active cells, characterized by spontaneous calcium oscillations. L, Exemplary traces of Fluo‐4 signal intensity over 1 minute of WT and tau KO iNeurons, indicating spontaneous calcium oscillations and no differences in peak frequency or height between genotypes. M, Quantification of the percentage of active cells within neuronal cultures as assessed by live‐cell calcium imaging of WT and tau KO iNeurons (d14) in dependence of co‐cultures with primary astrocytes (= glia) showing increased neuronal activity of WT iNeurons, when cells are co‐cultured with astrocytes. Tau KO iNeurons show higher neuronal activity when cultured alone but not when co‐cultured with astrocytes. Error bars represent SEM; Shapiro–Wilk test was performed to test for normal distribution; afterward, statistical analysis was performed by two‐way ANOVA with correction for multiple comparisons (Tukey test). N = 3–9, n > 3000. Statistical significance: *P ≤ 0.05, **P ≤ 0.01, ***P ≤ 0.001, ns, not significant. N, Calcium peak count per minute compared between both genotypes in dependence of co‐cultures with primary astrocytes shows that co‐cultures with glia cells increase calcium peak frequency of WT and tau KO iNeurons. Error bars represent SEM; Shapiro–Wilk test was performed to test for normal distribution; afterward, statistical analysis was performed by two‐way ANOVA with correction for multiple comparisons (Tukey test). N = 3–9, n > 3000. Statistical significance: *P ≤ 0.05, **P ≤ 0.01, ***P ≤ 0.001. AIS, axon initial segment; ANOVA, analysis of variance; cb, cell body; F.I., fluorescence intensity; gc, growth cone; hiPSCs, human induced pluripotent stem cells; KO, knockout; n, neurite; SEM, standard error of the mean; WT, wild type
FIGURE 2 Knockout of tau causes mild deficits in neurite growth and AIS formation but does not alter neuronal activity. A, Schematic overview of the differentiation protocol for hiPSCs into glutamatergic neurons based on the doxycycline‐induced expression of transcription factor Ngn2. 35 , 36 B, Representative fluorescence images of WT (stitched) and tau KO iNeurons (d7) transfected with tdTomato, indicating reduced neurite length of tau KO iNeurons. C, Quantification of neurite length of WT and tau KO iNeurons 3, 5, and 7 days after the start of differentiation demonstrate reduced neurite extensions only after d7. Error bars represent SEM; Shapiro–Wilk test was performed to test for normal distribution; afterward, statistical analysis was performed by one‐way ANOVA with correction for multiple comparisons (Tukey test). N = 4, n = 20. Statistical significance: **P ≤ 0.01. D, Representative immunofluorescence images of WT and tau KO iNeurons stained for the axon initial segment marker TRIM46 (green) at d18 of differentiation. Axons were defined by the absence of MAP2 (dendritic marker, red) signal and the presence of TRIM46 staining. E, Representative profile of normalized Trim46 signal from the AIS depicted in (D). The AIS was defined as a TRIM46 signal > 0.3 of the maximum F.I. Quantification of the AIS length (F) and distance from soma (G) in d18 WT and tau KO iNeurons: tau KO leads to reduced AIS length but may not change the distance from soma. Error bars represent SEM; Shapiro–Wilk test was performed to test for normal distribution; afterward, statistical analysis was performed by a two‐tailed unpaired t test. N = 4, n = 20. Statistical significance: *P ≤ 0.05, ns, not significant. H, Example images of an inactive cell (characterized by low levels of Fluo‐4, upper panels) and an active cell (characterized by elevated levels of Fluo‐4, lower panels); scale bar = 5 µm. Serial images of an active (I) and an inactive cell (J) over the whole recording period, from t = 0 seconds to t = 60 seconds as indicated; scale bar = 10 µm. K, Representative images of WT and tau KO iNeurons stained with calcium sensor Fluo‐4 (pseudo‐colored). Red circles mark active cells, characterized by spontaneous calcium oscillations. L, Exemplary traces of Fluo‐4 signal intensity over 1 minute of WT and tau KO iNeurons, indicating spontaneous calcium oscillations and no differences in peak frequency or height between genotypes. M, Quantification of the percentage of active cells within neuronal cultures as assessed by live‐cell calcium imaging of WT and tau KO iNeurons (d14) in dependence of co‐cultures with primary astrocytes (= glia) showing increased neuronal activity of WT iNeurons, when cells are co‐cultured with astrocytes. Tau KO iNeurons show higher neuronal activity when cultured alone but not when co‐cultured with astrocytes. Error bars represent SEM; Shapiro–Wilk test was performed to test for normal distribution; afterward, statistical analysis was performed by two‐way ANOVA with correction for multiple comparisons (Tukey test). N = 3–9, n > 3000. Statistical significance: *P ≤ 0.05, **P ≤ 0.01, ***P ≤ 0.001, ns, not significant. N, Calcium peak count per minute compared between both genotypes in dependence of co‐cultures with primary astrocytes shows that co‐cultures with glia cells increase calcium peak frequency of WT and tau KO iNeurons. Error bars represent SEM; Shapiro–Wilk test was performed to test for normal distribution; afterward, statistical analysis was performed by two‐way ANOVA with correction for multiple comparisons (Tukey test). N = 3–9, n > 3000. Statistical significance: *P ≤ 0.05, **P ≤ 0.01, ***P ≤ 0.001. AIS, axon initial segment; ANOVA, analysis of variance; cb, cell body; F.I., fluorescence intensity; gc, growth cone; hiPSCs, human induced pluripotent stem cells; KO, knockout; n, neurite; SEM, standard error of the mean; WT, wild typeCC BY-NC-ND · PubMed Central
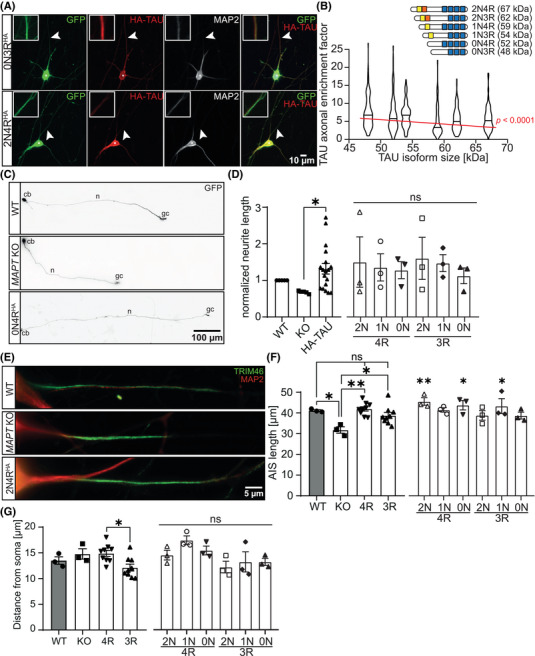
FIGURE 3 Re‐expression of tau isoforms in tau KO iNeurons rescues deficits in neurite outgrowth and AIS formation. A, Representative IF images of tau KO iNeurons transduced with either 0N3RHA (middle panels) or 2N4RHA tau (lower panels) together with GFP as a volume marker. Boxes show 9‐fold magnified and 5‐fold enhanced contrast of (dashed) regions indicated by arrowhead. Larger tau isoform show less axonal targeting than smaller tau isoforms. B, Correlation of tau isoform size (in kDa) with the efficiency of axonal sorting indicates that axonal enrichment depends on tau isoform size. The red line represents the linear regression, which shows a significant incline. The bars on the top right represent the individual isoforms, which differ in the number of N‐terminal inserts (yellow and red boxes) and the number of C‐terminal repeats (represented by blue boxes) and harbor different protein masses. C, Representative images of WT and tau KO iNeurons transduced with GFP (as a volume marker), as well as tau KO iNeurons, transduced with 0N4RHA tau and GFP (images were stitched using ImageJ), indicating restored neurite length for tau KO iNeurons expressing 0N4RHA tau. D, Neurite length was quantified after re‐expression of individual tau isoforms in tau‐KO iNeurons and shows that all isoforms can restore the deficits in neurite outgrowth (significant when all isoforms are pooled). Error bars represent SEM. Shapiro–Wilk test was performed to test for normal distribution; afterward, statistical analysis was performed by one‐way ANOVA with correction for multiple comparisons (Tukey test). N = 3–5, n = 15–20. Statistical significance: *P ≤ 0.05, ns, not significant. E, Representative IF images of AIS marker Trim46 and dendrite marker MAP2 in WT, tau KO iNeurons, and tau KO iNeurons expressing 2N4RHA tau. AIS length (F) and distance from soma (G) were quantified for WT, tau KO, and re‐expressed tau isoforms in d18 iNeurons. Tau expression tends to increase AIS length and may alter the AIS distance from the soma. Error bars represent SEM. Shapiro–Wilk test was performed to test for normal distribution; afterward, statistical analysis was performed by one‐way ANOVA with correction for multiple comparisons (Tukey test). N = 3, n = 20. Statistical significance: *P ≤ 0.05, **P ≤ 0.01, ***P ≤ 0.001, ns, not significant. AIS, axon initial segment; cb, cell body; gc, growth cone; GFP, green fluorescent protein; IF, immunofluorescence; KO, knockout; n, neurite; SEM, standard error of the mean; WT, wild type
FIGURE 3 Re‐expression of tau isoforms in tau KO iNeurons rescues deficits in neurite outgrowth and AIS formation. A, Representative IF images of tau KO iNeurons transduced with either 0N3RHA (middle panels) or 2N4RHA tau (lower panels) together with GFP as a volume marker. Boxes show 9‐fold magnified and 5‐fold enhanced contrast of (dashed) regions indicated by arrowhead. Larger tau isoform show less axonal targeting than smaller tau isoforms. B, Correlation of tau isoform size (in kDa) with the efficiency of axonal sorting indicates that axonal enrichment depends on tau isoform size. The red line represents the linear regression, which shows a significant incline. The bars on the top right represent the individual isoforms, which differ in the number of N‐terminal inserts (yellow and red boxes) and the number of C‐terminal repeats (represented by blue boxes) and harbor different protein masses. C, Representative images of WT and tau KO iNeurons transduced with GFP (as a volume marker), as well as tau KO iNeurons, transduced with 0N4RHA tau and GFP (images were stitched using ImageJ), indicating restored neurite length for tau KO iNeurons expressing 0N4RHA tau. D, Neurite length was quantified after re‐expression of individual tau isoforms in tau‐KO iNeurons and shows that all isoforms can restore the deficits in neurite outgrowth (significant when all isoforms are pooled). Error bars represent SEM. Shapiro–Wilk test was performed to test for normal distribution; afterward, statistical analysis was performed by one‐way ANOVA with correction for multiple comparisons (Tukey test). N = 3–5, n = 15–20. Statistical significance: *P ≤ 0.05, ns, not significant. E, Representative IF images of AIS marker Trim46 and dendrite marker MAP2 in WT, tau KO iNeurons, and tau KO iNeurons expressing 2N4RHA tau. AIS length (F) and distance from soma (G) were quantified for WT, tau KO, and re‐expressed tau isoforms in d18 iNeurons. Tau expression tends to increase AIS length and may alter the AIS distance from the soma. Error bars represent SEM. Shapiro–Wilk test was performed to test for normal distribution; afterward, statistical analysis was performed by one‐way ANOVA with correction for multiple comparisons (Tukey test). N = 3, n = 20. Statistical significance: *P ≤ 0.05, **P ≤ 0.01, ***P ≤ 0.001, ns, not significant. AIS, axon initial segment; cb, cell body; gc, growth cone; GFP, green fluorescent protein; IF, immunofluorescence; KO, knockout; n, neurite; SEM, standard error of the mean; WT, wild typeCC BY-NC-ND · PubMed Central
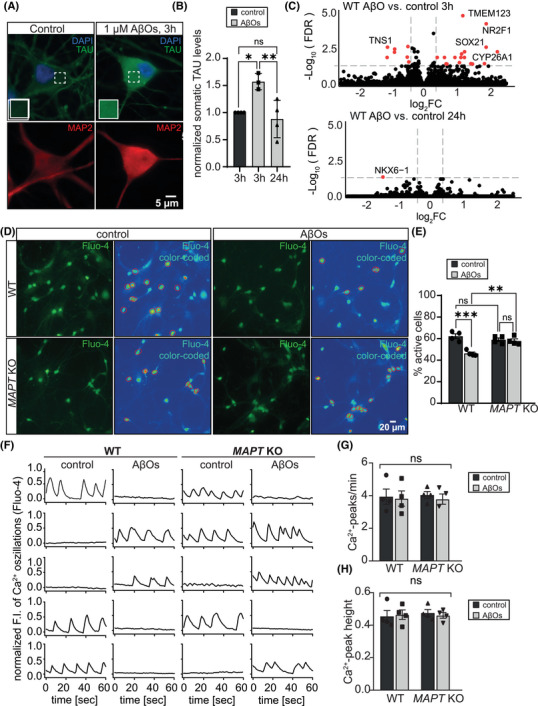
FIGURE 4 Tau KO iNeurons are protected against AβO‐induced reduction of neuronal activity. A, Representative IF images of WT iNeurons (d21) treated either with a vehicle control or 1 µM AβOs for 3 hours. Compared to control cells, neurons treated with AβOs showed increased somatic levels of tau. Inlets show magnification of the neurons’ somata (boxed area). B, Quantification of the somatic levels of tau in WT iNeurons after treatment with a vehicle control or 1 µM AβOs for 3 and 24 hours. Treatment with AβOs for 3 hours is sufficient to induce pathological mis‐sorting of tau. Error bars represent SEM. Shapiro–Wilk test was performed to test for normal distribution; afterward, statistical analysis was performed by one‐way ANOVA with correction for multiple comparisons (Tukey test). N = 3–4, n = −30. Statistical significance: *P ≤ 0.05, **P ≤ 0.01, ***P ≤ 0.001, ns, not significant. C, Volcano plot of DEGs of WT iNeurons treated with vehicle control or AβOs for 3 and 24 hours, respectively, assessed by bulk RNAseq. D, Representative images of WT and tau KO iNeurons (d21) stained with calcium sensor Fluo‐4 after treatment with AβOs for 1 hour. Red circles mark active cells, characterized by spontaneous calcium oscillations. E, Quantification of the percentage of active cells in cultures of WT and tau KO iNeurons (d21) after acute treatment with AβOs for 1 hours. WT neurons show reduced neuronal activity after treatment with AβOs, while there is no effect on tau KO neuronal activity. Error bars represent SEM. Shapiro–Wilk test was performed to test for normal distribution; afterward, statistical analysis was performed by two‐way ANOVA with correction for multiple comparisons (Tukey test). N = 3–4, n > 1500. Statistical significance: *P ≤ 0.05, **P ≤ 0.01, ***P ≤ 0.001, ns, not significant. F, Exemplary traces of Fluo‐4 signal intensity over 1 minute of WT and tau KO iNeurons treated with a vehicle control or AβOs for 1 hour, indicating spontaneous calcium oscillations and no differences in peak frequency or height between genotypes and treatments. G, Calcium peak count per minute quantified for WT and tau KO iNeurons after treatment with AβOs for 1 hour. Error bars represent SEM.; Shapiro–Wilk test was performed to test for normal distribution; afterward, statistical analysis was performed by two‐way ANOVA with correction for multiple comparisons (Tukey test). N = 3–4, n > 1500. Ns, not significant. H, Calcium peak height after 1 hour treatment of WT and tau KO iNeurons with AβOs. Error bars represent SEM. Shapiro–Wilk test was performed to test for normal distribution; afterward, statistical analysis was performed by two‐way ANOVA with correction for multiple comparisons (Tukey test). N = 3–4, n > 1500. Ns, not significant. AβO, amyloid beta oligomer; ANOVA, analysis of variance; DEGs, differentially expressed genes; IF, immunofluorescence; KO, knockout; SEM, standard error of the mean; WT, wild type
FIGURE 4 Tau KO iNeurons are protected against AβO‐induced reduction of neuronal activity. A, Representative IF images of WT iNeurons (d21) treated either with a vehicle control or 1 µM AβOs for 3 hours. Compared to control cells, neurons treated with AβOs showed increased somatic levels of tau. Inlets show magnification of the neurons’ somata (boxed area). B, Quantification of the somatic levels of tau in WT iNeurons after treatment with a vehicle control or 1 µM AβOs for 3 and 24 hours. Treatment with AβOs for 3 hours is sufficient to induce pathological mis‐sorting of tau. Error bars represent SEM. Shapiro–Wilk test was performed to test for normal distribution; afterward, statistical analysis was performed by one‐way ANOVA with correction for multiple comparisons (Tukey test). N = 3–4, n = −30. Statistical significance: *P ≤ 0.05, **P ≤ 0.01, ***P ≤ 0.001, ns, not significant. C, Volcano plot of DEGs of WT iNeurons treated with vehicle control or AβOs for 3 and 24 hours, respectively, assessed by bulk RNAseq. D, Representative images of WT and tau KO iNeurons (d21) stained with calcium sensor Fluo‐4 after treatment with AβOs for 1 hour. Red circles mark active cells, characterized by spontaneous calcium oscillations. E, Quantification of the percentage of active cells in cultures of WT and tau KO iNeurons (d21) after acute treatment with AβOs for 1 hours. WT neurons show reduced neuronal activity after treatment with AβOs, while there is no effect on tau KO neuronal activity. Error bars represent SEM. Shapiro–Wilk test was performed to test for normal distribution; afterward, statistical analysis was performed by two‐way ANOVA with correction for multiple comparisons (Tukey test). N = 3–4, n > 1500. Statistical significance: *P ≤ 0.05, **P ≤ 0.01, ***P ≤ 0.001, ns, not significant. F, Exemplary traces of Fluo‐4 signal intensity over 1 minute of WT and tau KO iNeurons treated with a vehicle control or AβOs for 1 hour, indicating spontaneous calcium oscillations and no differences in peak frequency or height between genotypes and treatments. G, Calcium peak count per minute quantified for WT and tau KO iNeurons after treatment with AβOs for 1 hour. Error bars represent SEM.; Shapiro–Wilk test was performed to test for normal distribution; afterward, statistical analysis was performed by two‐way ANOVA with correction for multiple comparisons (Tukey test). N = 3–4, n > 1500. Ns, not significant. H, Calcium peak height after 1 hour treatment of WT and tau KO iNeurons with AβOs. Error bars represent SEM. Shapiro–Wilk test was performed to test for normal distribution; afterward, statistical analysis was performed by two‐way ANOVA with correction for multiple comparisons (Tukey test). N = 3–4, n > 1500. Ns, not significant. AβO, amyloid beta oligomer; ANOVA, analysis of variance; DEGs, differentially expressed genes; IF, immunofluorescence; KO, knockout; SEM, standard error of the mean; WT, wild typeCC BY-NC-ND · PubMed Central
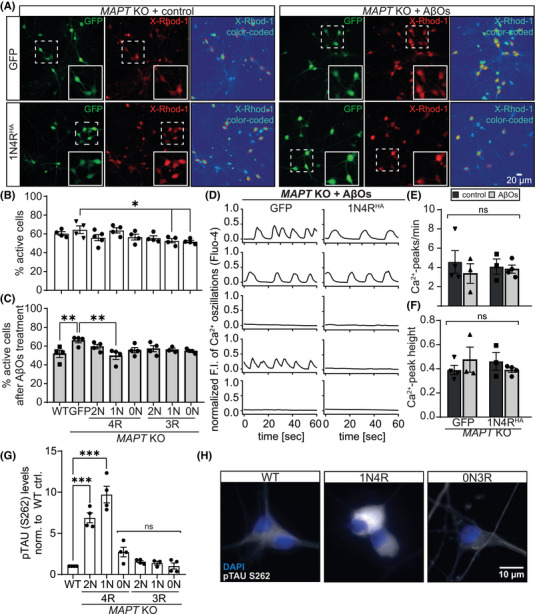
FIGURE 5 1N4R tau restores vulnerability of tau KO iNeurons to AβO‐induced neuronal activity reduction. A, Representative images of tau KO iNeurons (d21) expressing either GFP (upper panels) or GFP together with 1N4R tau (lower panels). Neurons were stained with calcium sensor X‐Rhod‐1 after treatment with a vehicle control or AβOs for 1 hour. Red circles mark active cells, characterized by spontaneous calcium oscillations, inlets (boxed areas) show a 4‐fold magnification of cells. B, Quantification of the percentage of active cells in cultures of WT and tau KO iNeurons (d21) re‐expressing either GFP or individual tau isoforms. Tau KO iNeurons expressing either 1N3R or 0N3R show reduced neuronal activity compared to tau KO iNeurons expressing GFP. Error bars represent SEM. Shapiro–Wilk test was performed to test for normal distribution; afterward, statistical analysis was performed by two‐way ANOVA with correction for multiple comparisons (Tukey test). N = 4, n > 1500. Statistical significance: *P ≤ 0.05, **P ≤ 0.01, ***P ≤ 0.001, ns, not significant. C, Quantification of the percentage of active cells in cultures of WT and tau KO iNeurons (d21) re‐expressing either GFP or individual tau isoforms after acute treatment with AβOs for 1 hour. Re‐expression of 1N4R‐tau re‐sensitized tau‐KO iNeurons to AβO‐induced reduction of neuronal activity. Error bars represent SEM. Shapiro–Wilk test was performed to test for normal distribution; afterward, statistical analysis was performed by two‐way ANOVA with correction for multiple comparisons (Tukey test). N = 4, n > 1500. Statistical significance: *P ≤ 0.05, **P ≤ 0.01, ***P ≤ 0.001, ns, not significant. D, Exemplary traces of Fluo‐4 signal intensity over 1 minute of tau KO iNeurons expressing either GFP or 1N4R tau after treatment with 1 µM AβOs for 1 hour, indicating spontaneous calcium oscillations and no differences in peak frequency or height between genotypes and treatments. E, Calcium peak count per minute was quantified for tau KO iNeurons transduced with GFP or 1N4R tau after treatment with AβOs for 1 hour using an automated workflow. Error bars represent SEM. Shapiro–Wilk test was performed to test for normal distribution; afterward, statistical analysis was performed by two‐way ANOVA with correction for multiple comparisons (Tukey test). N = 3–4, n > 1500. Ns, not significant. F, Calcium peak height was quantified using an automated workflow after 1 hour treatment with AβOs of tau KO iNeurons expressing either GFP or 1N4R tau. Error bars represent SEM. Shapiro–Wilk test was performed to test for normal distribution; afterward, statistical analysis was performed by two‐way ANOVA with correction for multiple comparisons (Tukey test). N = 3–4, n > 1500. Ns, not significant. G, Quantification of p‐tau S262 levels in WT and tau‐KO iNeurons transduced with HA‐tagged tau isoforms. Error bars represent SEM. Shapiro–Wilk test was performed to test for normal distribution; afterward, statistical analysis was performed by one‐way ANOVA with correction for multiple comparisons (Tukey test). N = 3–4, n = 20. Statistical significance: ***P ≤ 0.001, ns, not significant. H, Representative immunofluorescent images of WT and tau KO iNeurons transduced with 1N4RHA or 0N3RHA tau isoforms and stained for phosphorylated tau at S262. AβO, amyloid beta oligomer; ANOVA, analysis of variance; KO, knockout; SEM, standard error of the mean; WT, wild type
FIGURE 5 1N4R tau restores vulnerability of tau KO iNeurons to AβO‐induced neuronal activity reduction. A, Representative images of tau KO iNeurons (d21) expressing either GFP (upper panels) or GFP together with 1N4R tau (lower panels). Neurons were stained with calcium sensor X‐Rhod‐1 after treatment with a vehicle control or AβOs for 1 hour. Red circles mark active cells, characterized by spontaneous calcium oscillations, inlets (boxed areas) show a 4‐fold magnification of cells. B, Quantification of the percentage of active cells in cultures of WT and tau KO iNeurons (d21) re‐expressing either GFP or individual tau isoforms. Tau KO iNeurons expressing either 1N3R or 0N3R show reduced neuronal activity compared to tau KO iNeurons expressing GFP. Error bars represent SEM. Shapiro–Wilk test was performed to test for normal distribution; afterward, statistical analysis was performed by two‐way ANOVA with correction for multiple comparisons (Tukey test). N = 4, n > 1500. Statistical significance: *P ≤ 0.05, **P ≤ 0.01, ***P ≤ 0.001, ns, not significant. C, Quantification of the percentage of active cells in cultures of WT and tau KO iNeurons (d21) re‐expressing either GFP or individual tau isoforms after acute treatment with AβOs for 1 hour. Re‐expression of 1N4R‐tau re‐sensitized tau‐KO iNeurons to AβO‐induced reduction of neuronal activity. Error bars represent SEM. Shapiro–Wilk test was performed to test for normal distribution; afterward, statistical analysis was performed by two‐way ANOVA with correction for multiple comparisons (Tukey test). N = 4, n > 1500. Statistical significance: *P ≤ 0.05, **P ≤ 0.01, ***P ≤ 0.001, ns, not significant. D, Exemplary traces of Fluo‐4 signal intensity over 1 minute of tau KO iNeurons expressing either GFP or 1N4R tau after treatment with 1 µM AβOs for 1 hour, indicating spontaneous calcium oscillations and no differences in peak frequency or height between genotypes and treatments. E, Calcium peak count per minute was quantified for tau KO iNeurons transduced with GFP or 1N4R tau after treatment with AβOs for 1 hour using an automated workflow. Error bars represent SEM. Shapiro–Wilk test was performed to test for normal distribution; afterward, statistical analysis was performed by two‐way ANOVA with correction for multiple comparisons (Tukey test). N = 3–4, n > 1500. Ns, not significant. F, Calcium peak height was quantified using an automated workflow after 1 hour treatment with AβOs of tau KO iNeurons expressing either GFP or 1N4R tau. Error bars represent SEM. Shapiro–Wilk test was performed to test for normal distribution; afterward, statistical analysis was performed by two‐way ANOVA with correction for multiple comparisons (Tukey test). N = 3–4, n > 1500. Ns, not significant. G, Quantification of p‐tau S262 levels in WT and tau‐KO iNeurons transduced with HA‐tagged tau isoforms. Error bars represent SEM. Shapiro–Wilk test was performed to test for normal distribution; afterward, statistical analysis was performed by one‐way ANOVA with correction for multiple comparisons (Tukey test). N = 3–4, n = 20. Statistical significance: ***P ≤ 0.001, ns, not significant. H, Representative immunofluorescent images of WT and tau KO iNeurons transduced with 1N4RHA or 0N3RHA tau isoforms and stained for phosphorylated tau at S262. AβO, amyloid beta oligomer; ANOVA, analysis of variance; KO, knockout; SEM, standard error of the mean; WT, wild typeCC BY-NC-ND · PubMed Central

Verification

Claims the paper makes

The claims and statistics of this paper haven’t been checked yet.

Run the check — free, no account needed. It reads the open-access text and checks the sources it cites.

A few free checks a day · papers already verified open instantly · results are public

Claims other papers make about this one

Each is checked against this paper’s own text: does it say what the citing paper says it does?

Self-check

Percentages, sums and reported differences re-computed from the paper’s own numbers.

The self-check needs the paper’s full text.

Citations

Cites

Show all 16 references

Research works printed but not linked: 66

  1. 10.1002/alz.13784 · DOI
  2. 10.1155/2012/873270 · DOI
  3. 10.1242/jcs.114.6.1179 · DOI · Paper page
  4. 10.1038/343461a0 · DOI · Paper page
  5. 10.1523/JNEUROSCI.11‐06‐01515.1991 · DOI · Paper page
  6. 10.1523/JNEUROSCI.18‐21‐08660.1998 · DOI
  7. 10.1002/ALZ.052863 · DOI
  8. 10.1093/BRAIN/AWZ090 · DOI · Paper page
  9. 10.1002/1531-8249(199903)45:3 · DOI
  10. 10.1097/NEN.0B013E31825018F7 · DOI · Paper page
  11. 10.1073/pnas.092136199 · DOI · Paper page
  12. 10.1126/SCIENCE.1141736 · DOI · Paper page
  13. 10.1523/jneurosci.2610‐10.2011 · DOI · Paper page
  14. 10.1126/SCIENCE.1194653 · DOI · Paper page
  15. 10.1016/0896‐6273(89)90210‐9 · DOI · Paper page
  16. 10.1021/bi00158a027 · DOI
  17. 10.1093/HMG/DDS238 · DOI · Paper page
  18. 10.1016/J.IJDEVNEU.2009.06.001 · DOI
  19. 10.1002/hipo.20255 · DOI
  20. 10.1371/journal.pone.0084849 · DOI
  21. 10.1074/jbc.M117.784702 · DOI
  22. 10.3389/fnins.2021.643115 · DOI
  23. 10.4103/1673‐5374.389644 · DOI
  24. 10.1007/S00415‐024‐12314‐3 · DOI · Paper page
  25. 10.1038/nmeth.2840 · DOI
  26. 10.1007/978‐1‐0716‐3629‐9_31/FIGURES/2 · DOI
  27. 10.3390/ijms22042034 · DOI
  28. 10.1007/978-1-0716-3629-9_31 · DOI
  29. 10.1016/J.STEM.2018.05.020 · DOI
  30. 10.1038/s41592‐019‐0638‐x · DOI
  31. 10.1038/NMETH.3901 · DOI · Paper page
  32. 10.1007/978‐1‐4939‐6598‐4_20 · DOI
  33. 10.1007/978-1-0716-3629-9_29 · DOI
  34. 10.1002/CYTO.A.20022 · DOI
  35. 10.1371/JOURNAL.PONE.0033093 · DOI · Paper page
  36. 10.1128/JVI.72.11.8463‐8471.1998 · DOI · Paper page
  37. 10.1038/s41467‐021‐24900‐4 · DOI
  38. 10.1038/nbt.3519 · DOI · Paper page
  39. 10.12688/f1000research.7563.2 · DOI · Paper page
  40. 10.1186/S13059‐014‐0550‐8/FIGURES/9 · DOI
  41. 10.1101/060012 · DOI
  42. 10.1158/1541‐7786.MCR‐16‐0459/14585/AM/THE‐LANDSCAPE‐OF‐ISOFORM‐SWITCHES‐IN‐HUMAN · DOI
  43. 10.1073/PNAS.1307202110/SUPPL_FILE/SD01.PDF · DOI
  44. 10.1093/NAR/GKX428 · DOI
  45. 10.1093/NAR/GKR1065 · DOI · Paper page
  46. 10.1038/s41587‐019‐0036‐z · DOI
  47. 10.1002/PROT.25674 · DOI · Paper page
  48. 10.1016/J.NEUROSCIENCE.2021.01.041 · DOI
  49. 10.1038/nmeth.2890 · DOI · Paper page
  50. 10.1080/15548627.2018.1509607 · DOI
  51. 10.1016/j.cell.2010.06.036 · DOI · Paper page
  52. 10.1126/SCIENCE.AAI8764/SUPPL_FILE/MOVIES_S5‐S10.ZIP · DOI
  53. 10.1016/J.NEULET.2021.135656 · DOI
  54. 10.1038/s41380‐024‐02463‐2 · DOI
  55. 10.1002/j.1460‐2075.1989.tb03390.x · DOI · Paper page
  56. 10.1101/2024.06.28.601286 · DOI
  57. 10.1038/emboj.2011.376 · DOI
  58. 10.1016/J.CELL.2021.12.041/ATTACHMENT/418D38D8‐6F98‐4567‐AE33‐02B961DF13F7/MMC6.XLSX · DOI
  59. 10.1074/JBC.M115.641902 · DOI
  60. 10.1016/J.BBAMCR.2018.07.018 · DOI
  61. 10.1016/J.NEUROBIOLAGING.2014.10.020 · DOI
  62. 10.3389/FNSYN.2023.1129036/BIBTEX · DOI
  63. 10.3389/FCELL.2022.969547/BIBTEX · DOI
  64. 10.1016/J.ARR.2021.101417 · DOI
  65. 10.1117/1.NPH.7.1.011402 · DOI
  66. 10.1016/J.TINS.2014.08.004 · DOI · Paper page

Cited by

See all 26

Metadata

Authors
Buchholz, S., Kabbani, M. A. A., Bell‐Simons, M., Kluge, L., Cagmak, C., Klimek, J., Haag, N., Iohan, L. C., Coulon, A., Costa, M. R., Kilinc, D., & Zempel, H.
Venue
Alzheimer's & Dementia
Publisher
Wiley
Published
2025-02-28
Volume
21
Issue
5
ISSN
  • 1552-5260
  • 1552-5279
Cited by
26
References
16
Language
en
Funders
  • Jürgen Manchot Stiftung
  • Else Kröner-Fresenius-Stiftung
  • Deutsche Forschungsgemeinschaft
  • Studienstiftung des Deutschen Volkes

About these checks

Registry, retraction, Cites and statistics results are computed, not judged, with one exception: a printed reference that no index lists is read once by a model before it counts as a citation error. Claims are extracted by a model and kept only when their quote appears verbatim in the text; each cited source is then checked, with a model’s help, for whether it says what the claim relies on. Those verdicts can be wrong — read the claim’s quote and the cited source before relying on one.

Statistics and arithmetic are recomputed, not judged.

Confidence bands are shown only for fields calibrated on our annotated test set. None is calibrated yet, so no band is shown.

What counts as a claim ›How we measure confidence ›How we check this ›

Are you an author, or do you see a problem with this page? Request a review

How to cite

Cite CoChat for the checks on this page, and the paper for its own findings.

This page
CoChat. (2026). Citation check: The tau isoform 1N4R confers vulnerability of MAPT knockout human iPSC‐derived neurons to amyloid beta and phosphorylated tau‐induced neuronal dysfunction. https://app.cochat.ai/papers/10.1002/alz.14403
The paper
Buchholz, S., Kabbani, M. A. A., Bell‐Simons, M., Kluge, L., Cagmak, C., Klimek, J., Haag, N., Iohan, L. C., Coulon, A., Costa, M. R., Kilinc, D., & Zempel, H. (2025). The tau isoform 1N4R confers vulnerability of MAPT knockout human iPSC‐derived neurons to amyloid beta and phosphorylated tau‐induced neuronal dysfunction. Alzheimer's & Dementia. https://doi.org/10.1002/alz.14403

Data sources

Bibliographic data: Semantic Scholar, OpenAlex, Crossref.

Contains information from the Semantic Scholar Academic Graph Datasets, made available under the ODC Attribution License (ODC-BY 1.0).

Semantic Scholar’s data is described in: Kinney, R., et al. (2023). The Semantic Scholar Open Data Platform. arXiv:2301.10140.