

The DOI matches its Crossref record; 34 of the 34 references it cites were found in a registry or an index.
Effective treatment of mitochondrial myopathy by nicotinamide riboside, a vitamin B3
Open accessAbstract
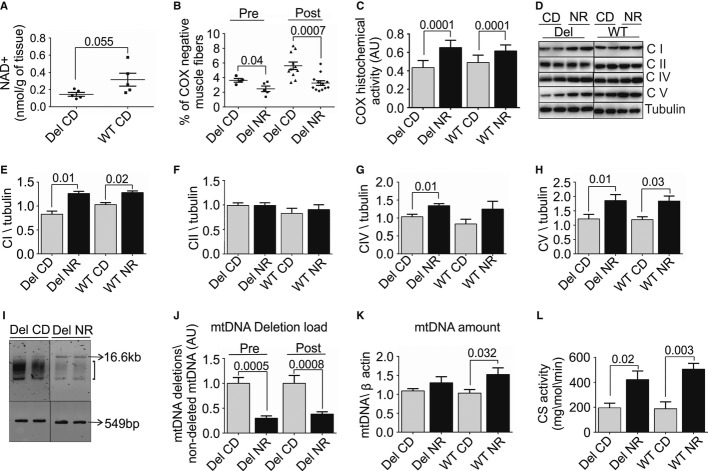
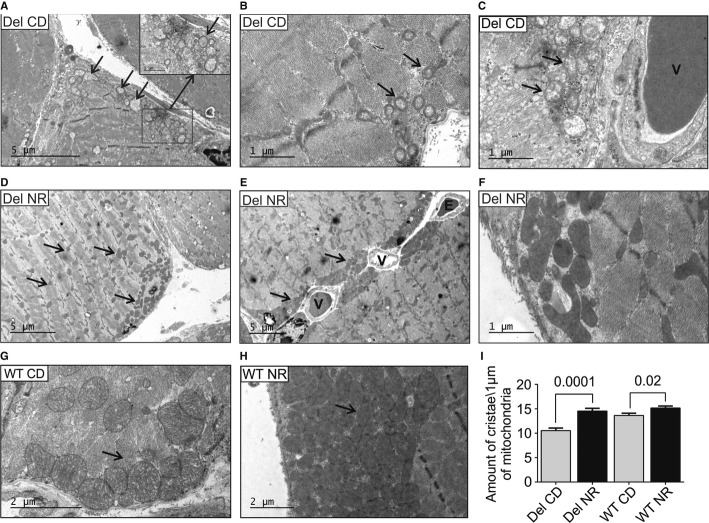
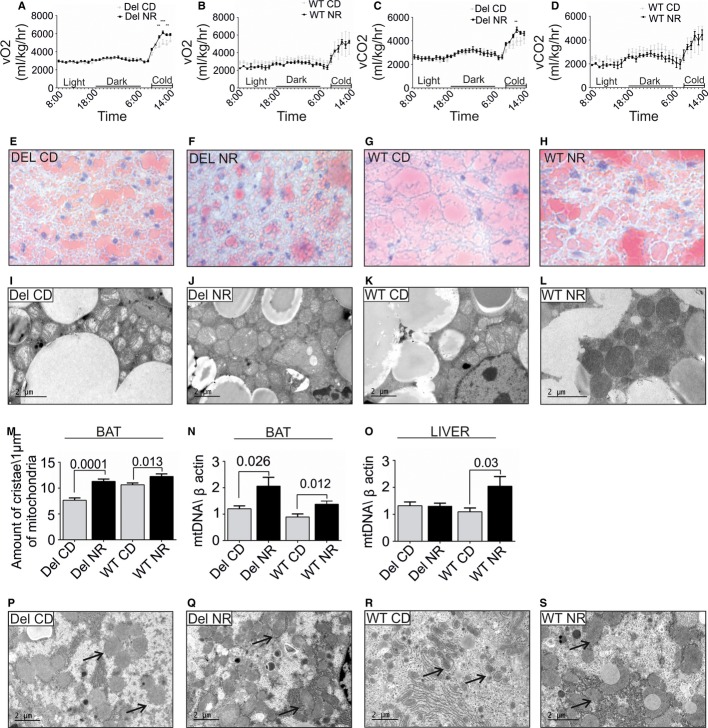
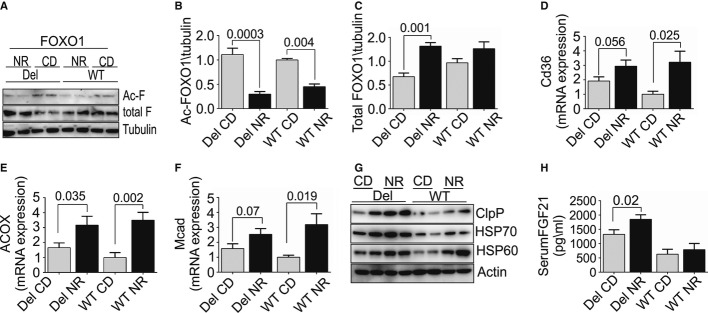
Nutrient availability is the major regulator of life and reproduction, and a complex cellular signaling network has evolved to adapt organisms to fasting. These sensor pathways monitor cellular energy metabolism, especially mitochondrial ATP production and NAD + /NADH ratio, as major signals for nutritional state. We hypothesized that these signals would be modified by mitochondrial respiratory chain disease, because of inefficient NADH utilization and ATP production. Oral administration of nicotinamide riboside (NR), a vitamin B3 and NAD + precursor, was previously shown to boost NAD + levels in mice and to induce mitochondrial biogenesis. Here, we treated mitochondrial myopathy mice with NR. This vitamin effectively delayed early‐ and late‐stage disease progression, by robustly inducing mitochondrial biogenesis in skeletal muscle and brown adipose tissue, preventing mitochondrial ultrastructure abnormalities and mtDNA deletion formation. NR further stimulated mitochondrial unfolded protein response, suggesting its protective role in mitochondrial disease. These results indicate that NR and strategies boosting NAD + levels are a promising treatment strategy for mitochondrial myopathy.
Overview
The claims and statistics of this paper haven’t been checked yet.
Run the check — free, no account needed. It reads the open-access text and checks the sources it cites.
Integrity signals
Registry
Cites
Statistics
Figures
Verification
Claims the paper makes
The claims and statistics of this paper haven’t been checked yet.
Run the check — free, no account needed. It reads the open-access text and checks the sources it cites.
Claims other papers make about this one
Each is checked against this paper’s own text: does it say what the citing paper says it does?
In the citing paper
“new therapeutic strategies have emerged to restore NAD+ levels in muscle by administration of dietary NAD+ precursors such as NR or NMN46,53,54”
From Mitochondrial oxidative capacity and NAD+ biosynthesis are reduced in human sarcopenia across ethnicities (2019) · cites this paper as [54]
In the citing paper
“the conversion of these precursors to NAD+ bypasses the rate limited enzyme NAMPT”
From Mitochondrial oxidative capacity and NAD+ biosynthesis are reduced in human sarcopenia across ethnicities (2019) · cites this paper as [54]
Self-check
Percentages, sums and reported differences re-computed from the paper’s own numbers.
The self-check needs the paper’s full text.
Citations
Cites
1 retracted
Wenz, T., Diaz, F., Spiegelman, B. M., & Moraes, C. T. (2008) · Cell Metabolism · doi:10.1016/j.cmet.2008.07.006 · Cited by 297
RetractedTranscriptional silencing and longevity protein Sir2 is an NAD-dependent histone deacetylase
Imai, S.-I., Armstrong, C. M., Kaeberlein, M., & Guarente, L. (2000) · Nature · doi:10.1038/35001622 · Cited by 3,510
Mitochondria: In Sickness and in Health
Nunnari, J., & Suomalainen, A. (2012) · Cell · doi:10.1016/j.cell.2012.02.035 · Cited by 3,479
Self-citationAMPK regulates energy expenditure by modulating NAD+ metabolism and SIRT1 activity
Cantó, C., Gerhart-Hines, Z., Feige, J. N., Lagouge, M., Noriega, L., Milne, J. C., Elliott, P. J., Puigserver, P., & Auwerx, J. (2009) · Nature · doi:10.1038/nature07813 · Cited by 3,300
Self-citationStress-dependent regulation of FOXO transcription factors by the SIRT1 deacetylase
Brunet, A., Sweeney, L. B., Sturgill, J. F., Chua, K. F., Greer, P. L., Lin, Y., Tran, H., Ross, S. E., Mostoslavsky, R., Cohen, H. Y., et al. (2004) · Science · doi:10.1126/science.1094637 · Cited by 3,239
Nutrient control of glucose homeostasis through a complex of PGC-1α and SIRT1
Rodgers, J. T., Lerin, C., Haas, W., Gygi, S. P., Spiegelman, B. M., & Puigserver, P. (2005) · Nature · doi:10.1038/nature03354 · Cited by 3,160
FGF-21 as a novel metabolic regulator
Kharitonenkov, A., Shiyanova, T. L., Koester, A., Ford, A. M., Micanovic, R., Galbreath, E. J., Sandusky, G. E., Hammond, L. J., Moyers, J. S., Owens, R. A., et al. (2005) · Journal of Clinical Investigation · doi:10.1172/jci23606 · Cited by 2,125
Gomes, A. P., Price, N. L., Ling, A. J. Y., Moslehi, J. J., Montgomery, M. K., Rajman, L., White, J. P., Teodoro, J. S., Wrann, C. D., Hubbard, B. P., et al. (2013) · Cell · doi:10.1016/j.cell.2013.11.037 · Cited by 1,482
Cantó, C., Houtkooper, R. H., Pirinen, E., Youn, D. Y., Oosterveer, M. H., Cen, Y., Fernandez-Marcos, P. J., Yamamoto, H., Andreux, P. A., Cettour-Rose, P., et al. (2012) · Cell Metabolism · doi:10.1016/j.cmet.2012.04.022 · Cited by 1,238
Self-citationMouchiroud, L., Houtkooper, R. H., Moullan, N., Katsyuba, E., Ryu, D., Cantó, C., Mottis, A., Jo, Y.-S., Viswanathan, M., Schoonjans, K., et al. (2013) · Cell · doi:10.1016/j.cell.2013.06.016 · Cited by 1,210
Self-citationThe Cell Non-Autonomous Nature of Electron Transport Chain-Mediated Longevity
Durieux, J., Wolff, S., & Dillin, A. (2011) · Cell · doi:10.1016/j.cell.2010.12.016 · Cited by 1,059 · cited 4×
“These results demonstrate that NR induced mitochondrial biogenesis and oxidative ATP production capacity robustly and significantly delayed the progression of MM, irrespective of the disease stage.”
InfluentialMitonuclear protein imbalance as a conserved longevity mechanism
Houtkooper, R. H., Mouchiroud, L., Ryu, D., Moullan, N., Katsyuba, E., Knott, G., Williams, R. W., & Auwerx, J. (2013) · Nature · doi:10.1038/nature12188 · Cited by 1,035
Self-citationMitochondrial Import Efficiency of ATFS-1 Regulates Mitochondrial UPR Activation
Nargund, A. M., Pellegrino, M., Fiorese, C. J., Baker, B. M., & Haynes, C. M. (2012) · Science · doi:10.1126/science.1223560 · Cited by 1,027
The secret life of NAD+: an old metabolite controlling new metabolic signaling pathways
Houtkooper, R. H., Cantó, C., Wanders, R. J., & Auwerx, J. (2010) · Endocrine Reviews · doi:10.1210/er.2009-0026 · Cited by 899
Self-citationBieganowski, P., & Brenner, C. (2004) · Cell · doi:10.1016/s0092-8674(04)00416-7 · Cited by 750
Trounce, I. A., Kim, Y. L., Jun, A. S., & Wallace, D. C. (1996) · Methods in enzymology on CD-ROM/Methods in enzymology · doi:10.1016/s0076-6879(96)64044-0 · Cited by 749
Zeviani, M., Servidei, S., Gellera, C., Bertini, E., DiMauro, S., & DiDonato, S. (1989) · Nature · doi:10.1038/339309a0 · Cited by 636
ClpP Mediates Activation of a Mitochondrial Unfolded Protein Response in C. elegans
Haynes, C. M., Petrova, K., Benedetti, C., Yang, Y., & Ron, D. (2007) · Developmental Cell · doi:10.1016/j.devcel.2007.07.016 · Cited by 595
St‐Pierre, J., Lin, J. D., Krauss, S., Tarr, P. T., Yang, R., Newgard, C. B., & Spiegelman, B. M. (2003) · Journal of Biological Chemistry · doi:10.1074/jbc.m301850200 · Cited by 554
mTOR Inhibition Alleviates Mitochondrial Disease in a Mouse Model of Leigh Syndrome
Johnson, S. C., Yanos, M. E., Kayser, E.-B., Quintana, A., Sangesland, M., Castanza, A., Uhde, L., Hui, J., Wall, V. Z., Gagnidze, A., et al. (2013) · Science · doi:10.1126/science.1244360 · Cited by 512
Suomalainen, A., Elo, J. M., Pietiläinen, K. H., Hakonen, A. H., Sevastianova, K., Korpela, M., Isohanni, P., Marjavaara, S. K., Tyni, T., Kiuru-Enari, S., et al. (2011) · The Lancet Neurology · doi:10.1016/s1474-4422(11)70155-7 · Cited by 427
Self-citationTyynismaa, H., Mjosund, K. P., Wanrooij, S., Lappalainen, I., Ylikallio, E., Jalanko, A., Spelbrink, J. N., Paetau, A., & Suomalainen, A. (2005) · Proceedings of the National Academy of Sciences · doi:10.1073/pnas.0505551102 · Cited by 342
Self-citationIn Vivo Correction of COX Deficiency by Activation of the AMPK/PGC-1α Axis
Viscomi, C. F., Bottani, E., Civiletto, G., Cerutti, R., Moggio, M. G., Fagiolari, G., Schon, E. A., Lamperti, C., & Zeviani, M. (2011) · Cell Metabolism · doi:10.1016/j.cmet.2011.04.011 · Cited by 302
Mitochondrial myopathy induces a starvation-like response
Tyynismaa, H., Carroll, C. J., Raimundo, N., Ahola-Erkkilä, S., Wenz, T., Ruhanen, H., Guse, K., Hemminki, A., Peltola-Mjøsund, K. E., Tulkki, V., et al. (2010) · Human Molecular Genetics · doi:10.1093/hmg/ddq310 · Cited by 300
Self-citationSuomalainen, A., Majander, A. S., Haltia, M., Somer, H., Lönnqvist, J. K., Savontaus, M. L., & Peltonen, L. (1992) · Journal of Clinical Investigation · doi:10.1172/jci115856 · Cited by 242
Self-citationHaynes, C. M., Fiorese, C. J., & Lin, Y. (2013) · Trends in Cell Biology · doi:10.1016/j.tcb.2013.02.002 · Cited by 213
Mechanisms of mitochondrial diseases
Ylikallio, E., & Suomalainen, A. (2011) · Annals of Medicine · doi:10.3109/07853890.2011.598547 · Cited by 197
Self-citationKetogenic diet slows down mitochondrial myopathy progression in mice
Ahola, S., Carroll, C. J., Mjøsund, K., Tulkki, V., Mattila, I. M., Seppänen‐Laakso, T., Orešič, M., Tyynismaa, H., & Suomalainen, A. (2010) · Human Molecular Genetics · doi:10.1093/hmg/ddq076 · Cited by 191
Self-citationAutosomal dominant progressive external ophthalmoplegia with multiple deletions of mtDNA
Suomalainen, A., Majander, A. S., Wallin, M., Setälä, K., KONTULA, K. K., Leinonen, H., Salmi, T. T., Paetau, A. E., Haltia, M., Valanne, L. K., et al. (1997) · Neurology · doi:10.1212/wnl.48.5.1244 · Cited by 140
Self-citationEffect of bezafibrate treatment on late-onset mitochondrial myopathy in mice
Yatsuga, S., & Suomalainen, A. (2011) · Human Molecular Genetics · doi:10.1093/hmg/ddr482 · Cited by 133
Self-citationYang, T., Chan, N. Y., & Sauve, A. A. (2007) · Journal of Medicinal Chemistry · doi:10.1021/jm701001c · Cited by 115
Multiple Symmetrical Lipomatosis — A mitochondrial disorder of brown fat
Plummer, C., Spring, P. J., Marotta, R., Chin, J., Taylor, G., Sharpe, D., Athanasou, N. A., Thyagarajan, D. E., & Berkovic, S. F. (2013) · Mitochondrion · doi:10.1016/j.mito.2013.03.003 · Cited by 80
Therapy for mitochondrial disorders: Little proof, high research activity, some promise
Suomalainen, A. (2011) · Seminars in Fetal and Neonatal Medicine · doi:10.1016/j.siny.2011.05.003 · Cited by 47
Self-citationBrown adipose tissue functions in humans
Virtanen, K. A., Lichtenbelt, W. D. V. M., & Nuutila, P. (2012) · Biochimica et Biophysica Acta (BBA) - Molecular and Cell Biology of Lipids · doi:10.1016/j.bbalip.2012.12.011 · Cited by 31
Cited by
Sorted by citations
Mitophagy and Quality Control Mechanisms in Mitochondrial Maintenance
Pickles, S., Vigié, P., & Youle, R. J. (2018) · Current Biology · doi:10.1016/j.cub.2018.01.004 · Cited by 2,081
Sarcopenia: Aging-Related Loss of Muscle Mass and Function
Larsson, L., Degens, H., Li, M., Salviati, L., Lee, Y. I., Thompson, W., Kirkland, J. L., & Sandri, M. (2019) · Physiological Reviews · doi:10.1152/physrev.00061.2017 · Cited by 1,797
Cantó, C., Menzies, K. J., & Auwerx, J. (2015) · Cell Metabolism · doi:10.1016/j.cmet.2015.05.023 · Cited by 1,648
Self-citationGorman, G. S., Chinnery, P. F., DiMauro, S., Hirano, M., Koga, Y., McFarland, R., Suomalainen, A., Thorburn, D. R., Zeviani, M., & Turnbull, D. M. (2016) · Nature Reviews Disease Primers · doi:10.1038/nrdp.2016.80 · Cited by 1,650
Self-citationNAD + in aging, metabolism, and neurodegeneration
Verdin, E. (2015) · Science · doi:10.1126/science.aac4854 · Cited by 1,319
Metadata
- Authors
- Khan, N. A., Auranen, M., Paetau, I., Pirinen, E., Euro, L., Forsström, S., Pasila, L., Velagapudi, V., Carroll, C. J., Auwerx, J., & Suomalainen, A.
- Affiliations
- University of Helsinki (FI)
- University of Eastern Finland (FI)
- Institute for Molecular Medicine Finland (FI)
- École Polytechnique Fédérale de Lausanne (CH)
- Corresponding author
- Suomalainen, Anu
- ORCID
- Venue
- EMBO Molecular Medicine
- Published
- 2014-04-07
- Volume
- 6
- Issue
- 6
- Pages
- 721-731
- ISSN
- 1757-4676 (ISSN-L)
- 1757-4684
- PMC
- PMC4203351
- OpenAlex
- W2132438126
- Cited by
- 385
- References
- 34
- Citations by year
- 2026: 15 · 2025: 25 · 2024: 19 · 2023: 32 · 2022: 29 · 2021: 36 · 2020: 45 · 2019: 37 · 2018: 39 · 2017: 31 · 2016: 30 · 2015: 34 · 2014: 12
- FWCI
- 18.17
- Type
- journal article
- Language
- en
- Open access
- gold
- doi.org
- Locations
- EMBO Molecular Medicine (publishedVersion, other-oa)
- Europe PMC (PubMed Central) (publishedVersion, cc-by)
- PubMed Central (publishedVersion, cc-by)
- PubMed (publishedVersion)
- St George's Online Research Archive (St George's University of London) (acceptedVersion, other-oa)
- DOAJ (DOAJ: Directory of Open Access Journals) (submittedVersion)
- Työväentutkimus Vuosikirja (submittedVersion)
- Infoscience (Ecole Polytechnique Fédérale de Lausanne) (submittedVersion)
- Infoscience (Ecole Polytechnique Fédérale de Lausanne) (submittedVersion, cc-by-nc-nd)
- Funders
- European Research Council
- Saastamoinen Foundation
- Finnish Cultural Foundation
- Finnish Diabetes Foundation
- Finnish Academy
- Jane and Aatos Erkko Foundation
- Sigrid Jusélius Foundation
- Academy of Finland, and University of Helsinki
- Ecole Polytechnique Fédérale de Lausanne
- ERC
- NIH (R01HL106511‐01A, R01AG043930)
- Velux Stiftung
- Swiss National Science Foundation
- Topics
- Health Sciences › Medicine › Geriatrics and Gerontology › Sirtuins and Resveratrol in Medicine
- Life Sciences › Biochemistry, Genetics and Molecular Biology › Molecular Biology › Mitochondrial Function and Pathology
- Health Sciences › Medicine › Physiology (medical) › Adipose Tissue and Metabolism
- Keywords
- nicotinamide riboside, mitochondrial myopathy, NAD+ precursors, NAD+/NADH ratio, mitochondrial biogenesis, mitochondrial unfolded protein response, mitochondrial DNA deletions, skeletal muscle, brown adipose tissue, mitochondrial ATP production, disease progression
- MeSH terms
- Forkhead Box Protein O1, Animals, Adipose Tissue, Brown, Energy Metabolism, Liver, Male, Mice, Inbred C57BL, Mitochondria, NAD, Niacinamide, Pyridinium Compounds, Vitamin B Complex, Mitochondrial Myopathies, Muscle, Skeletal, Lipid Metabolism, Mice, Forkhead Transcription Factors, Sirtuin 1, Unfolded Protein Response
About these checks
Registry, retraction, Cites and statistics results are computed, not judged, with one exception: a printed reference that no index lists is read once by a model before it counts as a citation error. Claims are extracted by a model and kept only when their quote appears verbatim in the text; each cited source is then checked, with a model’s help, for whether it says what the claim relies on. Those verdicts can be wrong — read the claim’s quote and the cited source before relying on one.
Statistics and arithmetic are recomputed, not judged.
Confidence bands are shown only for fields calibrated on our annotated test set. None is calibrated yet, so no band is shown.
What counts as a claim ›How we measure confidence ›How we check this ›
Are you an author, or do you see a problem with this page? Request a review
