Cited by 300

The DOI matches its Crossref record; 9 of the 9 references it cites were found in a registry or an index.

Recent progress of magnetic nanoparticles in biomedical applications: A review

Anik, Muzahidul I., Hossain, M. Khalid, Hossain, Imran, Mahfuz, A. M. U. B., Rahman, M. Tayebur, Ahmed, Isteaque·2021·Nano Select

Abstract

Magnetic nanoparticles (MNPs) offer tremendous potentialities in biomedical applications for a long while. Since these materials' interactions in biological media largely rely on their crystal structures, sizes, and shapes, detailed studies on their synthesis mechanism for medicinal aspects are crucial. Despite many review reports that have already been published on MNPs, they mainly have focused either on their perspective in biomedical applications or their synthesis and characterization along with functionalization mechanisms as individual entities. For this reason, this review uncovers a comprehensive insight into the ongoing improvement of fabrication processes, surface functionalization of MNPs for biomedical applications together. Besides, various magnetic nanocomposite (MNCs) for smart drug delivery, recent hyperthermia treatment, lab‐on‐a‐chip, and magnetic bio‐separation, and some of the recent emerging imaging techniques using MNPs are discussed. A detailed analysis of toxicity, challenges, and recent progress of clinical trials of MNPs is sketched out to open numerous entryways for advanced research on MNPs for biomedical applications.

Overview

The claims and statistics of this paper haven’t been checked yet.

Run the check — free, no account needed. It reads the open-access text and checks the sources it cites.

A few free checks a day · papers already verified open instantly · results are public

Integrity signals

Registry

Crossref · 10.1002/nano.202000162

Cites

9 of 9 references verified0 citation errors · 0 not checkable

Statistics

Figures

Image 1
CC-BY · From the PDF
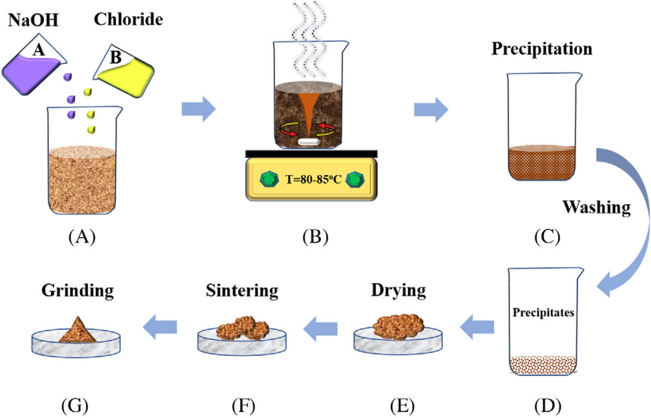
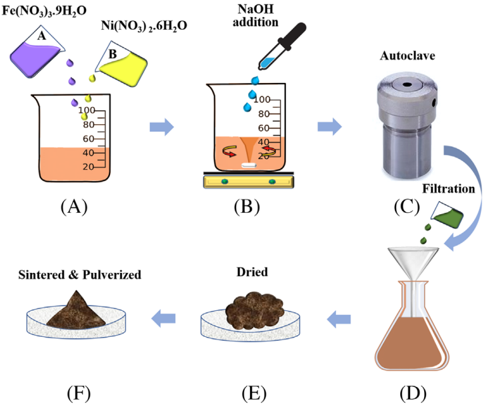
FIGURE 2 Illustration of (NiFe2O4/Fe2O3)nanocompositesynthesis via hydrothermal method: (A) addition of Fe(NO 3 ) 3 ⋅ 9H2O and Ni(NO3)2 ⋅ 6H2O precursors, (B) magnetic stirring during the addition of NaOH(1 M) until to pH 12, (C) autoclave the mixture for 20 hours at 180°C, (D) filtration, (E) drying at 100°C, and (F) annealed in the air for 2 hours at 400-800°C and pulverized to get the final product
FIGURE 2 Illustration of (NiFe2O4/Fe2O3)nanocompositesynthesis via hydrothermal method: (A) addition of Fe(NO 3 ) 3 ⋅ 9H2O and Ni(NO3)2 ⋅ 6H2O precursors, (B) magnetic stirring during the addition of NaOH(1 M) until to pH 12, (C) autoclave the mixture for 20 hours at 180°C, (D) filtration, (E) drying at 100°C, and (F) annealed in the air for 2 hours at 400-800°C and pulverized to get the final productCC-BY · From the PDF
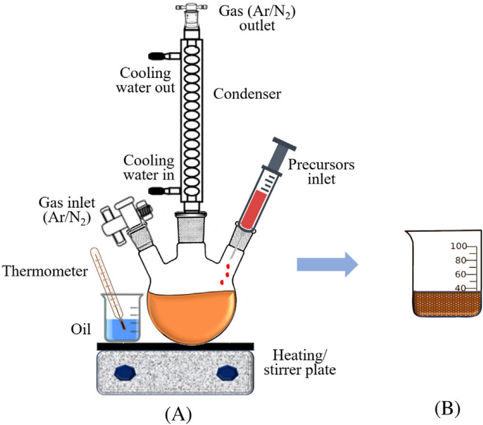
FIGURE 3 A) Experimental setup for nanoparticle synthesis following the thermal decomposition method. B) In this method, iron pentacarbonyl Fe(CO)5 was added to octyl ether, and oleic acid mixture at 100 ◦ C then refluxed for 1 hour. Dehydrated (CH3 )3 NO was added to the solution at room temperature and then again heated to 130 ◦ Cunder an argon atmosphere for 2 hours. After the formation of a brown-colored solution, the temperature was increased slowly and refluxed for more than 1 hour. Ethanol was added to the mixture at room temperature to produce a black precipitate of γ -Fe2 O3 nanoparticles and then separated by centrifuging [60]
FIGURE 3 A) Experimental setup for nanoparticle synthesis following the thermal decomposition method. B) In this method, iron pentacarbonyl Fe(CO)5 was added to octyl ether, and oleic acid mixture at 100 ◦ C then refluxed for 1 hour. Dehydrated (CH3 )3 NO was added to the solution at room temperature and then again heated to 130 ◦ Cunder an argon atmosphere for 2 hours. After the formation of a brown-colored solution, the temperature was increased slowly and refluxed for more than 1 hour. Ethanol was added to the mixture at room temperature to produce a black precipitate of γ -Fe2 O3 nanoparticles and then separated by centrifuging [60]CC-BY · From the PDF
Image 4
CC-BY · From the PDF
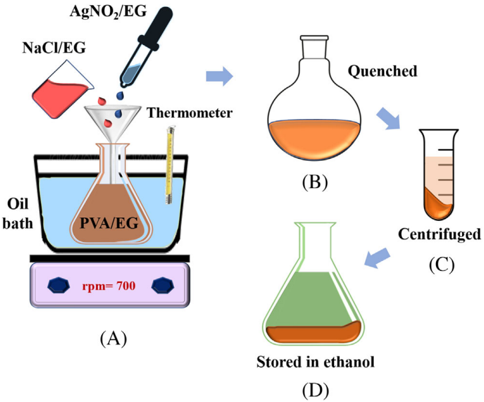
FIGURE 4 Steps to the synthesis of silver nanorods following polyol method: (A) NaCl/EG and AgNo3/EG are added to PVA/EG solution and stirred at 700 rmp using magnetic starrier, (B) quince at room temperature, (C) centrifuged at 6000 rpm, and (D) stored in ethanol
FIGURE 4 Steps to the synthesis of silver nanorods following polyol method: (A) NaCl/EG and AgNo3/EG are added to PVA/EG solution and stirred at 700 rmp using magnetic starrier, (B) quince at room temperature, (C) centrifuged at 6000 rpm, and (D) stored in ethanolCC-BY · From the PDF
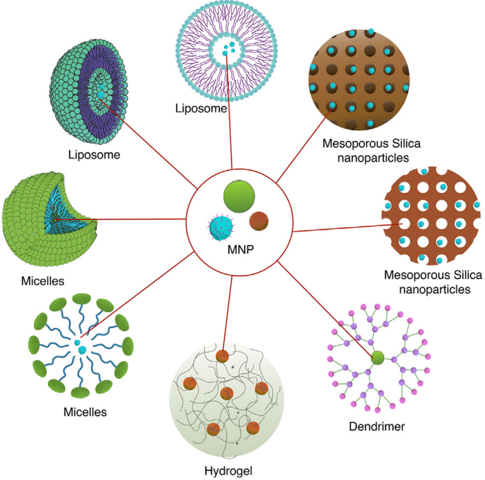
FIGURE 5 Different nanocomposite containing magnetic nanoparticles. The high surface area of the nanoparticles loaded inside the nanocarriers makes them excellent choices for drug and gene delivery module
FIGURE 5 Different nanocomposite containing magnetic nanoparticles. The high surface area of the nanoparticles loaded inside the nanocarriers makes them excellent choices for drug and gene delivery moduleCC-BY · From the PDF
Image 7
CC-BY · From the PDF
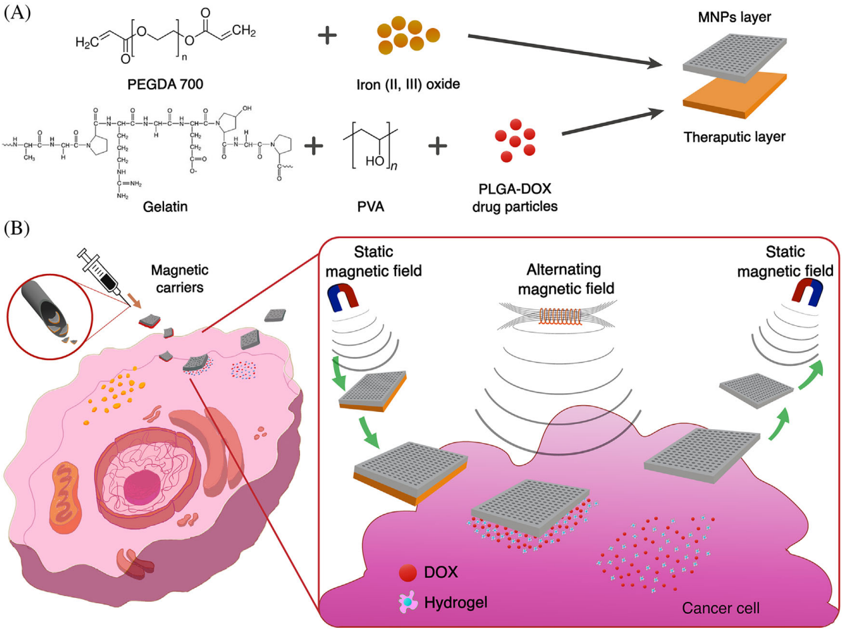
FIGURE 6 A, Structure of bilayer magnetic drug delivery vehicle. The delivery vehicle is composed of two layers with MNP layer and a therapeutic layer that contains DOX. B, The bilayer magnetic vehicles can be locally injected to the tumor site, which will then be delivered to the desired cancerous cell by a static magnetic field. Upon reaching the desired site the bilayer delivery vehicle will be exposed to an alternating magnetic field (AMF) which will facilitate an increase in temperature in the cellular microenvironment and the release of the therapeutic layer. The remaining magnetic layer will be retrieved using a static magnetic field. Recreated with permission from ref [140]
FIGURE 6 A, Structure of bilayer magnetic drug delivery vehicle. The delivery vehicle is composed of two layers with MNP layer and a therapeutic layer that contains DOX. B, The bilayer magnetic vehicles can be locally injected to the tumor site, which will then be delivered to the desired cancerous cell by a static magnetic field. Upon reaching the desired site the bilayer delivery vehicle will be exposed to an alternating magnetic field (AMF) which will facilitate an increase in temperature in the cellular microenvironment and the release of the therapeutic layer. The remaining magnetic layer will be retrieved using a static magnetic field. Recreated with permission from ref [140]CC-BY · From the PDF
Image 9
CC-BY · From the PDF
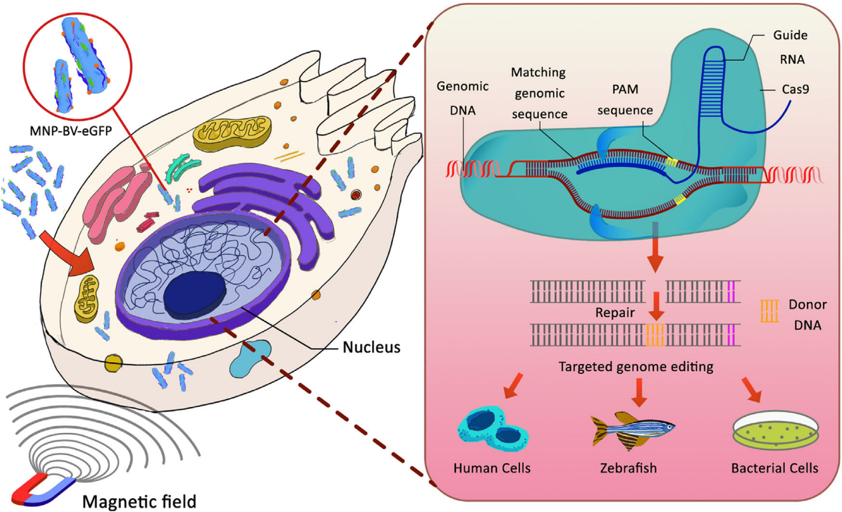
FIGURE 7 Magnetofection assisted CRISPR-Cas9 gene editing. Magnetic particles and enhanced green fluorescent protein-loaded baculoviral vector (MNP-BV-eGFP) used for high magnetofection efficacy under the influence of a static magnetic field. Protospacer adjacent motif (PAM) sequence assisted DNA cleavage, followed by donor DNA docking to repair cleaved DNA which essentially leads to successful DNAediting
FIGURE 7 Magnetofection assisted CRISPR-Cas9 gene editing. Magnetic particles and enhanced green fluorescent protein-loaded baculoviral vector (MNP-BV-eGFP) used for high magnetofection efficacy under the influence of a static magnetic field. Protospacer adjacent motif (PAM) sequence assisted DNA cleavage, followed by donor DNA docking to repair cleaved DNA which essentially leads to successful DNAeditingCC-BY · From the PDF
Image 11
CC-BY · From the PDF
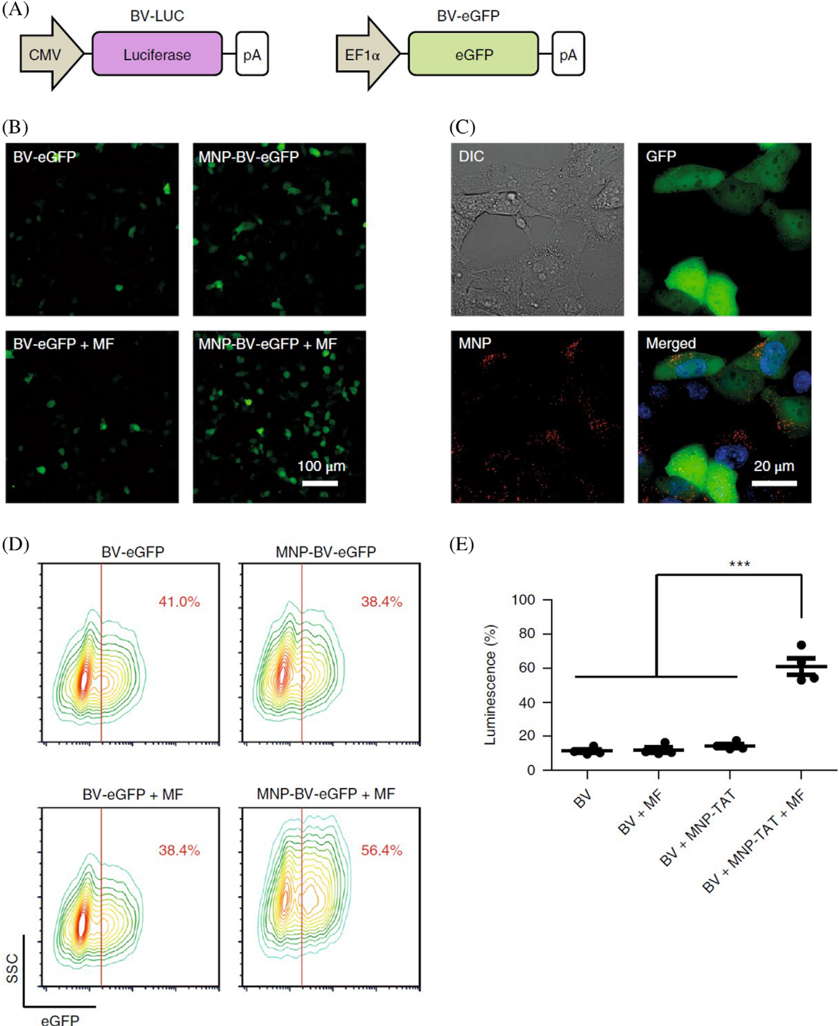
FIGURE 8 A, Baculoviral vector carrying luciferase (BV-LUC) and enhanced green protein fluorescence protein (BV-eGFP). Here cytomegalovirus is denoted as CMV; Elongation factor is denoted as EF1 α and polyadenylation signal is denoted as pA. B) Fluorescence images of baculoviral vector assisted eGFP expression. BV-eGFP and MNP-BV-eGFP were incubated with Hepa 1-6 cells, respectively, for 0.5 hours in the presence and the absence of a magnetic field (MF) directing towards the cell surface. C, Localization of MNPs (red) and eGFP (green) in the cells incubated with MNP-BV-eGFP. Cell nuclei are stained with blue. Differential interference contrast is denoted as DIC. D, Quantification of baculoviral vector-mediated eGFP expression. Side scatter is denoted as SSC. Colored lines represent contour lines of cell density and the red line represents the gating. E, Baculoviral vector-assisted luciferase expression. The BV transgene expression was enhanced by combining attached MNPs and an applied magnetic field, whereas the effect of magnetic particles and magnetic field only was negligible. Reprinted with permission from ref [170]
FIGURE 8 A, Baculoviral vector carrying luciferase (BV-LUC) and enhanced green protein fluorescence protein (BV-eGFP). Here cytomegalovirus is denoted as CMV; Elongation factor is denoted as EF1 α and polyadenylation signal is denoted as pA. B) Fluorescence images of baculoviral vector assisted eGFP expression. BV-eGFP and MNP-BV-eGFP were incubated with Hepa 1-6 cells, respectively, for 0.5 hours in the presence and the absence of a magnetic field (MF) directing towards the cell surface. C, Localization of MNPs (red) and eGFP (green) in the cells incubated with MNP-BV-eGFP. Cell nuclei are stained with blue. Differential interference contrast is denoted as DIC. D, Quantification of baculoviral vector-mediated eGFP expression. Side scatter is denoted as SSC. Colored lines represent contour lines of cell density and the red line represents the gating. E, Baculoviral vector-assisted luciferase expression. The BV transgene expression was enhanced by combining attached MNPs and an applied magnetic field, whereas the effect of magnetic particles and magnetic field only was negligible. Reprinted with permission from ref [170]CC-BY · From the PDF
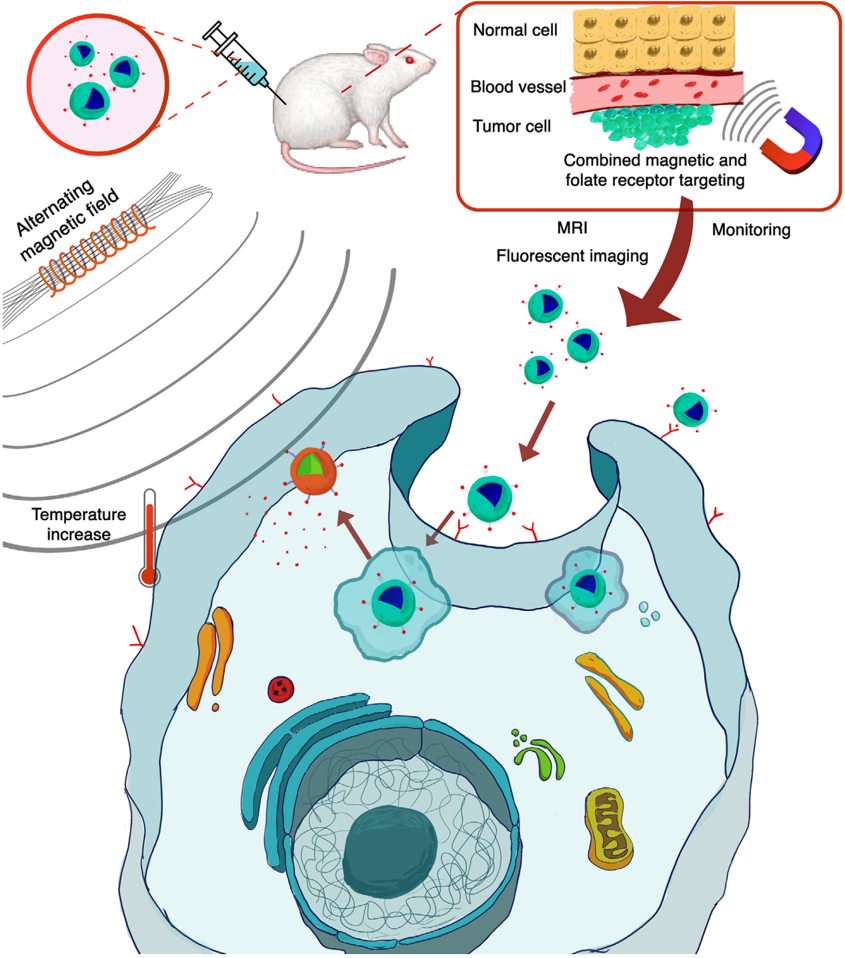
FIGURE 9 Schematic of magnetic synergistic drug delivery and magnetic hyperthermia. The magnetic nanoparticles are accumulated in the tumor site from circulating blood under the influence of a static magnetic field. Upon accumulation to the desired site, alternating magnetic field (AMF) is applied to the magnetic particle accumulated tumor site. The AMF induce Brownian and Néel relaxation which in turn increases the temperature of the tumor microenvironment. The increase in temperature facilitates either apoptosis or necrosis. Temperature responsive ligand release anticancer drugs loaded on the surface of the magnetic particles leading to a synergistic dual treatment
FIGURE 9 Schematic of magnetic synergistic drug delivery and magnetic hyperthermia. The magnetic nanoparticles are accumulated in the tumor site from circulating blood under the influence of a static magnetic field. Upon accumulation to the desired site, alternating magnetic field (AMF) is applied to the magnetic particle accumulated tumor site. The AMF induce Brownian and Néel relaxation which in turn increases the temperature of the tumor microenvironment. The increase in temperature facilitates either apoptosis or necrosis. Temperature responsive ligand release anticancer drugs loaded on the surface of the magnetic particles leading to a synergistic dual treatmentCC-BY · From the PDF
Image 14
CC-BY · From the PDF
Image 15
CC-BY · From the PDF
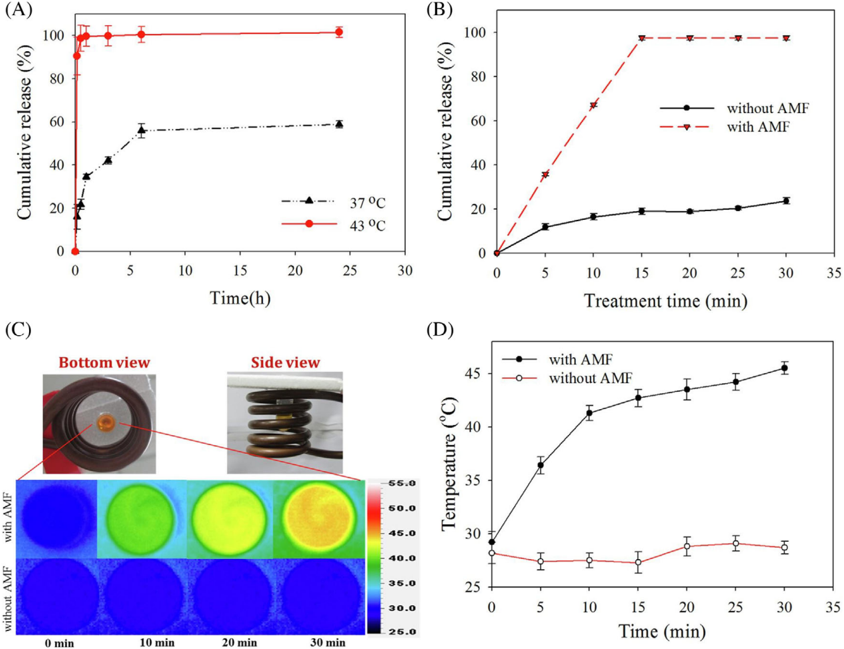
FIGURE 11 Cumulative release profiles of anticancer drug Irinotecan (CPT-11) from thermosensitive magnetic liposome loaded with CPT-11 and Cetuximab (CET) which selectively binds to anti-epidermal growth factor receptor (EGFR) monoclonal antibody expressed by most brain tumors, (TML-CPT-11-CET) in 37 ◦ C and 43 ◦ C water bath (A) in the presence and (B) absence alternating magnetic field (AMF) treatment. C, Experimental setup and heat map at a different time point in the presence and absence of AMF (D) peak temperature profiles with and without the influence of AMF. Reprinted with permission from ref [158]
FIGURE 11 Cumulative release profiles of anticancer drug Irinotecan (CPT-11) from thermosensitive magnetic liposome loaded with CPT-11 and Cetuximab (CET) which selectively binds to anti-epidermal growth factor receptor (EGFR) monoclonal antibody expressed by most brain tumors, (TML-CPT-11-CET) in 37 ◦ C and 43 ◦ C water bath (A) in the presence and (B) absence alternating magnetic field (AMF) treatment. C, Experimental setup and heat map at a different time point in the presence and absence of AMF (D) peak temperature profiles with and without the influence of AMF. Reprinted with permission from ref [158]CC-BY · From the PDF
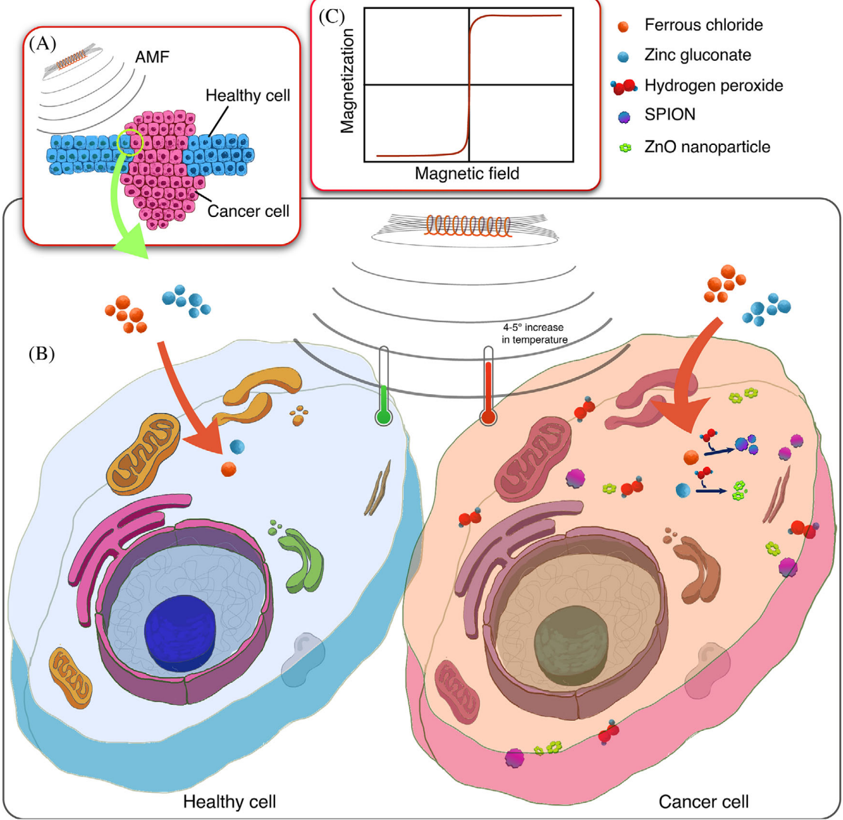
FIGURE 12 Biosynthesis of SPIONs. A, Co-existing of normal healthy cells and cancerous cells. B, Ferrous chloride and Zinc gluconate are introduced to healthy cells and cancerous cells as a precursor of SPIONs and ZnO nanoparticle. The healthy cells do not contain H 2 O 2 , an essential element for the reaction to form SPIONs and ZnO; hence upon exposure to an alternating magnetic field (AMF), there is no change in the cellular temperature. However, cancerous cells contain a high concentration of H 2 O2, which catalyzes the nanoparticle precursors to SPIONs andZnO,resulting an increase of 4-5 ◦ Cinthecellular microenvironment upon exposure to AMF. This selective increase in temperature induces hyperthermia in cancer cells without disturbing the regular functionality of adjacent healthy cells. C, Magnetization curve of SPIONs
FIGURE 12 Biosynthesis of SPIONs. A, Co-existing of normal healthy cells and cancerous cells. B, Ferrous chloride and Zinc gluconate are introduced to healthy cells and cancerous cells as a precursor of SPIONs and ZnO nanoparticle. The healthy cells do not contain H 2 O 2 , an essential element for the reaction to form SPIONs and ZnO; hence upon exposure to an alternating magnetic field (AMF), there is no change in the cellular temperature. However, cancerous cells contain a high concentration of H 2 O2, which catalyzes the nanoparticle precursors to SPIONs andZnO,resulting an increase of 4-5 ◦ Cinthecellular microenvironment upon exposure to AMF. This selective increase in temperature induces hyperthermia in cancer cells without disturbing the regular functionality of adjacent healthy cells. C, Magnetization curve of SPIONsCC-BY · From the PDF
Image 18
CC-BY · From the PDF
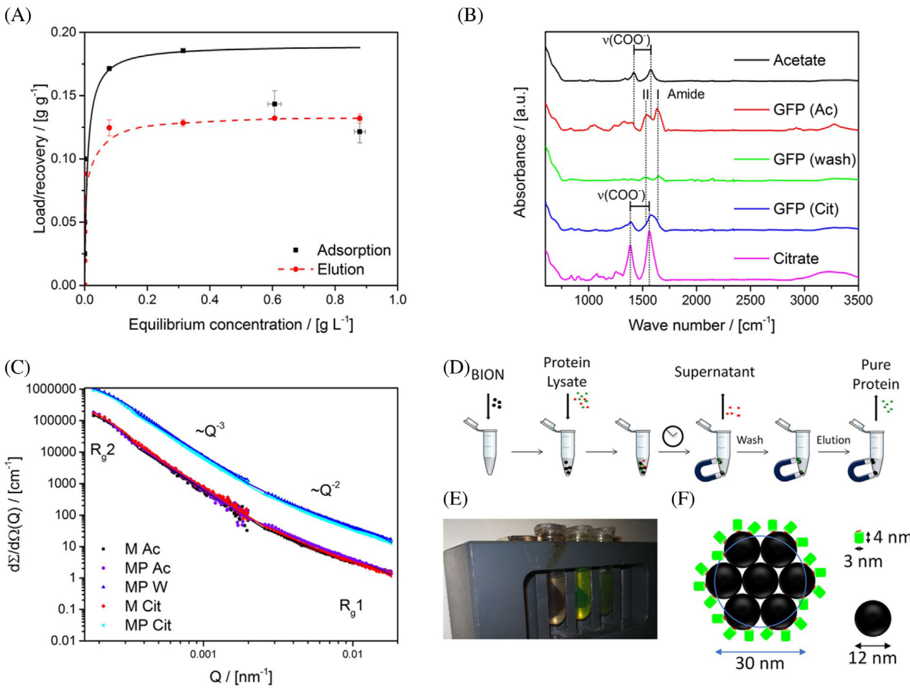
FIGURE 13 Adsorption and recovery isotherm of purified Glu6-GFP on bare iron oxide nanoparticles (BIONs). A, Adsorption isotherms of Glu6-GFP on nanoparticles (1 g L -1 ) in acetate buffer. B, Attenuated total reflection infrared (ATR-IR) spectra of Glu6-GFP incubated with magnetic nanoparticles in acetate, washing, elution in citrate and references. C, Small-angle neutron scattering (SANS) spectra of purified Glu6-GFP (P) incubated with nanoparticles (M) in acetate (Ac), washing (W), elution in citrate (Cit). D, Schematic of experimental procedure (E) image of separation process (F) schematic of the binding capacity of BIONs. Reprinted with permission from ref [224]
FIGURE 13 Adsorption and recovery isotherm of purified Glu6-GFP on bare iron oxide nanoparticles (BIONs). A, Adsorption isotherms of Glu6-GFP on nanoparticles (1 g L -1 ) in acetate buffer. B, Attenuated total reflection infrared (ATR-IR) spectra of Glu6-GFP incubated with magnetic nanoparticles in acetate, washing, elution in citrate and references. C, Small-angle neutron scattering (SANS) spectra of purified Glu6-GFP (P) incubated with nanoparticles (M) in acetate (Ac), washing (W), elution in citrate (Cit). D, Schematic of experimental procedure (E) image of separation process (F) schematic of the binding capacity of BIONs. Reprinted with permission from ref [224]CC-BY · From the PDF
Image 20
CC-BY · From the PDF
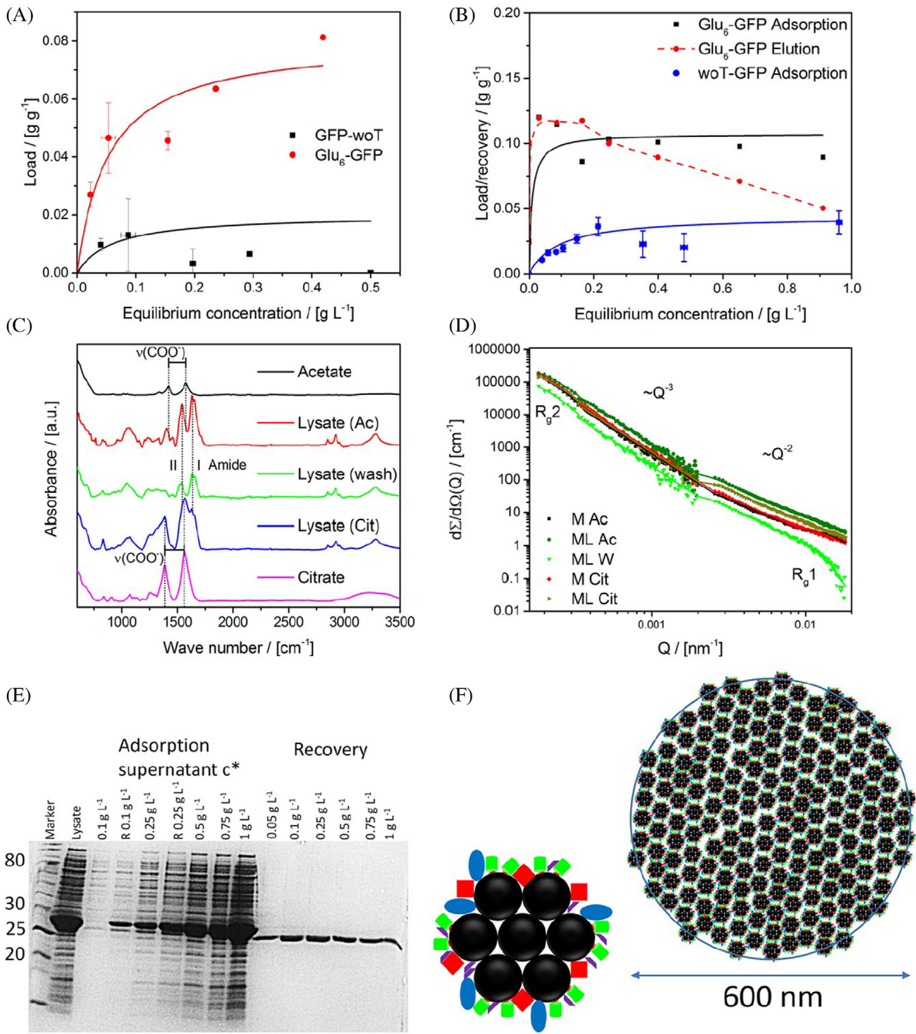
FIGURE 14 Purification of Glu6-GFP with bare iron oxide nanoparticles (BIONs) from cleared cell lysate. A, Adsorption behavior of 1:1 mixture of Glu6-GFP and woT-GFP on nanoparticles. B, Adsorption isotherms under similar conditions of Glu6-GFP and woT-GFP on BIONs, respectively. C, Attenuated total reflection infrared (ATR-IR) spectra of Glu6-GFP containing cleared cell lysate incubated with magnetic nanoparticles in acetate, washing, elution in citrate and references. D, Small-angle neutron scattering (SANS) intensities of lysate containing Glu6-GFP (L) incubated with nanoparticles (M) in acetate (Ac), washing (W), elution in citrate (Cit). E, A gel image of cell lysate and the supernatant of different lysates incubated with magnetite nanoparticles (1 g L -1 ) for 1 hours. Sample denoted with R letters were not incubated with nanoparticles. F, Schematic illustration of the agglomeration behavior and binding of the protein-BIONs system. Reprinted with permission from ref [224]
FIGURE 14 Purification of Glu6-GFP with bare iron oxide nanoparticles (BIONs) from cleared cell lysate. A, Adsorption behavior of 1:1 mixture of Glu6-GFP and woT-GFP on nanoparticles. B, Adsorption isotherms under similar conditions of Glu6-GFP and woT-GFP on BIONs, respectively. C, Attenuated total reflection infrared (ATR-IR) spectra of Glu6-GFP containing cleared cell lysate incubated with magnetic nanoparticles in acetate, washing, elution in citrate and references. D, Small-angle neutron scattering (SANS) intensities of lysate containing Glu6-GFP (L) incubated with nanoparticles (M) in acetate (Ac), washing (W), elution in citrate (Cit). E, A gel image of cell lysate and the supernatant of different lysates incubated with magnetite nanoparticles (1 g L -1 ) for 1 hours. Sample denoted with R letters were not incubated with nanoparticles. F, Schematic illustration of the agglomeration behavior and binding of the protein-BIONs system. Reprinted with permission from ref [224]CC-BY · From the PDF
Image 22
CC-BY · From the PDF
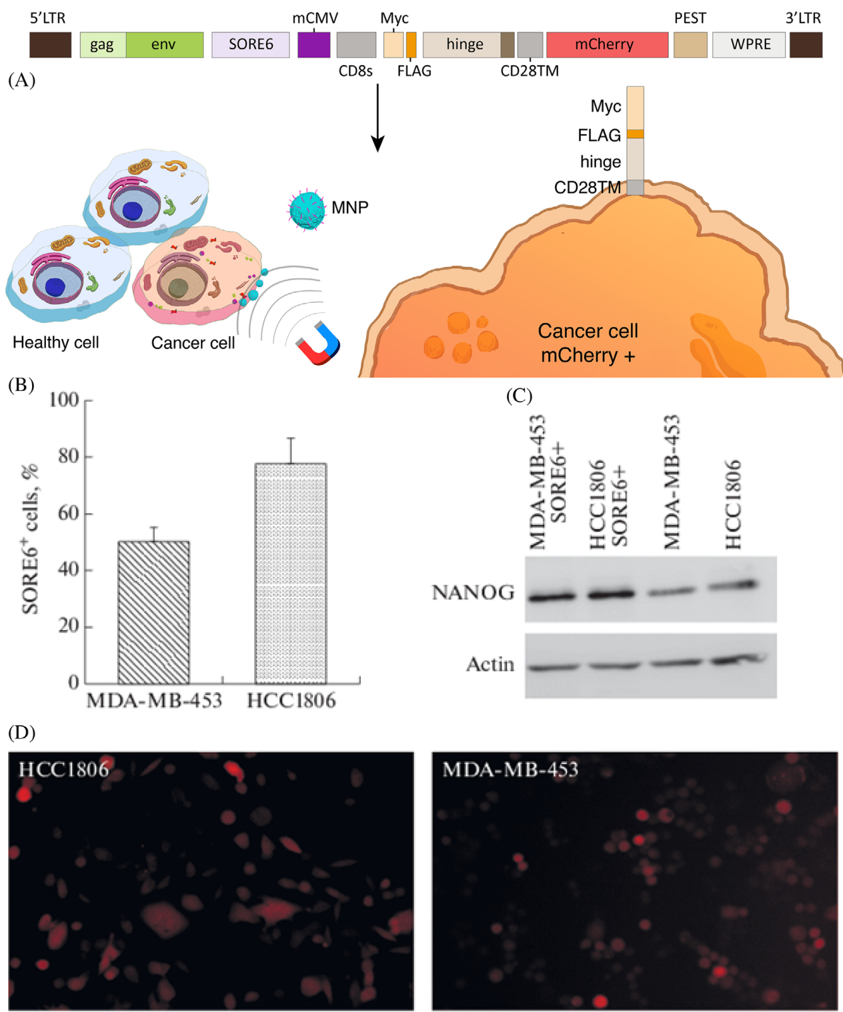
FIGURE 15 A, Scheme of the modified lentivirus-based construct obtained via cloning. B, Localization relative to the cell membrane is shown for the protein products resulting from transcription and translation of the lentivirus-based reporter construct, which is active in cancer stem cells. Accumulation and degradation of mCherry make it possible to visualize the cells that express the SOX 2 /OCT4 stem cell factors in the total cell population. The Myc-FLAG-hinge peptide sequence is anchored in the cell membrane via the CD28 transmembrane domain, and cells that express the construct are possible to select by magnetic separation; long terminal repeat is denoted as LTR; group antigens are presented as a gag; envelope protein is denoted as env; woodchuck hepatitis virus posttranscriptional regulatory element is denoted as WPRE. B, Contents of cells expressing SOX 2 /OCT4 in the MDA-MB-453 and HCC1806 cells transduced with the modified SORE6 reporter. C, The NANOG level in SORE6 + cells selected using the reporter is higher than in the total population. D, Microphotographs of HCC1806 and MDA-MB-453 cells transduced with the SORE6 reporter were obtained with a ZOE fluorescence microscope (BioRad). Reprinted with permission from ref. [227]
FIGURE 15 A, Scheme of the modified lentivirus-based construct obtained via cloning. B, Localization relative to the cell membrane is shown for the protein products resulting from transcription and translation of the lentivirus-based reporter construct, which is active in cancer stem cells. Accumulation and degradation of mCherry make it possible to visualize the cells that express the SOX 2 /OCT4 stem cell factors in the total cell population. The Myc-FLAG-hinge peptide sequence is anchored in the cell membrane via the CD28 transmembrane domain, and cells that express the construct are possible to select by magnetic separation; long terminal repeat is denoted as LTR; group antigens are presented as a gag; envelope protein is denoted as env; woodchuck hepatitis virus posttranscriptional regulatory element is denoted as WPRE. B, Contents of cells expressing SOX 2 /OCT4 in the MDA-MB-453 and HCC1806 cells transduced with the modified SORE6 reporter. C, The NANOG level in SORE6 + cells selected using the reporter is higher than in the total population. D, Microphotographs of HCC1806 and MDA-MB-453 cells transduced with the SORE6 reporter were obtained with a ZOE fluorescence microscope (BioRad). Reprinted with permission from ref. [227]CC-BY · From the PDF
Image 24
CC-BY · From the PDF
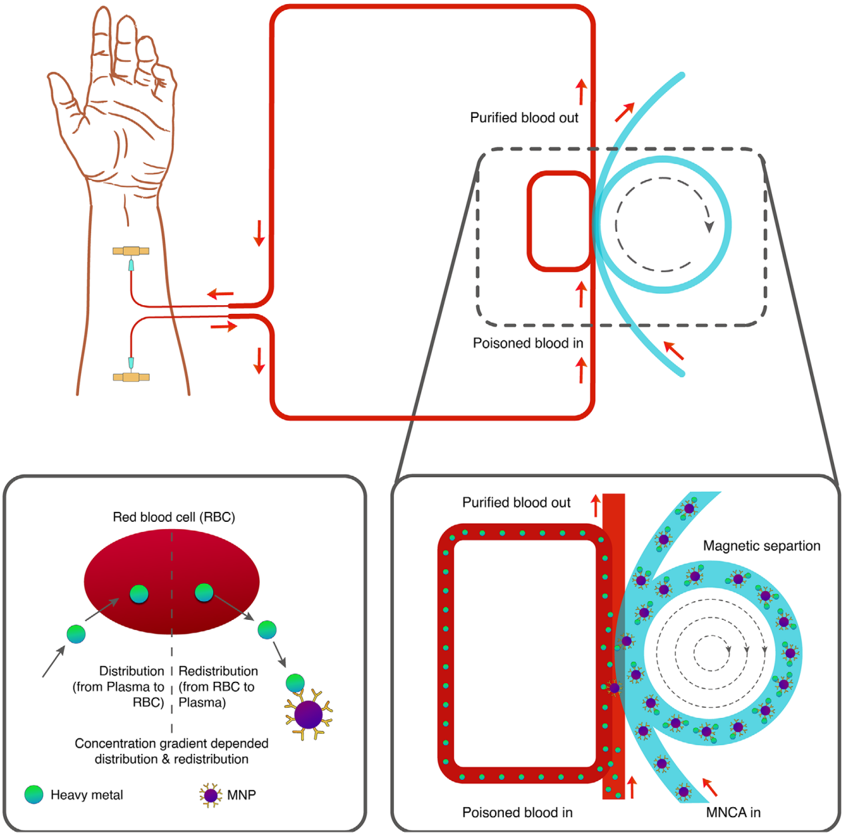
FIGURE 16 Schematic of heavy metal removal from blood by using a magnetic separation technique
FIGURE 16 Schematic of heavy metal removal from blood by using a magnetic separation techniqueCC-BY · From the PDF
Image 26
CC-BY · From the PDF
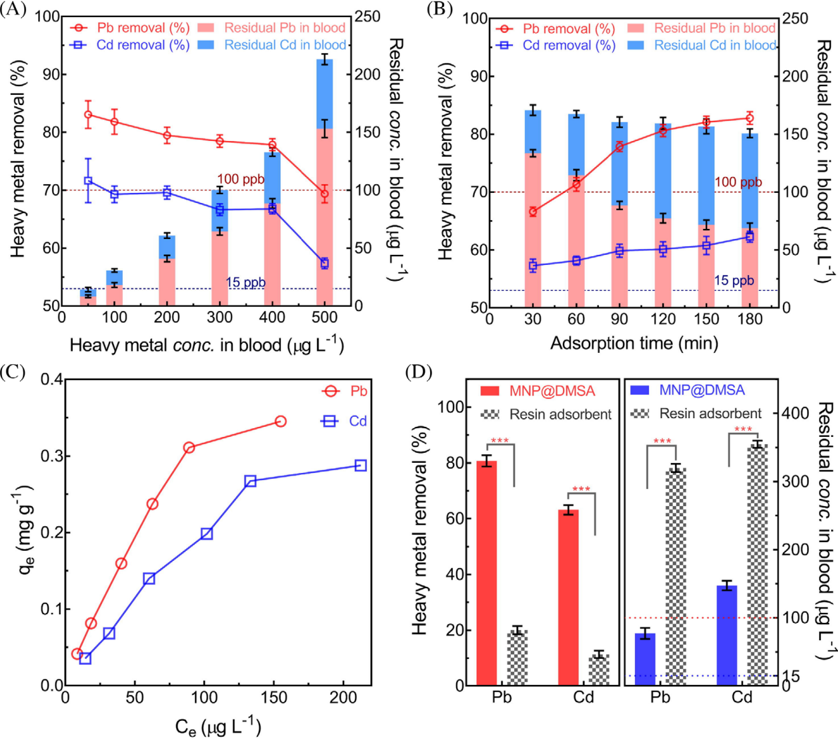
FIGURE 17 Removal metric of poisonous heavy metal from the blood sample. A, The removal efficiency of heavy metal with respect to different heavy metal concentrations in blood (B) Time-dependent adsorption of Pb and Cd. C, Adsorption isotherms of heavy metal removal from blood. D, Comparison of removal performance between MNP@DMSA and classical resin adsorbent. Concentrations of meso2,3-dimercaptosuccinic acid (DMSA) coated MNPs, and classical resin adsorbent were 1.0 mg mL -1 , initial heavy metal concentration was 400 µ g L -1 , and the temperature was 37.5 ◦ C. (n = 5, *** means P < 0.001). Reprinted with permission from ref [229]
FIGURE 17 Removal metric of poisonous heavy metal from the blood sample. A, The removal efficiency of heavy metal with respect to different heavy metal concentrations in blood (B) Time-dependent adsorption of Pb and Cd. C, Adsorption isotherms of heavy metal removal from blood. D, Comparison of removal performance between MNP@DMSA and classical resin adsorbent. Concentrations of meso2,3-dimercaptosuccinic acid (DMSA) coated MNPs, and classical resin adsorbent were 1.0 mg mL -1 , initial heavy metal concentration was 400 µ g L -1 , and the temperature was 37.5 ◦ C. (n = 5, *** means P < 0.001). Reprinted with permission from ref [229]CC-BY · From the PDF
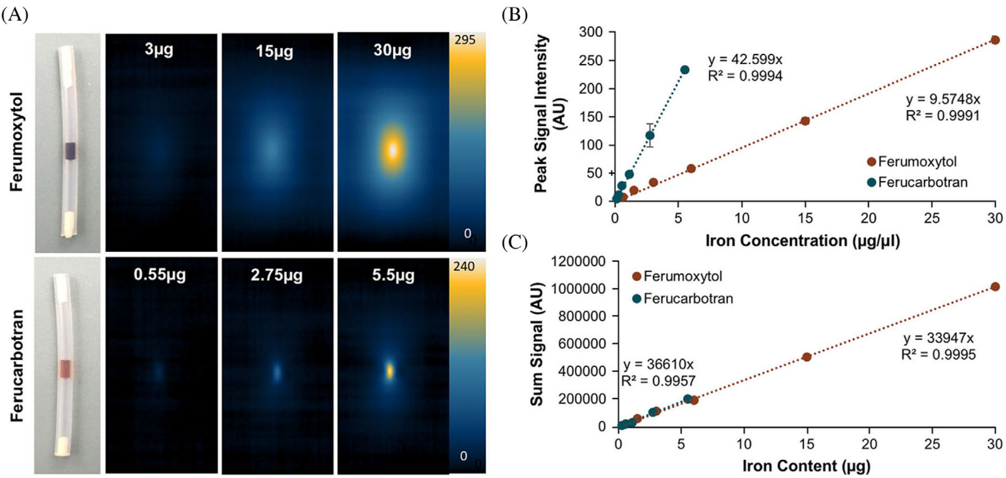
FIGURE 18 MPI properties of FDA approved ferumoxytol and ferucarbotran. A, MPI images with varying concentrations of ferumoxytol andferucarbotran in 1 µ Lof PBS ( = 1 µ m 3 ). Ferumoxytol exhibited a radiant effect with an MPI signal that swelled beyond the test tube boundary threshold, over an area of 5 mm 3 . Whereas ferucarbotran showed less radiant effect with a signal spread over an area of 1 mm 3 . B, Linear correlation with R 2 value of 0.9994 between peak MPI signal and Fe concentration for both nanotracers. A higher slope for ferucarbotran over ferumoxytol indicates better sensitivity of the MPI technique to detect ferucarbotran compared to ferumoxytol. C, Calibration data with a linear correlation ( R 2 = 0.995) for total iron content to MPI sum signal for both tracers. Reprinted with permission from ref [254]
FIGURE 18 MPI properties of FDA approved ferumoxytol and ferucarbotran. A, MPI images with varying concentrations of ferumoxytol andferucarbotran in 1 µ Lof PBS ( = 1 µ m 3 ). Ferumoxytol exhibited a radiant effect with an MPI signal that swelled beyond the test tube boundary threshold, over an area of 5 mm 3 . Whereas ferucarbotran showed less radiant effect with a signal spread over an area of 1 mm 3 . B, Linear correlation with R 2 value of 0.9994 between peak MPI signal and Fe concentration for both nanotracers. A higher slope for ferucarbotran over ferumoxytol indicates better sensitivity of the MPI technique to detect ferucarbotran compared to ferumoxytol. C, Calibration data with a linear correlation ( R 2 = 0.995) for total iron content to MPI sum signal for both tracers. Reprinted with permission from ref [254]CC-BY · From the PDF
Image 29
CC-BY · From the PDF
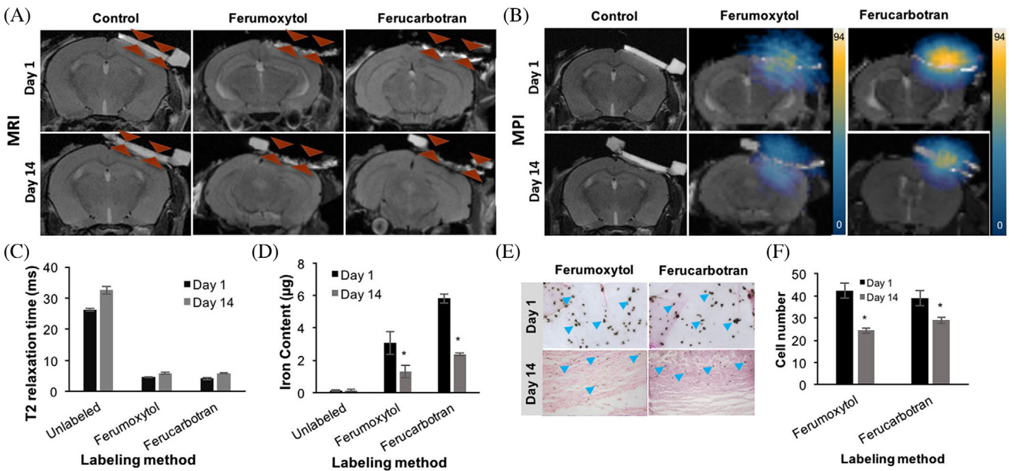
FIGURE 19 In vivo MRI, MPI, and corresponding quantifications of implanted labeled Mesenchymal stem cells (MSCs) into calvarial defects. A, Coronal fast spin-echo (FSE; TE/TR = 42 ms/3000 ms) MR images at day 1 and 14 after implantation of unlabeled, nanotracer labeled MSCin calvarial defects of experimental mice. B, Corresponding MPI images of the calvarial defects at different time points after implantation of therapeutic cells. C, Corresponding T2 relaxation times of the calvarial defects at different time points after implantation of unlabeled, ferumoxytol or ferucarbotran labeled MSCs, as measured using multi-echo spin echo (MESE) sequence (TR = 2000 ms, TE = 6, 13, 20, 27, 34, and 41 ms) Data are displayed as means and standard deviations of three animals per experimental group. D, The corresponding Fe content of the calvarial defects at different time points after implantation of unlabeled, ferumoxytol, or ferucarbotran labeled MSC, as measured using MPI signals. E-F, Corresponding DAB-Prussian blue stain and quantification of transplanted MSCs seeded in the scaffold at day 1 and day 14. *indicates significant differences between data obtained on day 1 and day 14 ( P < 0.05). Reprinted with permission from ref [254]
FIGURE 19 In vivo MRI, MPI, and corresponding quantifications of implanted labeled Mesenchymal stem cells (MSCs) into calvarial defects. A, Coronal fast spin-echo (FSE; TE/TR = 42 ms/3000 ms) MR images at day 1 and 14 after implantation of unlabeled, nanotracer labeled MSCin calvarial defects of experimental mice. B, Corresponding MPI images of the calvarial defects at different time points after implantation of therapeutic cells. C, Corresponding T2 relaxation times of the calvarial defects at different time points after implantation of unlabeled, ferumoxytol or ferucarbotran labeled MSCs, as measured using multi-echo spin echo (MESE) sequence (TR = 2000 ms, TE = 6, 13, 20, 27, 34, and 41 ms) Data are displayed as means and standard deviations of three animals per experimental group. D, The corresponding Fe content of the calvarial defects at different time points after implantation of unlabeled, ferumoxytol, or ferucarbotran labeled MSC, as measured using MPI signals. E-F, Corresponding DAB-Prussian blue stain and quantification of transplanted MSCs seeded in the scaffold at day 1 and day 14. *indicates significant differences between data obtained on day 1 and day 14 ( P < 0.05). Reprinted with permission from ref [254]CC-BY · From the PDF
Image 31
CC-BY · From the PDF
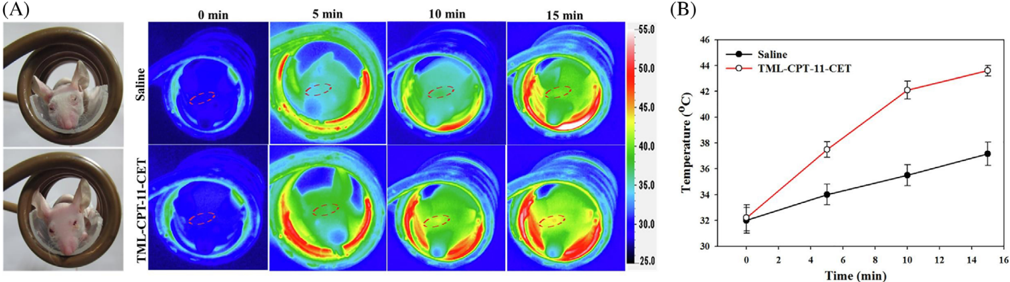
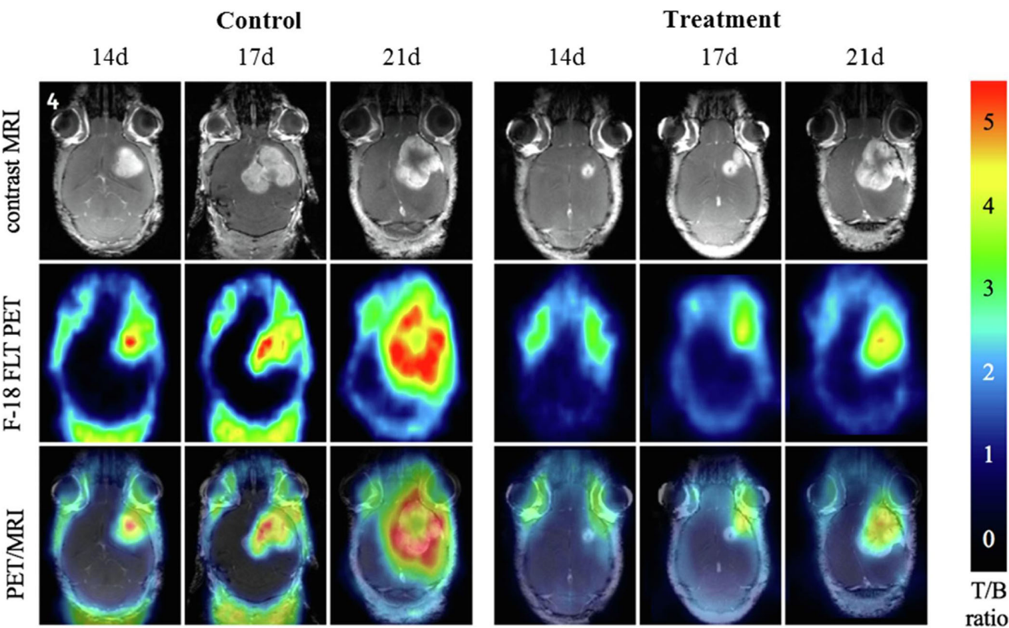
FIGURE 20 Evaluation of antitumor efficacy using PET/MRI analysis. Two tumor-bearing mice were placed in the control group with thermoresponsive magnetic liposome containing Cetuximab (TML-CET), and the treatment group TML-CET loaded with Irinotecan (CPT-11) (TML-CPT-11-CET) under magnetic localization and alternating magnetic field treatment for different time point, at day 14 (14d), day 17 (17d) and day 21 (21d) post-implantation of U87 cells. Reprinted with permission from ref [158]
FIGURE 20 Evaluation of antitumor efficacy using PET/MRI analysis. Two tumor-bearing mice were placed in the control group with thermoresponsive magnetic liposome containing Cetuximab (TML-CET), and the treatment group TML-CET loaded with Irinotecan (CPT-11) (TML-CPT-11-CET) under magnetic localization and alternating magnetic field treatment for different time point, at day 14 (14d), day 17 (17d) and day 21 (21d) post-implantation of U87 cells. Reprinted with permission from ref [158]CC-BY · From the PDF
Image 33
CC-BY · From the PDF
Image 34
CC-BY · From the PDF
Image 35
CC-BY · From the PDF
Image 36
CC-BY · From the PDF
Image 37
CC-BY · From the PDF
Image 38
CC-BY · From the PDF
Image 39
CC-BY · From the PDF

Verification

Claims the paper makes

The claims and statistics of this paper haven’t been checked yet.

Run the check — free, no account needed. It reads the open-access text and checks the sources it cites.

A few free checks a day · papers already verified open instantly · results are public

Claims other papers make about this one

Each is checked against this paper’s own text: does it say what the citing paper says it does?

Self-check

Percentages, sums and reported differences re-computed from the paper’s own numbers.

The self-check needs the paper’s full text.

Citations

Cites

Research works printed but not linked: 316

  1. 10.1080/10717544.2019.1667450 · DOI
  2. 10.1096/fj.201900716RR · DOI
  3. 10.3390/pharmaceutics12090841 · DOI
  4. 10.1016/j.jare.2018.06.005 · DOI · Paper page
  5. 10.1002/adhm.201700845 · DOI
  6. 10.1515/ntrev-2017-0193 · DOI
  7. Wong J., 2017, Curr. Pharm. Des., 23, 10.2174/1381612823666170215104659 · DOI
  8. 10.3390/magnetochemistry5040066 · DOI
  9. 10.1016/j.addr.2011.03.008 · DOI
  10. 10.1016/j.addr.2008.03.018 · DOI
  11. 10.1016/j.partic.2016.06.001 · DOI · Paper page
  12. 10.1016/j.jconrel.2015.09.039 · DOI
  13. Dobson, 2008, Int. J. Nanomedicine, 3, 169, 10.2147/IJN.S1608 · DOI
  14. 10.1016/j.jmmm.2005.02.045 · DOI
  15. 10.1016/j.msec.2015.04.047 · DOI
  16. 10.1263/jbb.100.1 · DOI
  17. Majidi S., 2016, Nanomed. Biotechnol., 44, 722
  18. 10.1080/10408347.2020.1797465 · DOI
  19. Mosayebi J., 2017, Mater, 6, 1700306
  20. 10.1039/b207789b · DOI
  21. 10.1007/s00216-005-0255-7 · DOI
  22. 10.1016/j.jmmm.2006.06.003 · DOI
  23. 10.1016/j.jallcom.2018.11.280 · DOI
  24. Calle I., 2019, Talanta, 199, 449, 10.1016/j.talanta.2019.02.085 · DOI
  25. 10.1016/j.solidstatesciences.2019.05.005 · DOI
  26. 10.1016/j.proeng.2011.12.498 · DOI
  27. 10.1016/j.jmmm.2018.12.090 · DOI
  28. 10.1016/j.jmmm.2008.08.083 · DOI
  29. 10.1016/j.apsusc.2012.01.127 · DOI
  30. 10.1016/j.jmmm.2010.08.048 · DOI
  31. 10.1007/s11051-010-9982-6 · DOI
  32. 10.1021/jp0686285 · DOI
  33. 10.1016/j.partic.2015.09.011 · DOI
  34. 10.1016/j.cej.2015.06.066 · DOI
  35. 10.1021/acsnano.7b00609 · DOI
  36. 10.1016/j.colsurfa.2009.02.003 · DOI
  37. 10.1016/j.jallcom.2019.152179 · DOI
  38. 10.1016/j.jmmm.2019.166083 · DOI
  39. 10.1007/s10948-018-4834-1 · DOI
  40. Lee Y. J., 2020, J. Nanoparticle Res., 22, 1, 10.1007/s11051-019-4718-8 · DOI
  41. 10.1016/j.matchemphys.2020.122950 · DOI
  42. Oh A. H., 2020, Ceram. Int., 46, 10723, 10.1016/j.ceramint.2020.01.080 · DOI
  43. 10.1016/j.optmat.2020.110381 · DOI
  44. 10.1186/1556-276X-7-144 · DOI
  45. 10.3390/ma12030465 · DOI
  46. Faraji M., 2010, Chem. Soc., 7, 1
  47. 10.1088/0022-3727/36/13/202 · DOI
  48. Ananjana K., 2020, New J. Chem., 44, 1962, 10.1039/C9NJ05343C · DOI
  49. 10.1016/j.ceramint.2019.10.005 · DOI
  50. 10.1080/10426914.2017.1401720 · DOI
  51. 10.1016/j.physe.2018.04.009 · DOI
  52. 10.1002/anie.200602866 · DOI
  53. 10.1186/1752-153X-6-23 · DOI
  54. 10.1088/1674-1056/23/3/037503 · DOI
  55. 10.1088/1361-6528/aaae59 · DOI
  56. 10.1039/b815548h · DOI
  57. 10.1088/1361-6528/aa5ab0 · DOI
  58. Orsini N. Jović, 2018, J. Magn. Magn. Mater., 449, 286, 10.1016/j.jmmm.2017.10.053 · DOI
  59. 10.1021/ja016812s · DOI
  60. Eatemadi A., 2016, lls Nanomedicine Biotechnol, 44, 111
  61. 10.1039/C5GC00943J · DOI
  62. 10.3390/ijms141019636 · DOI
  63. 10.2147/NSA.S99986 · DOI · Paper page
  64. A. H. Choi R. C. Conway S. Cazalbou B. Ben‐Nissan 2018 Elsevier 63 93 · DOI
  65. Y. Lu W. Dong J. Ding W. Wang A. Wang 2019 Elsevier 485 536 · DOI
  66. 10.1590/S0366-69132009000400013 · DOI
  67. 10.1038/s41598-018-30802-1 · DOI
  68. 10.1016/j.jmmm.2014.05.015 · DOI · Paper page
  69. 10.1007/s11051-011-0631-5 · DOI
  70. 10.1039/c3ra40348c · DOI
  71. 10.1016/B978-0-12-804609-8.00007-8 · DOI
  72. D'Arienzo M., 2017, Studies in Surface Science Catalysis, 477
  73. 10.3389/fmats.2019.00179 · DOI
  74. T. D. Clemons R. H. Kerr A. Joos 2019 Elsevier 193 210 · DOI
  75. 10.1016/B978-0-12-813731-4.00001-1 · DOI
  76. 10.1039/C7CS00777A · DOI
  77. 10.1016/B978-0-323-37829-1.00006-7 · DOI
  78. 10.1039/C6RA11819D · DOI
  79. 10.1016/j.ces.2006.02.032 · DOI
  80. 10.1039/c1ra00023c · DOI
  81. 10.1007/978-3-319-15338-4_4 · DOI
  82. 10.1080/00986445.2013.858039 · DOI
  83. 10.1007/s11051-012-0964-8 · DOI
  84. Wang X., 2003, Molecules, 8, 40, 10.3390/80100040 · DOI
  85. 10.1146/annurev-chembioeng-062011-080930 · DOI
  86. 10.3390/molecules24071224 · DOI
  87. Riaz S., 2014, IEEE Trans. Magn., 50, 1
  88. Ganesh Kumar C., 2017, Nanostructures Drug Deliv, 1

  89. Dawi E. A., 2020, Appl. Phys. A, 126, 316, 10.1007/s00339-020-03498-2 · DOI
  90. 10.1016/j.cis.2010.02.001 · DOI
  91. 10.1039/C6RA02129H · DOI
  92. 10.2217/nnm.10.114 · DOI
  93. 10.1186/s11671-017-2084-y · DOI
  94. 10.1016/j.msec.2017.02.143 · DOI
  95. 10.2147/IJN.S156528 · DOI
  96. 10.1039/c2jm16851k · DOI
  97. Tang S., 2016, Nanoscale Res. Lett., 11, 334, 10.1186/s11671-016-1536-0 · DOI
  98. 10.1186/1556-276X-9-304 · DOI
  99. 10.1186/s11671-015-0920-5 · DOI
  100. 10.1007/s10854-017-6957-8 · DOI
  101. 10.1023/B:JMSM.0000021126.32934.20 · DOI
  102. 10.1364/BOE.3.002500 · DOI
  103. 10.3390/antibiotics7020046 · DOI
  104. Shi D., 2016, Int. J. Nanomedicine, 11, 5371, 10.2147/IJN.S108333 · DOI
  105. Margel S., 2012, Int. J. Nanomedicine, 7, 5517, 10.2147/IJN.S33710 · DOI
  106. 10.2147/IJN.S39048 · DOI
  107. 10.1021/tx200369s · DOI
  108. 10.3390/ijms19082230 · DOI
  109. Mahmoud M. E., 2016, Chem. Eng. J., 293, 200, 10.1016/j.cej.2016.02.056 · DOI
  110. 10.1007/s11595-017-1555-4 · DOI
  111. 10.1080/03602532.2019.1697282 · DOI
  112. 10.1021/acsomega.8b03348 · DOI
  113. 10.1089/dna.2005.24.479 · DOI
  114. 10.3390/ph13060121 · DOI
  115. 10.3389/fphar.2015.00286 · DOI
  116. 10.1016/j.jconrel.2019.03.003 · DOI
  117. 10.1039/D0BM00532K · DOI
  118. 10.2147/IJN.S117495 · DOI
  119. 10.1021/acs.accounts.0c00280 · DOI
  120. 10.1039/C6PY01006G · DOI
  121. 10.1016/j.cclet.2018.10.038 · DOI
  122. Rȩkorajska A., 2019, Nanotechnology, 30, 315101, 10.1088/1361-6528/ab19d3 · DOI
  123. 10.1021/acsami.9b20603 · DOI
  124. 10.1016/j.polymdegradstab.2020.109255 · DOI
  125. 10.1088/1741-2552/ab4a22 · DOI
  126. 10.1007/s10904-019-01301-1 · DOI
  127. 10.1016/j.carres.2019.107889 · DOI
  128. 10.3390/ma13010188 · DOI
  129. 10.1016/j.ijbiomac.2019.04.005 · DOI
  130. 10.1081/DDC-43985 · DOI
  131. 10.1002/pi.5930 · DOI
  132. 10.1002/adhm.202000118 · DOI
  133. 10.1016/j.snb.2019.03.030 · DOI
  134. 10.1016/j.jddst.2019.101293 · DOI
  135. 10.1016/j.colsurfb.2020.110896 · DOI
  136. 10.1016/j.jddst.2020.101542 · DOI
  137. 10.1021/acs.biomac.8b00636 · DOI
  138. 10.1021/acsbiomaterials.8b01307 · DOI
  139. 10.1016/j.colsurfb.2014.07.049 · DOI
  140. 10.1016/j.carbpol.2010.06.033 · DOI
  141. 10.1016/j.ijpharm.2006.07.042 · DOI
  142. 10.1021/acs.biomac.5b00801 · DOI
  143. 10.1080/09205063.2014.956166 · DOI
  144. 10.1088/0964-1726/25/2/027001 · DOI
  145. 10.1016/j.actbio.2007.07.009 · DOI
  146. 10.3390/molecules23092272 · DOI
  147. 10.1016/j.jcis.2014.03.046 · DOI
  148. 10.1080/02652048.2017.1339738 · DOI
  149. Il Choi W., 2019, RSC Adv., 9, 15053, 10.1039/C9RA02529D · DOI
  150. 10.1016/j.cej.2019.05.055 · DOI
  151. 10.1039/C8TB02684J · DOI
  152. Du Nguyen V., 2017, Colloids Surfaces B Biointerfaces, 154, 104, 10.1016/j.colsurfb.2017.03.008 · DOI

  153. 10.1016/j.ceramint.2018.04.034 · DOI
  154. 10.1016/j.jmmm.2016.10.122 · DOI
  155. 10.1016/j.jinorgbio.2019.110778 · DOI
  156. 10.1038/nrn.2015.2 · DOI
  157. 10.1038/nbt.3659 · DOI · Paper page
  158. 10.1038/mt.2016.10 · DOI
  159. 10.1038/nrcardio.2016.139 · DOI
  160. 10.1146/annurev-biophys-062215-010822 · DOI · Paper page
  161. 10.1146/annurev-genom-083115-022258 · DOI
  162. 10.1038/s41551-018-0318-7 · DOI
  163. 10.1038/s41598-020-61465-6 · DOI
  164. 10.1021/la9041919 · DOI
  165. 10.1007/s11095-014-1448-6 · DOI
  166. 10.1007/s12033-018-0145-9 · DOI
  167. 10.1038/s41598-019-40222-4 · DOI
  168. 10.1021/acsnano.8b00763 · DOI
  169. 10.1021/acs.langmuir.9b02759 · DOI
  170. 10.1007/BF01490027 · DOI
  171. 10.1021/acs.langmuir.0c00908 · DOI
  172. 10.1016/j.colsurfb.2019.110461 · DOI
  173. 10.1016/j.jddst.2020.101563 · DOI
  174. 10.1016/j.xphs.2018.11.044 · DOI
  175. 10.1016/j.msec.2019.03.004 · DOI
  176. 10.1080/00914037.2018.1493687 · DOI
  177. 10.1039/C8BM01672K · DOI
  178. Rashid M., 2019, Drugs Delivery System, 297

  179. Taheri‐Kafrani A., 2017, Nano‐Microscale Drug Delivery System, 75, 10.1016/B978-0-323-52727-9.00005-4 · DOI
  180. 10.1016/j.drudis.2016.06.028 · DOI
  181. 10.1021/acs.langmuir.7b00742 · DOI
  182. 10.1109/TMAG.2016.2517602 · DOI
  183. 10.1016/j.colsurfb.2018.10.045 · DOI
  184. 10.1016/j.matchemphys.2018.01.064 · DOI
  185. 10.1016/j.colsurfb.2019.110531 · DOI
  186. 10.1016/j.biopha.2016.01.002 · DOI
  187. 10.1080/03639045.2018.1451881 · DOI
  188. 10.1002/adfm.201902634 · DOI
  189. 10.1016/j.molliq.2019.111367 · DOI
  190. 10.1039/C8NJ06105J · DOI
  191. 10.1016/j.nano.2019.102040 · DOI
  192. 10.1039/D0NJ00939C · DOI
  193. 10.1016/j.jcis.2019.02.086 · DOI
  194. 10.1016/j.jiec.2015.01.021 · DOI
  195. 10.1007/s12272-020-01206-5 · DOI
  196. 10.3390/nano5010063 · DOI
  197. 10.1016/j.jmmm.2013.11.006 · DOI
  198. 10.1016/S0304-8853(99)00065-7 · DOI
  199. Chang D., 2018, Front. Pharmacol., 9
  200. 10.1021/jacs.9b13082 · DOI

200 of 316 shown

Cited by

Sorted by citations

See all 300

Metadata

Authors
Anik, M. I., Hossain, M. K., Hossain, I., Mahfuz, A. M. U. B., Rahman, M. T., & Ahmed, I.
Venue
Nano Select
Publisher
Wiley
Published
2021-01-21
Volume
2
Issue
6
Pages
1146-1186
ISSN
2688-4011
Cited by
300
References
9
Language
en

About these checks

Registry, retraction, Cites and statistics results are computed, not judged, with one exception: a printed reference that no index lists is read once by a model before it counts as a citation error. Claims are extracted by a model and kept only when their quote appears verbatim in the text; each cited source is then checked, with a model’s help, for whether it says what the claim relies on. Those verdicts can be wrong — read the claim’s quote and the cited source before relying on one.

Statistics and arithmetic are recomputed, not judged.

Confidence bands are shown only for fields calibrated on our annotated test set. None is calibrated yet, so no band is shown.

What counts as a claim ›How we measure confidence ›How we check this ›

Are you an author, or do you see a problem with this page? Request a review