

The DOI matches its Crossref record; 88 of the 88 references it cites were found in a registry or an index.
Deficiency of TYROBP, an adapter protein for TREM2 and CR3 receptors, is neuroprotective in a mouse model of early Alzheimer’s pathology
Open accessAbstract
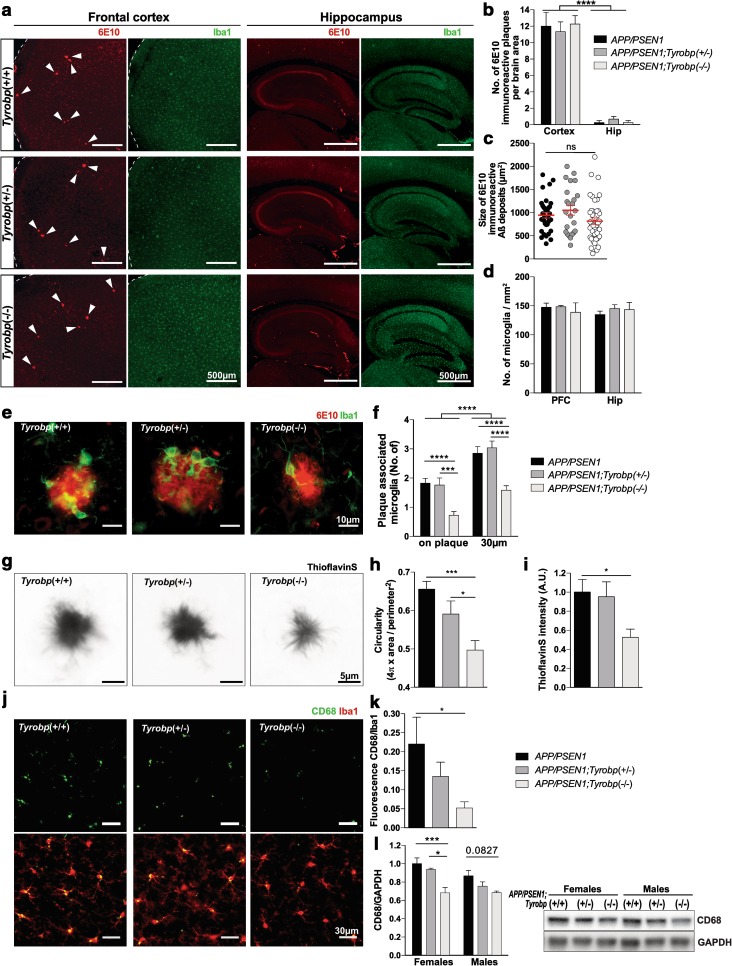
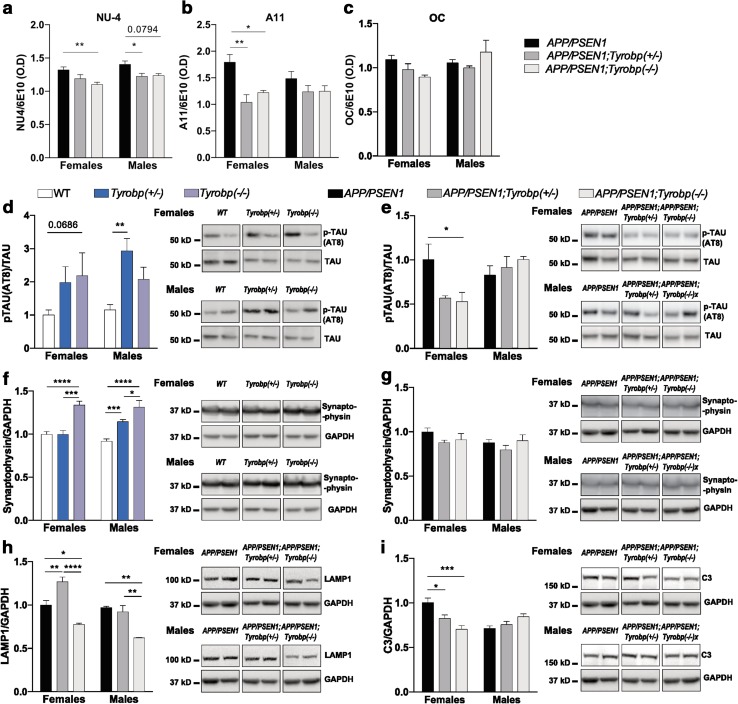
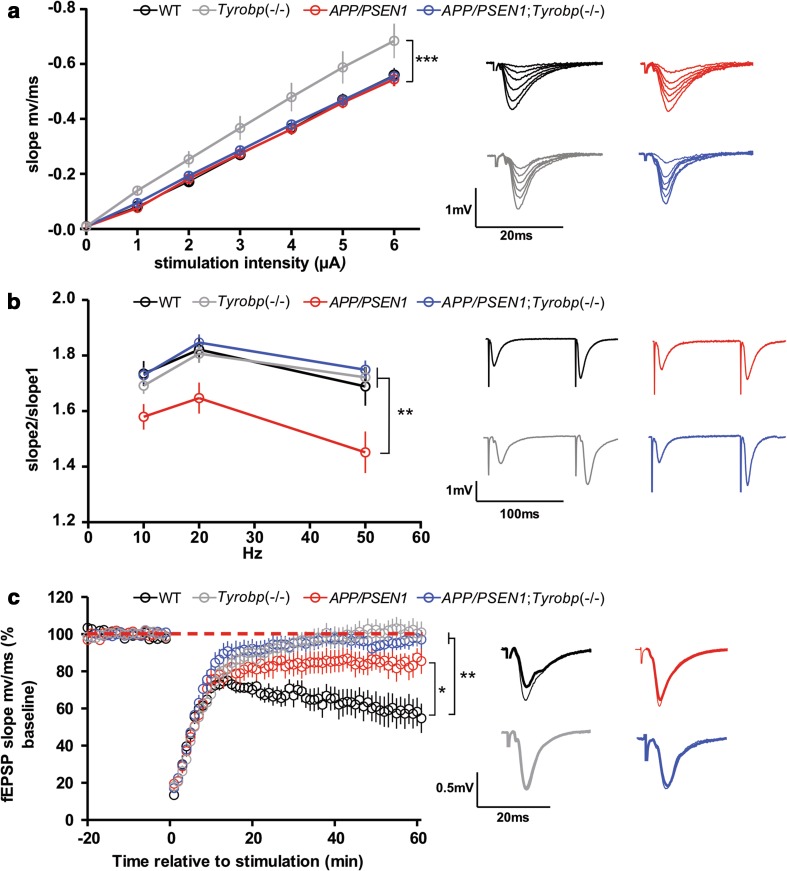
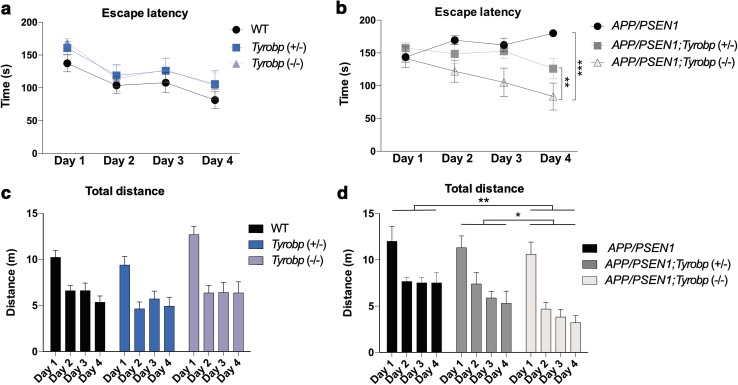
Conventional genetic approaches and computational strategies have converged on immune-inflammatory pathways as key events in the pathogenesis of late onset sporadic Alzheimer’s disease (LOAD). Mutations and/or differential expression of microglial specific receptors such as TREM2, CD33, and CR3 have been associated with strong increased risk for developing Alzheimer’s disease (AD). DAP12 (DNAX-activating protein 12)/TYROBP, a molecule localized to microglia, is a direct partner/adapter for TREM2, CD33, and CR3. We and others have previously shown that TYROBP expression is increased in AD patients and in mouse models. Moreover, missense mutations in the coding region of TYROBP have recently been identified in some AD patients. These lines of evidence, along with computational analysis of LOAD brain gene expression, point to DAP12/TYROBP as a potential hub or driver protein in the pathogenesis of AD. Using a comprehensive panel of biochemical, physiological, behavioral, and transcriptomic assays, we evaluated in a mouse model the role of TYROBP in early stage AD. We crossed an Alzheimer’s model mutant APP KM670/671NL /PSEN1 Δexon9 (APP/PSEN1) mouse model with Tyrobp −/− mice to generate AD model mice deficient or null for TYROBP (APP/PSEN1; Tyrobp +/− or APP/PSEN1; Tyrobp −/−). While we observed relatively minor effects of TYROBP deficiency on steady-state levels of amyloid-β peptides, there was an effect of Tyrobp deficiency on the morphology of amyloid deposits resembling that reported by others for Trem2 −/− mice. We identified modulatory effects of TYROBP deficiency on the level of phosphorylation of TAU that was accompanied by a reduction in the severity of neuritic dystrophy. TYROBP deficiency also altered the expression of several AD related genes, including Cd33. Electrophysiological abnormalities and learning behavior deficits associated with APP/PSEN1 transgenes were greatly attenuated on a Tyrobp-null background. Some modulatory effects of TYROBP on Alzheimer’s-related genes were only apparent on a background of mice with cerebral amyloidosis due to overexpression of mutant APP/PSEN1. These results suggest that reduction of TYROBP gene expression and/or protein levels could represent an immune-inflammatory therapeutic opportunity for modulating early stage LOAD, potentially leading to slowing or arresting the progression to full-blown clinical and pathological LOAD.
Overview
The claims and statistics of this paper haven’t been checked yet.
Run the check — free, no account needed. It reads the open-access text and checks the sources it cites.
Integrity signals
Registry
Cites
Statistics
Figures
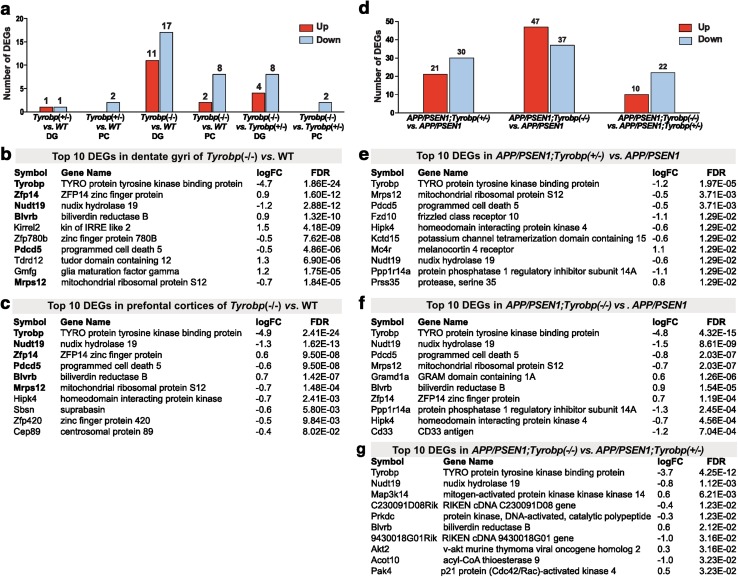
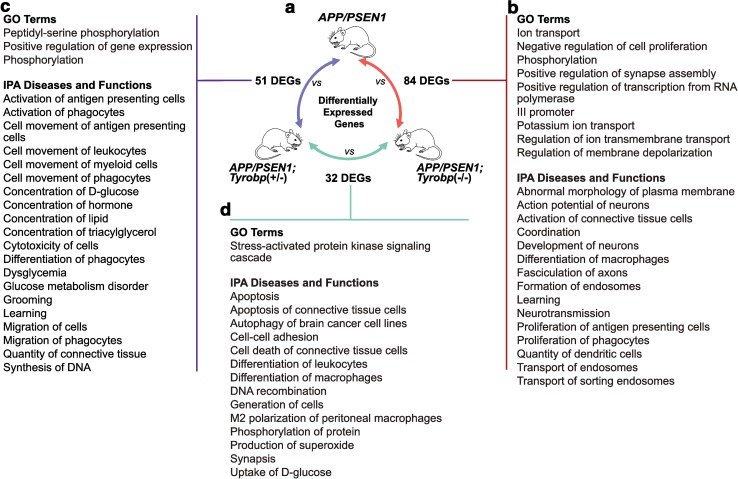
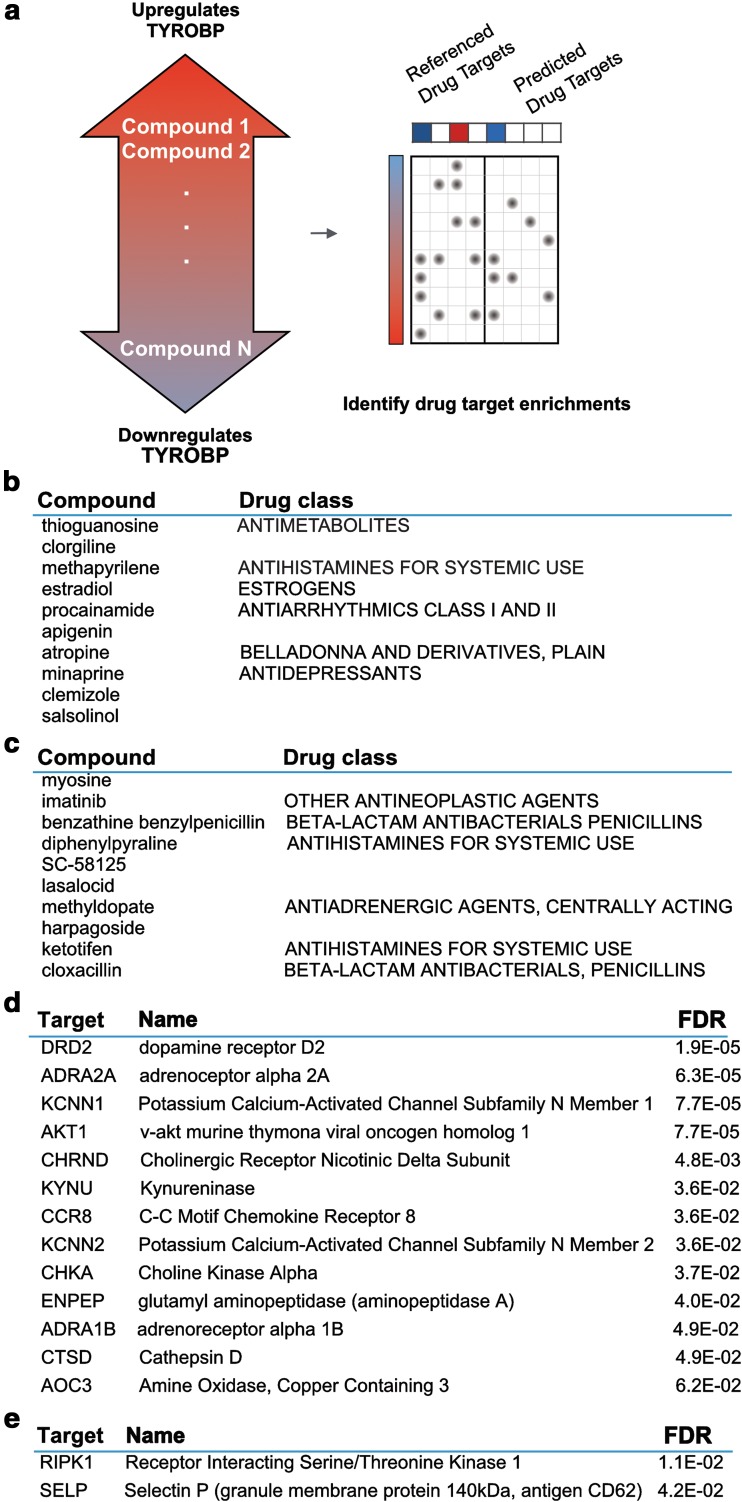
Verification
Claims the paper makes
The claims and statistics of this paper haven’t been checked yet.
Run the check — free, no account needed. It reads the open-access text and checks the sources it cites.
Claims other papers make about this one
Each is checked against this paper’s own text: does it say what the citing paper says it does?
The source backs part of the claim, not all of it — or backs it for a different population, condition or comparison.
In the citing paper
“Support for beneficial outcomes associated with maintenance and/or restoration of homeostatic functions of microglia comes from the numerous studies targeting the members of this pathway, including Trem2,48,50–52 Tyrobp,53,54 and miR155.41,55”
From Microglial INPP5D limits plaque formation and glial reactivity in the PSAPP mouse model of Alzheimer's disease (2023) · cites this paper as [53]
Experimental — accuracy not yet measuredThe source backs part of the claim, not all of it — or backs it for a different population, condition or comparison.
In the citing paper
“However, as we have previously seen in our studies modulating Tyrobp expression, manipulation of molecules involved in immune/microglial function in either direction may result in detrimental or exacerbated pathological outcomes.49,53,54,56”
From Microglial INPP5D limits plaque formation and glial reactivity in the PSAPP mouse model of Alzheimer's disease (2023) · cites this paper as [53]
Experimental — accuracy not yet measuredThe cited source says what the claim attributes to it.
In the citing paper
“Previous studies have shown that a reduction of Tyrobp has neuroprotective effects on AD pathology38,39.”
From Effects of SPI1-mediated transcriptome remodeling on Alzheimer's disease-related phenotypes in mouse models of Aβ amyloidosis (2024) · cites this paper as [38]
Self-check
Percentages, sums and reported differences re-computed from the paper’s own numbers.
The self-check needs the paper’s full text.
Citations
Cites
R: A Language and Environment for Statistical Computing
R Core Team (2000) · doi:10.32614/r.manuals · Cited by 355,893
Controlling the False Discovery Rate: A Practical and Powerful Approach to Multiple Testing
Benjamini, Y., & Hochberg, Y. (1995) · Journal of the Royal Statistical Society Series B: Statistical Methodology · doi:10.1111/j.2517-6161.1995.tb02031.x · Cited by 109,482
Robinson, M. D., McCarthy, D. J., & Smyth, G. K. (2010) · Bioinformatics · doi:10.1093/bioinformatics/btp616 · Cited by 41,364
limma powers differential expression analyses for RNA-sequencing and microarray studies
Ritchie, M. E., Phipson, B., Wu, D., Hu, Y., Law, C. W., Shi, W., & Smyth, G. K. (2015) · Nucleic Acids Research · doi:10.1093/nar/gkv007 · Cited by 40,458
Systematic and integrative analysis of large gene lists using DAVID bioinformatics resources
Huang, D. W., Sherman, B. T., & Lempicki, R. A. (2009) · Nature Protocols · doi:10.1038/nprot.2008.211 · Cited by 35,890
Huang, D. W., Sherman, B. T., & Lempicki, R. A. (2009) · Nucleic Acids Research · doi:10.1093/nar/gkn923 · Cited by 14,108
Lamb, J., Crawford, E. D., Peck, D., Modell, J. W., Blat, I. C., Wrobel, M. J., Lerner, J., Brunet, J.-P., Subramanian, A., Ross, K. N., et al. (2006) · Science · doi:10.1126/science.1132939 · Cited by 5,257
Meta-Analysis of 74,046 Individuals Identifies 11 New Susceptibility Loci for Alzheimer’s Disease
(EADI), E. A. D. I., Lambert, J.-C., (GERAD), G. A. E. R. I. A. D., Alzheimer's Disease Genetic Consortium (ADGC), (CHARGE), C. F. H. A. A. R. I. G. E., Ibrahim-Verbaas, C. A., Harold, D., Naj, A. C., Sims, R., Bellenguez, C., et al. (2013) · Nature Genetics · doi:10.1038/ng.2802 · Cited by 4,336
DrugBank: a comprehensive resource for in silico drug discovery and exploration
Wishart, D. S. (2006) · Nucleic Acids Research · doi:10.1093/nar/gkj067 · Cited by 3,892
Oakley, H., Cole, S. L., Logan, S., Maus, E., Shao, P., Craft, J., Guillozet-Bongaarts, A., Ohno, M., Disterhoft, J., Van Eldik, L., et al. (2006) · The Journal of Neuroscience · doi:10.1523/jneurosci.1202-06.2006 · Cited by 3,530 · cited 1×
“When 5XFAD mice, which develop rapid and aggressive amyloid pathology and neuronal loss [56], were rendered deficient or null for TYROBP or TREM2, microglial clustering around plaques and plaque compaction were reduced at 4 months of age [85].”
BackgroundComplement and microglia mediate early synapse loss in Alzheimer mouse models
Hong, S., Beja-Glasser, V. F., Nfonoyim, B. M., Frouin, A., Li, S., Ramakrishnan, S., Merry, K. M., Shi, Q., Rosenthal, A., Barres, B. A., et al. (2016) · Science · doi:10.1126/science.aad8373 · Cited by 3,343
TREM2 Variants in Alzheimer's Disease
Guerreiro, R., Wojtas, A., Bras, J., Carrasquillo, M., Rogaeva, E., Majounie, E., Cruchaga, C., Sassi, C., Kauwe, J. S. K., Younkin, S., et al. (2013) · New England Journal of Medicine · doi:10.1056/nejmoa1211851 · Cited by 3,020
Relating protein pharmacology by ligand chemistry
Keiser, M. J., Roth, B. L., Armbruster, B. N., Ernsberger, P., Irwin, J. J., & Shoichet, B. K. (2007) · Nature Biotechnology · doi:10.1038/nbt1284 · Cited by 2,402
Memory deficits associated with senescence: A neurophysiological and behavioral study in the rat.
Barnes, C. A. (1979) · Journal of Comparative and Physiological Psychology · doi:10.1037/h0077579 · Cited by 2,088
Initiative, T. A. D. N., Hollingworth, P., CHARGE consortium, EADI1 consortium, Harold, D., Sims, R., Gerrish, A., Lambert, J.-C., Carrasquillo, M. M., Abraham, R., et al. (2011) · Nature Genetics · doi:10.1038/ng.803 · Cited by 1,997
DrugBank 4.0: shedding new light on drug metabolism
Law, V., Knox, C., Djoumbou-Feunang, Y., Jewison, T., Guo, A. C., Liu, Y., Maciejewski, A., Arndt, D., Wilson, M., Neveu, V., et al. (2013) · Nucleic Acids Research · doi:10.1093/nar/gkt1068 · Cited by 1,995
Naj, A. C., Jun, G., Beecham, G. W., Wang, L.-S., Vardarajan, B. N., Buros, J., Gallins, P. J., Buxbaum, J. D., Jarvik, G. P., Crane, P. K., et al. (2011) · Nature Genetics · doi:10.1038/ng.801 · Cited by 1,901
Predicting new molecular targets for known drugs
Keiser, M. J., Setola, V., Irwin, J. J., Laggner, C., Abbas, A. I., Hufeisen, S. J., Jensen, N. H., Kuijer, M. B., Matos, R. C., Tran, T. B., et al. (2009) · Nature · doi:10.1038/nature08506 · Cited by 1,667
Integrated Systems Approach Identifies Genetic Nodes and Networks in Late-Onset Alzheimer’s Disease
Zhang, B., Gaiteri, C., Bodea, L.-G., Wang, Z., McElwee, J., Podtelezhnikov, A. A., Zhang, C., Xie, T., Tran, L., Dobrin, R., et al. (2013) · Cell · doi:10.1016/j.cell.2013.03.030 · Cited by 1,657
Self-citationLi, J., McQuade, T., Siemer, A. B., Napetschnig, J., Moriwaki, K., Hsiao, Y.-S., Damko, E., Moquin, D., Walz, T., McDermott, A., et al. (2012) · Cell · doi:10.1016/j.cell.2012.06.019 · Cited by 1,222
Oxidative stress and Alzheimer disease
Christen, Y. (2000) · American Journal of Clinical Nutrition · doi:10.1093/ajcn/71.2.621s · Cited by 1,176
Sirtuin 2 Inhibitors Rescue α-Synuclein-Mediated Toxicity in Models of Parkinson's Disease
Outeiro, T. F., Kontopoulos, E., Altmann, S. M., Kufareva, I., Strathearn, K. E., Amore, A. M., Volk, C. B., Maxwell, M. M., Rochet, J., McLean, P. J., et al. (2007) · Science · doi:10.1126/science.1143780 · Cited by 1,088
Selective neuronal vulnerability to oxidative stress in the brain
Wang, X. (2010) · Frontiers in Aging Neuroscience · doi:10.3389/fnagi.2010.00012 · Cited by 1,043
Alzheimer’s Disease Risk Gene CD33 Inhibits Microglial Uptake of Amyloid Beta
Griciuc, A., Serrano-Pozo, A., Parrado, A. R., Lesinski, A. N., Asselin, C. N., Mullin, K., Hooli, B., Choi, S. H., Hyman, B. T., & Tanzi, R. E. (2013) · Neuron · doi:10.1016/j.neuron.2013.04.014 · Cited by 1,004
Synaptic AMPA receptor plasticity and behavior
Kessels, H. W., & Malinow, R. (2009) · Neuron · doi:10.1016/j.neuron.2009.01.015 · Cited by 993
TREM2-mediated early microglial response limits diffusion and toxicity of amyloid plaques
Wang, Y., Ulland, T. K., Ulrich, J. D., Song, W., Tzaferis, J. A., Hole, J. T., Yuan, P., Mahan, T. E., Shi, Y., Gilfillan, S., et al. (2016) · Journal of Experimental Medicine · doi:10.1084/jem.20151948 · Cited by 840
Yuan, P., Condello, C., Keene, C. D., Wang, Y., Bird, T. D., Paul, S. M., Luo, W., Colonna, M., Baddeley, D., & Grutzendler, J. (2016) · Neuron · doi:10.1016/j.neuron.2016.05.003 · Cited by 817
Discovery of drug mode of action and drug repositioning from transcriptional responses
Iorio, F., Bosotti, R., Scacheri, E., Belcastro, V., Mithbaokar, P., Ferriero, R., Murino, L., Tagliaferri, R., Brunetti-Pierri, N., Isacchi, A., et al. (2010) · Proceedings of the National Academy of Sciences · doi:10.1073/pnas.1000138107 · Cited by 816
Thirty years of Alzheimer's disease genetics: the implications of systematic meta-analyses
Bertram, L., & Tanzi, R. E. (2008) · Nature Reviews Neuroscience · doi:10.1038/nrn2494 · Cited by 747
Co-expression of multiple transgenes in mouse CNS: a comparison of strategies
Jankowsky, J. L., Slunt, H. H., Ratovitski, T., Jenkins, N. A., Copeland, N. G., & Borchelt, D. R. (2001) · Biomolecular Engineering · doi:10.1016/s1389-0344(01)00067-3 · Cited by 746
Microglia constitute a barrier that prevents neurotoxic protofibrillar Aβ42 hotspots around plaques
Condello, C., Yuan, P., Schain, A., & Grutzendler, J. (2015) · Nature Communications · doi:10.1038/ncomms7176 · Cited by 718
Jay, T. R., Miller, C. M., Cheng, P. J., Graham, L. C., Bemiller, S., Broihier, M. L., Xu, G., Margevicius, D., Karlo, J. C., Sousa, G. L., et al. (2015) · Journal of Experimental Medicine · doi:10.1084/jem.20142322 · Cited by 682 · cited 11×
“Thus, the effect of a decreased Tyrobp expression on the stoichiometry of TAU phosphorylation appeared to be different in the presence or absence of APP/PSEN1 mutations leading to amyloid deposition.”
BackgroundInfluentialCD33 Alzheimer's disease locus: altered monocyte function and amyloid biology
Initiative, T. A. D. N., Bradshaw, E. M., Chibnik, L. B., Keenan, B. T., Ottoboni, L., Raj, T., Tang, A., Rosenkrantz, L. L., Imboywa, S., Lee, M., et al. (2013) · Nature Neuroscience · doi:10.1038/nn.3435 · Cited by 570
Bertram, L., Lange, C., Mullin, K., Parkinson, M., Hsiao, M., Hogan, M. F., Schjeide, B. M. M., Hooli, B., DiVito, J., Ionita, I., et al. (2008) · The American Journal of Human Genetics · doi:10.1016/j.ajhg.2008.10.008 · Cited by 511
A neuromodulatory role of interleukin-1β in the hippocampus
Schneider, H., Pitossi, F., Balschun, D., Wagner, A., del Rey, A., & Besedovsky, H. O. (1998) · Proceedings of the National Academy of Sciences · doi:10.1073/pnas.95.13.7778 · Cited by 498
Loss-of-function mutations in TYROBP (DAP12) result in a presenile dementia with bone cysts
Paloneva, J., Kestilä, M., Wu, J., Salminen, A., Böhling, T., Ruotsalainen, V., Hakola, P., Bakker, A. B. H., Phillips, J. H., Pekkarinen, P., et al. (2000) · Nature Genetics · doi:10.1038/77153 · Cited by 460
Oxidative stress in Alzheimer disease
Gella, A., & Durany, N. (2009) · Cell Adhesion & Migration · doi:10.4161/cam.3.1.7402 · Cited by 459
Disease Progression-Dependent Effects of TREM2 Deficiency in a Mouse Model of Alzheimer's Disease
Jay, T. R., Hirsch, A. M., Broihier, M. L., Miller, C. M., Neilson, L. E., Ransohoff, R. M., Lamb, B. T., & Landreth, G. E. (2017) · The Journal of Neuroscience · doi:10.1523/jneurosci.2110-16.2016 · Cited by 457
Gowrishankar, S., Yuan, P., Wu, Y., Schrag, M., Paradise, S., Grutzendler, J., De Camilli, P., & Ferguson, S. M. (2015) · Proceedings of the National Academy of Sciences · doi:10.1073/pnas.1510329112 · Cited by 406
Wakselman, S., Béchade, C., Roumier, A., Bernard, D., Triller, A., & Bessis, A. (2008) · The Journal of Neuroscience · doi:10.1523/jneurosci.1006-08.2008 · Cited by 351
Late-associativity, synaptic tagging, and the role of dopamine during LTP and LTD
Sajikumar, S. (2004) · Neurobiology of Learning and Memory · doi:10.1016/j.nlm.2004.03.003 · Cited by 345
SIRT2 inhibition achieves neuroprotection by decreasing sterol biosynthesis
Luthi‐Carter, R., Taylor, D. M., Pallos, J., Lambert, E., Amore, A. M., Parker, J. A., Moffitt, H., Smith, D. L., Runne, H., Gökçe, Ö., et al. (2010) · Proceedings of the National Academy of Sciences · doi:10.1073/pnas.1002924107 · Cited by 340
Tomic, J. L., Pensalfini, A., Head, E., & Glabe, C. G. (2009) · Neurobiology of Disease · doi:10.1016/j.nbd.2009.05.024 · Cited by 336
Self-citationJiang, T., Tan, L., Zhu, X.-C., Zhang, Q.-Q., Cao, L., Tan, M.-S., Gu, L.-Z., Wang, H.-F., Ding, Z.-Z., Zhang, Y.-D., et al. (2014) · Neuropsychopharmacology · doi:10.1038/npp.2014.164 · Cited by 320
Monoclonal antibodies that target pathological assemblies of Aβ
Lambert, M. P., Velasco, P. T., Chang, L., Viola, K. L., Fernandez, S., Lacor, P. N., Khuon, D., Gong, Y., Bigio, E. H., Shaw, P., et al. (2007) · Journal of Neurochemistry · doi:10.1111/j.1471-4159.2006.04157.x · Cited by 314
Self-citationWang, M., Roussos, P., McKenzie, A., Zhou, X., Kajiwara, Y., Brennand, K. J., De Luca, G. C., Crary, J. F., Casaccia, P., Buxbaum, J. D., et al. (2016) · Genome Medicine · doi:10.1186/s13073-016-0355-3 · Cited by 314
Self-citationMisonou, H., Morishima-Kawashima, M., & Ihara, Y. (2000) · Biochemistry · doi:10.1021/bi000169p · Cited by 304
Increased plaque burden in brains of APP mutant MnSOD heterozygous knockout mice
Li, F., Calingasan, N. Y., Yu, F., Mauck, W. M., Toidze, M., Almeida, C. G., Takahashi, R. H., Carlson, G. A., Beal, M. F., Lin, M. T. S., et al. (2004) · Journal of Neurochemistry · doi:10.1111/j.1471-4159.2004.02455.x · Cited by 277
Inflammatory components in human Alzheimer’s disease and after active amyloid-β42 immunization
Zotova, E., Bharambe, V., Cheaveau, M., Morgan, W., Holmes, C., Harris, S., Neal, J. W., Love, S., Nicoll, J. A. R., & Boche, D. (2013) · Brain · doi:10.1093/brain/awt210 · Cited by 272
DAP12-deficient mice fail to develop autoimmunity due to impaired antigen priming.
Bakker, A. B., Hoek, R., Cerwenka, A., Blom, B., Lucian, L., McNeil, T., Murray, R., Phillips, L., Sedgwick, J., & Lanier, L. (2000) · Immunity · doi:10.1016/s1074-7613(00)00034-0 · Cited by 269
Ca2+ Buffer Saturation Underlies Paired Pulse Facilitation in Calbindin-D28k-Containing Terminals
Blatow, M., Caputi, A., Burnashev, N., Monyer, H., & Rozov, A. V. (2003) · Neuron · doi:10.1016/s0896-6273(03)00196-x · Cited by 267
Benarroch, E. E. (2013) · Neurology · doi:10.1212/wnl.0b013e3182a4a577 · Cited by 232
A Serum Protein–Based Algorithm for the Detection of Alzheimer Disease
O’Bryant, S. E. (2010) · Archives of Neurology · doi:10.1001/archneurol.2010.215 · Cited by 230
AMPA receptor downscaling at the onset of Alzheimer's disease pathology in double knockin mice
Chang, E. H., Savage, M. J., Flood, D. G., Thomas, J. M., Levy, R. B., Mahadomrongkul, V., Shirao, T., Aoki, C., & Huerta, P. T. (2006) · Proceedings of the National Academy of Sciences · doi:10.1073/pnas.0507313103 · Cited by 225
Pedrós, I., Petrov, D., Allgaier, M., Sureda, F. X., Barroso, E., Beas‐Zárate, C., Auladell, C., Pallàs, M., Vázquez‐Carrera, M., Casadesús, G., et al. (2014) · Biochimica et Biophysica Acta (BBA) - Molecular Basis of Disease · doi:10.1016/j.bbadis.2014.05.025 · Cited by 211
Kiddle, S. J., Sattlecker, M., Proitsi, P., Simmons, A., Westman, E., Bazenet, C. E., Nelson, S. K., Williams, S., Hodges, A., Johnston, C., et al. (2013) · Journal of Alzheimer s Disease · doi:10.3233/jad-130380 · Cited by 190
TREM2 modifies microglial phenotype and provides neuroprotection in P301S tau transgenic mice
Jiang, T., Zhang, Y.-D., Chen, Q., Gao, Q., Zhu, X.-C., Zhou, J.-S., Shi, J.-Q., Lu, H., Tan, L., & Yu, J.-T. (2016) · Neuropharmacology · doi:10.1016/j.neuropharm.2016.01.028 · Cited by 176
Akt activity in Alzheimer’s disease and other neurodegenerative disorders
Rickle, A., Bogdanović, N., Volkmann, I., Winblad, B. G., Ravid, R., & Cowburn, R. F. (2004) · Neuroreport · doi:10.1097/00001756-200404290-00005 · Cited by 166
CD33 modulates TREM2: convergence of Alzheimer loci
Chan, G., White, C. C., Winn, P. A., Cimpean, M., Replogle, J. M., Glick, L. R., Cuerdon, N. E., Ryan, K. J., Johnson, K. A., Schneider, J. A., et al. (2015) · Nature Neuroscience · doi:10.1038/nn.4126 · Cited by 162
Quaternary Structure Defines a Large Class of Amyloid-β Oligomers Neutralized by Sequestration
Liu, P., Reed, M. N., Kotilinek, L., Grant, M. K. O., Forster, C. L., Qiang, W., Shapiro, S. L., Reichl, J. H., Chiang, A. C. A., Jankowsky, J. L., et al. (2015) · Cell Reports · doi:10.1016/j.celrep.2015.05.021 · Cited by 148
Prenatal activation of microglia induces delayed impairment of glutamatergic synaptic function
Roumier, A., Pascual, O., Béchade, C., Wakselman, S., Poncer, J.-C., Réal, E., Triller, A., & Bessis, A. (2008) · PLoS ONE · doi:10.1371/journal.pone.0002595 · Cited by 146
Marchetti, C., & Marie, H. (2011) · Reviews in the Neurosciences · doi:10.1515/rns.2011.035 · Cited by 141
Li, X., Long, J., He, T., Belshaw, R. D., & Scott, J. (2015) · Scientific Reports · doi:10.1038/srep12393 · Cited by 141
Arisi, I., D’Onofrio, M., Brandi, R., Felsani, A., Capsoni, S., Drovandi, G., Felici, G., Weitschek, E., Bertolazzi, P., & Cattaneo, A. (2011) · Journal of Alzheimer s Disease · doi:10.3233/jad-2011-101881 · Cited by 139
A key role for TGF-β1 in hippocampal synaptic plasticity and memory
Caraci, F., Gulisano, W., Guida, C. A., Impellizzeri, A. A. R., Drago, F., Puzzo, D., & Palmeri, A. (2015) · Scientific Reports · doi:10.1038/srep11252 · Cited by 133
Missense variant in TREML2 protects against Alzheimer's disease
Benítez, B. A., Jin, S. C., Guerreiro, R. J., Graham, R., Lord, J., Harold, D. H., Sims, R., Lambert, J., Gibbs, J. R., Brás, J., et al. (2013) · Neurobiology of Aging · doi:10.1016/j.neurobiolaging.2013.12.010 · Cited by 126
Jiang, T., Tan, L., Zhu, X.-C., Zhou, J.-S., Cao, L., Tan, M.-S., Wang, H.-F., Chen, Q., Zhang, Y.-D., & Yu, J.-T. (2015) · Neurobiology of Aging · doi:10.1016/j.neurobiolaging.2015.08.019 · Cited by 111
Neuroprotective Effect of TREM-2 in Aging and Alzheimer’s Disease Model
Raha, A. A., Henderson, J. W., Stott, S., Vuono, R., Foscarin, S., Friedland, R. P., Zaman, S. H., & Raha‐Chowdhury, R. (2016) · Journal of Alzheimer s Disease · doi:10.3233/jad-160663 · Cited by 109
Barnes maze, a useful task to assess spatial reference memory in the mice
Sunyer, B., Patil, S., Höger, H., & Luber, G. (2007) · Protocol Exchange · doi:10.1038/nprot.2007.390 · Cited by 106
The AAA+ ATPase Thorase Regulates AMPA Receptor-Dependent Synaptic Plasticity and Behavior
Zhang, J., Wang, Y., Chi, Z., Keuss, M. J., Pai, Y.-M. E., Kang, H. C., Shin, J., Bugayenko, A., Wang, H., Xiong, Y., et al. (2011) · Cell · doi:10.1016/j.cell.2011.03.016 · Cited by 104
TYROBP genetic variants in early-onset Alzheimer's disease
Pottier, C., Ravenscroft, T. A., Brown, P. H., Finch, N. A., Baker, M., Parsons, M., Asmann, Y. W., Ren, Y., Christopher, E., Levitch, D., et al. (2016) · Neurobiology of Aging · doi:10.1016/j.neurobiolaging.2016.07.028 · Cited by 94
Walker, D. G., Whetzel, A. M., Serrano, G., Sue, L. I., Beach, T. G., & Lue, L.-F. (2015) · Neurobiology of Aging · doi:10.1016/j.neurobiolaging.2014.09.023 · Cited by 93
Yang, W., Zhou, X., Zimmermann, H. R., Cavener, D. R., Klann, E., & Ma, T. (2016) · Neurobiology of Aging · doi:10.1016/j.neurobiolaging.2016.02.005 · Cited by 88
Fanutza, T., Prete, D. D., Ford, M. J., Castillo, P. E., & D'adamio, L. (2015) · eLife · doi:10.7554/elife.09743 · Cited by 87
Self-citationInitiative, A. D. N., Takahashi, H., Klein, Z. A., Bhagat, S. M., Kaufman, A. C., Kostylev, M. A., Ikezu, T., & Strittmatter, S. M. (2017) · Acta Neuropathologica · doi:10.1007/s00401-017-1668-z · Cited by 84
Microglia as Dynamic and Essential Components of the Amyloid Hypothesis
Gandy, S., & Heppner, F. L. (2013) · Neuron · doi:10.1016/j.neuron.2013.05.007 · Cited by 74
Self-citationGal, J., Bang, Y., & Choi, H. J. (2012) · Neurochemistry International · doi:10.1016/j.neuint.2012.07.010 · Cited by 68
Mueller, C., Zhou, W., VanMeter, A., Heiby, M., Magaki, S., Ross, M. M., Espina, V. A., Schrag, M., Dickson, C., Liotta, L. A., et al. (2010) · Journal of Alzheimer s Disease · doi:10.3233/jad-2010-1303 · Cited by 63
Cathepsin D gene and the risk of Alzheimer's disease: A population-based study and meta-analysis
Schuur, M., Ikram, M. A., Swieten, J. C. V., Isaacs, A. J., Vergeer, J. M., Albert Hofman, D., Oostra, B. A., Breteler, M. M. B., & van Duijn, C. M. (2009) · Neurobiology of Aging · doi:10.1016/j.neurobiolaging.2009.10.011 · Cited by 61
Effective anti-Alzheimer Aβ therapy involves depletion of specific Aβ oligomer subtypes
Knight, E. M., Kim, S. H., Kottwitz, J., Hatami, A., Albay, R., Suzuki, A. Z., Lublin, A. L., Alberini, C. M., Klein, W. L., Szabo, P., et al. (2016) · Neurology Neuroimmunology & Neuroinflammation · doi:10.1212/nxi.0000000000000237 · Cited by 47
Self-citationJiang, T., Wan, Y., Zhang, Y.-D., Zhou, J.-S., Gao, Q., Zhu, X.-C., Shi, J.-Q., Lu, H., Tan, L., & Yu, J.-T. (2017) · Molecular Neurobiology · doi:10.1007/s12035-016-9704-x · Cited by 46
Davidson, Y. (2006) · Journal of Neurology, Neurosurgery & Psychiatry · doi:10.1136/jnnp.2005.063917 · Cited by 45
The SIRT2 Polymorphism rs10410544 and Risk of Alzheimer’s Disease: A Meta-analysis
Wei, W., Xu, X., Li, H., Zhang, Y., Han, D., Wang, Y., Yan, W., Wang, X., Zhang, J., Liu, N., et al. (2014) · NeuroMolecular Medicine · doi:10.1007/s12017-014-8291-0 · Cited by 29
Knight, E. M., Ruiz, H. H., Kim, S. H., Harte, J. C., Hsieh, W., Glabe, C. G., Klein, W. L., Attie, A., Buettner, C., Ehrlich, M. E., et al. (2016) · Acta Neuropathologica Communications · doi:10.1186/s40478-016-0282-y · Cited by 26
Self-citationElucidating Molecular Mass and Shape of a Neurotoxic Aβ Oligomer
Sebollela, A. S., Mustata, G.-M., Luo, K., Velasco, P. T., Viola, K. L., Cline, E. N., Shekhawat, G. S., Wilcox, K. C., Dravid, V. P., & Klein, W. L. (2014) · ACS Chemical Neuroscience · doi:10.1021/cn500156r · Cited by 25
Self-citationLiu, S., Zhao, H., Wang, J., Huang, T., Tian, H., Yao, L., Tao, H., Chen, Z., Wang, C., Sheng, S., et al. (2015) · CNS Neuroscience & Therapeutics · doi:10.1111/cns.12430 · Cited by 21
Readhead, B., Haure‐Mirande, J., Zhang, B., Haroutunian, V. H., Gandy, S., Schadt, E. E., Dudley, J. T., & Ehrlich, M. E. (2015) · Molecular Psychiatry · doi:10.1038/mp.2015.167 · Cited by 15
Self-citationSayad, A., Noruzinia, M., Zamani, M., Harirchian, M. H., & Kazemnejad, A. (2013) · Dementia and Geriatric Cognitive Disorders · doi:10.1159/000347128 · Cited by 13
Cited by
Sorted by citations
Applications of machine learning to diagnosis and treatment of neurodegenerative diseases
Myszczynska, M. A., Ojamies, P. N., Lacoste, A. M. B., Neil, D., Saffari, A., Mead, R., Hautbergue, G. M., Holbrook, J. D., & Ferraiuolo, L. (2020) · Nature Reviews Neurology · doi:10.1038/s41582-020-0377-8 · Cited by 595
Inflammation: the link between comorbidities, genetics, and Alzheimer’s disease
Newcombe, E. A., Camats-Perna, J., Silva, M. L., Valmas, N., Huat, T. J., & Medeiros, R. (2018) · Journal of Neuroinflammation · doi:10.1186/s12974-018-1313-3 · Cited by 532
TREM2 in Neurodegenerative Diseases
Jay, T. R., von Saucken, V. E., & Landreth, G. E. (2017) · Molecular Neurodegeneration · doi:10.1186/s13024-017-0197-5 · Cited by 427
Tau and neuroinflammation: what impact for Alzheimer's disease and tauopathies?
Laurent, C., Buée, L., & Blum, D. (2018) · Biomedical Journal · doi:10.1016/j.bj.2018.01.003 · Cited by 348
The identity and function of microglia in neurodegeneration
Song, W. M., & Colonna, M. (2018) · Nature Immunology · doi:10.1038/s41590-018-0212-1 · Cited by 308
Metadata
- Authors
- Haure-Mirande, J.-V., Audrain, M., Fanutza, T., Kim, S. H., Klein, W. L., Glabe, C., Readhead, B., Dudley, J. T., Blitzer, R. D., Wang, M., Zhang, B., Schadt, E. E., Gandy, S., & Ehrlich, M. E.
- Affiliations
- Icahn School of Medicine at Mount Sinai (US)
- Northwestern University (US)
- University of California, Irvine (US)
- Corresponding author
- Gandy, Sam
- Ehrlich, Michelle E.
- ORCID
- Venue
- Acta Neuropathologica
- Published
- 2017-06-13
- Volume
- 134
- Issue
- 5
- Pages
- 769-788
- ISSN
- 0001-6322 (ISSN-L)
- 1432-0533
- PMC
- PMC5645450
- OpenAlex
- W2625865615
- Cited by
- 127
- References
- 88
- Citations by year
- 2026: 7 · 2025: 10 · 2024: 22 · 2023: 11 · 2022: 12 · 2021: 15 · 2020: 22 · 2019: 11 · 2018: 14 · 2017: 3
- FWCI
- 6.81
- Type
- journal article
- Language
- en
- Open access
- hybrid
- doi.org
- Locations
- Acta Neuropathologica (publishedVersion, cc-by)
- Europe PMC (PubMed Central) (publishedVersion, cc-by)
- PubMed Central (publishedVersion, cc-by)
- PubMed (publishedVersion)
- eScholarship (California Digital Library) (submittedVersion, cc-by)
- Funders
- National Institute on Aging (AG046170)
- Louis B. Mayer foundation
- Cure Alzheimer's Fund
- BrightFocus Foundation (A2016482F)
- Sarah and Gideon Gartner Foundation
- Georgianne and Dr Reza Khatib Foundation
- Werber Family Foundation
- Jennifer and Scott Moskowitz Foundation
- Jane Martin and Stuart Katz Foundation
- Topics
- Life Sciences › Neuroscience › Neurology › Neuroinflammation and Neurodegeneration Mechanisms
- Life Sciences › Neuroscience › Cellular and Molecular Neuroscience › Alzheimer's disease research and treatments
- Life Sciences › Neuroscience › Neurology › Neurological Disease Mechanisms and Treatments
- Keywords
- TYROBP, DAP12, TREM2, CD33, CR3, Alzheimer's disease, microglia, neuroinflammation, amyloid-beta, tau phosphorylation, neuritic dystrophy, learning deficits, neuroprotection, gene knockout, early Alzheimer's disease, cerebral amyloidosis
- MeSH terms
- Alzheimer Disease, Animals, Brain, Disease Models, Animal, Mutation, Phosphorylation, tau Proteins, Microglia, Mice, Knockout, Maze Learning, Adaptor Proteins, Signal Transducing, Mice
About these checks
Registry, retraction, Cites and statistics results are computed, not judged, with one exception: a printed reference that no index lists is read once by a model before it counts as a citation error. Claims are extracted by a model and kept only when their quote appears verbatim in the text; each cited source is then checked, with a model’s help, for whether it says what the claim relies on. Those verdicts can be wrong — read the claim’s quote and the cited source before relying on one.
Statistics and arithmetic are recomputed, not judged.
Confidence bands are shown only for fields calibrated on our annotated test set. None is calibrated yet, so no band is shown.
What counts as a claim ›How we measure confidence ›How we check this ›
Are you an author, or do you see a problem with this page? Request a review
