

Rate of force development: physiological and methodological considerations
Open accessThe DOI matches its Crossref record; 204 of the 204 references it cites were found in a registry or an index; 49 of the 274 sources its claims cite were checked for support.
Abstract
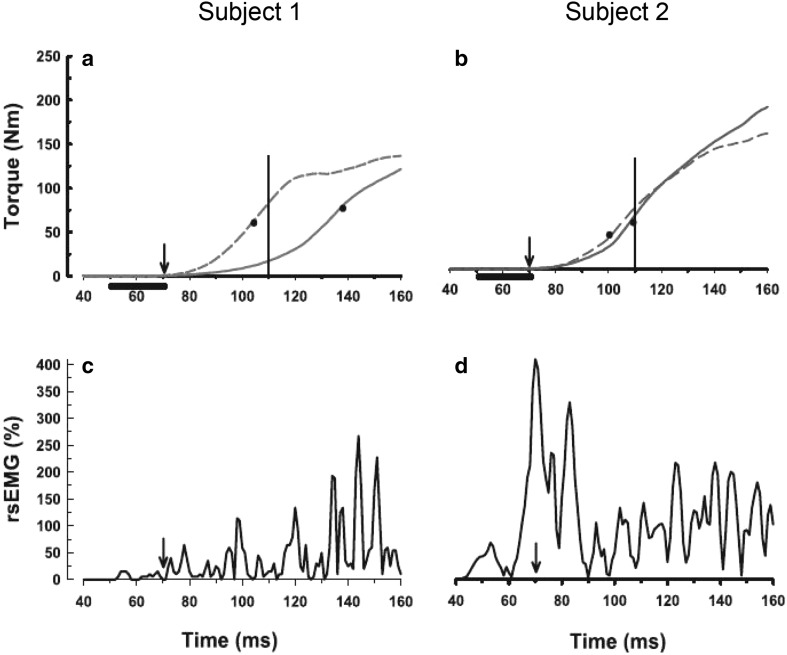
The evaluation of rate of force development during rapid contractions has recently become quite popular for characterising explosive strength of athletes, elderly individuals and patients. The main aims of this narrative review are to describe the neuromuscular determinants of rate of force development and to discuss various methodological considerations inherent to its evaluation for research and clinical purposes. Rate of force development (1) seems to be mainly determined by the capacity to produce maximal voluntary activation in the early phase of an explosive contraction (first 50-75 ms), particularly as a result of increased motor unit discharge rate; (2) can be improved by both explosive-type and heavy-resistance strength training in different subject populations, mainly through an improvement in rapid muscle activation; (3) is quite difficult to evaluate in a valid and reliable way. Therefore, we provide evidence-based practical recommendations for rational quantification of rate of force development in both laboratory and clinical settings.
Overview
CoChat Summary
TL;DR
This narrative review argues that early-phase rate of force development (RFD) is driven mainly by rapid neural activation, especially motor unit discharge rate in the first 50–75 ms. It also emphasizes that RFD is useful but methodologically difficult to measure reliably, so careful standardized procedures are essential.
Key findings
- RFD is “mainly determined” by maximal voluntary activation in the early phase of an explosive contraction, especially the first 50–75 ms, largely via increased motor unit discharge rate.
- Training can improve RFD through both explosive-type and heavy-resistance strength training, mainly by improving rapid muscle activation; one example given is 33% higher RFD after 6 weeks of lower-limb strength training, with 80–100% increases in EMG activity.
- In older adults, RFD and motor unit discharge rate are reduced: in one cited comparison, adults aged 71–84 years showed 48% slower RFD and 27% lower MU discharge rate than young adults (~20 years).
- The review reports reliability challenges: RFD is less reliable than MVC force, with within-subject CVs reported as 12.8–16.6% for force over 0–50 ms, 4.5–5.3% for 0–100 ms, and 4.5–5.1% for 0–150 ms.
Methods
- Narrative review of the physiological determinants of RFD and methodological issues in its assessment; no original sample was studied.
- The paper synthesizes prior experimental, training, aging, and modeling studies across young adults, older adults, athletes, and clinical populations as cited in the text.
- Main analysis is qualitative synthesis of literature, with practical recommendations for measuring isometric RFD and interpreting early- and late-phase force-time measures.
Limitations
- The paper states that RFD is “quite difficult to evaluate in a valid and reliable way,” especially in the early phase of contraction, and that methodological rigor is required.
- It also notes that the review is focused on isometric RFD; dynamic contractions are discussed only as an additional consideration, so the evidence base is narrower than all possible RFD contexts.
- Evident from the text: this is a narrative review, so conclusions are not based on a systematic meta-analysis or new primary data (not stated as a limitation by the authors, but evident from the article type).
Model-written summary. Check it against the paper before relying on it.
Integrity signals
Registry
Cites
Statistics
Figures



Verification
Claims the paper makes
41 Valid · 5 Not valid · 124 Not checked · 73 Own results and interpretations
The cited sources support only part of this claim — read each source’s verdict below.
In the paper
“Rate of force development (1) seems to be mainly determined by the capacity to produce maximal voluntary activation in the early phase of an explosive contraction (first 50–75 ms), particularly as a result of increased motor unit discharge rate;”
- Also stated in: § Neural determinants · boosted
“Together these experimental and simulated studies underscore the critical role of maximal MU discharge rate on the ability to rapidly develop force at the onset of a ballistic voluntary contraction.”
§ Rate of force development: physiological and methodological considerations > Abstract
What the sources say
- Partly supportedcites Desmedt and Godaux 1977 sourceExperimental — accuracy not yet measured
Split into 2 atoms — 1 confirmed, 1 partially supported, 0 disputed, 0 misattributed, 0 unverifiable. Expand the claim to see per-atom verdicts.
- Partly supportedcites Van Cutsem et al. 1998 sourceExperimental — accuracy not yet measured
Split into 2 atoms — 0 confirmed, 2 partially supported, 0 disputed, 0 misattributed, 0 unverifiable. Expand the claim to see per-atom verdicts.
- Partly supportedcites Duchateau and Baudry 2014 sourceExperimental — accuracy not yet measured
Split into 2 atoms — 1 confirmed, 1 partially supported, 0 disputed, 0 misattributed, 0 unverifiable. Expand the claim to see per-atom verdicts.
boostedstates a possible cause- Asserted: passes — The authors put it forward as true.
- Checkable: passes — It can be checked against evidence.
- Load-bearing: passes — The paper’s conclusions depend on it.
- Based: passes — The paper gives a reason why it holds.
- Also stated in: § Neural determinants · boosted
The sources with a verdict support this claim; the rest weren’t checked yet, have no full text we could read, or their verdicts aren’t rated yet.
In the paper
“potentially governed by different physiological mechanisms (see, e.g., Andersen and Aagaard 2006; Van Cutsem et al. 1998)”
§ Rate of force development: physiological and methodological considerations > Introduction
What the sources say
- Not checked — no full text of the sourcecites Andersen and Aagaard 2006 source
- Supportedcites Van Cutsem et al. 1998 source
The Results (page unavailable) report changes in both maximal voluntary contraction torque and the rate of tension development after dynamic training. The Discussion (page unavailable) links increased strength to greater EMG activity and links faster ballistic contractions specifically to earlier motor-unit activation and higher firing frequencies. This supports the hedged claim that the two measures may depend on different physiological mechanisms. (LLM, conf=0.86)
hedgedstates a possible cause- Asserted: passes — The authors put it forward as true.
- Checkable: passes — It can be checked against evidence.
- Load-bearing: passes — The paper’s conclusions depend on it.
- Based: passes — The paper gives a reason why it holds.
The cited sources support only part of this claim — read each source’s verdict below.
In the paper
“more sensitive to detect acute and chronic changes in neuromuscular function (see, e.g., Angelozzi et al. 2012; Crameri et al. 2007; Jenkins et al. 2014b; Penailillo et al. 2015)”
§ Rate of force development: physiological and methodological considerations > Introduction
What the sources say
- Could not verifycites Angelozzi et al. 2012 sourceExperimental — accuracy not yet measured
Two searches of Angelozzi et al. (2012) returned no full-text snippets, so its support for the comparison could not be checked directly. A systematic review by Lomborg and colleagues says previous studies argued that rate of force development is more sensitive to acute or chronic neuromuscular adaptations than maximal force (score 0.506), but the retrieved passage does not identify Angelozzi et al. as one of those studies. The review is therefore not sufficient to confirm this attribution, and it is not evidence of misattribution. (LLM, conf=0.62)
- Partly supportedcites Crameri et al. 2007 sourceExperimental — accuracy not yet measured
The Force data and Discussion report that rapid force characteristics declined more than maximal contraction strength after eccentric exercise, supporting greater sensitivity to acute changes in this setting. The paper does not establish that rate of force development is more sensitive to chronic changes in neuromuscular function. Page numbers were not supplied for these passages. (LLM, conf=0.88)
- Not checked — no full text of the sourcecites Jenkins et al. 2014b source
plainstates an association- Asserted: passes — The authors put it forward as true.
- Checkable: passes — It can be checked against evidence.
- Load-bearing: passes — The paper’s conclusions depend on it.
- Based: passes — The paper gives a reason why it holds.
- Could not verify
The cited sources support only part of this claim — read each source’s verdict below.
In the paper
“During such rapid actions, the activated MUs discharge only a few times (~1–6) (Van Cutsem and Duchateau 2005; Van Cutsem et al. 1998).”
§ Rate of force development: physiological and methodological considerations > Physiological considerations: the underlying mechanisms > Neural determinants
What the sources say
- Not checked — no full text of the sourcecites Van Cutsem and Duchateau 2005 source
- Partly supportedcites Van Cutsem et al. 1998 sourceExperimental — accuracy not yet measured
The Results section says that few motor units fired more than four times before training during ballistic contractions, supporting the point that they discharge only a few times. It does not establish the stated approximate range of 1–6 discharges or apply that count to the post-training contractions. (LLM, conf=0.84)
plain- Asserted: passes — The authors put it forward as true.
- Checkable: passes — It can be checked against evidence.
- Load-bearing: passes — The paper’s conclusions depend on it.
- Based: passes — The paper gives a reason why it holds.
The cited sources support only part of this claim — read each source’s verdict below.
In the paper
“as compared to pure maximal voluntary contraction (MVC) strength, RFD seems to be (1) better related to most performances of both sport-specific and functional daily tasks (see, e.g., Maffiuletti et al. 2010; Tillin et al. 2013a)”
§ Rate of force development: physiological and methodological considerations > Introduction
What the sources say
- Partly supportedcites Maffiuletti et al. 2010 sourceExperimental — accuracy not yet measured
The Results and Discussion report that, in patients after total knee arthroplasty, quadriceps RFD asymmetry correlated with self-reported daily knee function whereas MVC strength asymmetry did not. The paper does not establish that RFD is better related to most task performances, or address sport-specific performance; the claim extends beyond its findings. (LLM, conf=0.88)
- Not checked — no full text of the sourcecites Tillin et al. 2013a source
hedgedstates an association- Asserted: passes — The authors put it forward as true.
- Checkable: passes — It can be checked against evidence.
- Load-bearing: passes — The paper’s conclusions depend on it.
- Based: passes — The paper gives a reason why it holds.
- Partly supported
176 more claims · 27 with their cited sources checked
Create a free account to see all 243 claims and every source verdict.
- It may state two separate claims as one. 55
- Probably not a substantial claim. 9
Claims other papers make about this one
Each is checked against this paper’s own text: does it say what the citing paper says it does?
The cited source says what the claim attributes to it.
In the citing paper
“Adaptations to HVPT may have been attenuated by a lack of task-speci fi c practice to maximise rate of force development. 108”
From High-velocity power training has similar effects to traditional resistance training for functional performance in older adults: a systematic review (2023) · cites this paper as [108]
In the citing paper
“Prior to MVC assessment, subjects will complete two submaximal warm-up contractions at approximately 50% and 80% of perceived maximal effort, separated by 30 s of rest, to minimise variability and enhance measurement accuracy [28].”
From Ageing, Sex Differences, and REDs Risk in Endurance Runners: An Integrated Cross-Sectional Study Protocol (2026) · cites this paper as [28]
In the citing paper
“it is known that improvement in RFD is determined by neuromuscular adaptations, muscle size and tendon stiffness [134] and isometric efforts of 1–5 s have been suggested to generate such neuromuscular adaptations [17].”
From Effect of Strength Training Programs in Middle- and Long-Distance Runners’ Economy at Different Running Speeds: A Systematic Review with Meta-analysis (2024) · cites this paper as [134]
Citations
Cites
Calcium's Role in Mechanotransduction during Muscle Development
Benavides Damm, T., & Egli, M. (2014) · Cellular Physiology and Biochemistry · doi:10.1159/000356667 · Cited by 14,502
Biomechanics and motor control of human movement
(1990) · Choice Reviews Online · doi:10.5860/choice.28-2135 · Cited by 8,451
Biomechanics and Motor Control of Human Movement
Winter, D. A. (2009) · Wiley eBooks · doi:10.1002/9780470549148 · Cited by 6,066
Fiber Types in Mammalian Skeletal Muscles
Schiaffino, S., & Reggiani, C. (2011) · Physiological Reviews · doi:10.1152/physrev.00031.2010 · Cited by 3,022 · cited 1×
“Finally, type II fibres have a 200– 300 % greater Na+ channel density, and therefore might be better able to conduct high rates of excitatory potentials resulting from high discharge rates (Schiaffino and Reggiani 2011).”
BackgroundData on the distribution of fibre types in thirty-six human muscles
Johnson, M. A., Polgar, J., Weightman, D., & Appleton, D. (1973) · Journal of the Neurological Sciences · doi:10.1016/0022-510x(73)90023-3 · Cited by 2,200
Dynamic properties of mammalian skeletal muscles.
Close, R. I. (1972) · Physiological Reviews · doi:10.1152/physrev.1972.52.1.129 · Cited by 1,890 · cited 1×
“…II fibres having a greater total Ca2+ release per action potential (Baylor and Hollingworth 1988) and faster time constants of Ca2+ currents (e.g., Close 1972), as well as fast myosin, troponin and tropomyosin isoforms (Schiaffino and Reggiani 1996) and thus faster cross-bridge cycling rates…”
BackgroundAagaard, P., Simonsen, E. B., Andersen, J. L., Magnusson, P., & Dyhre-Poulsen, P. (2002) · Journal of Applied Physiology · doi:10.1152/japplphysiol.00283.2002 · Cited by 1,844
Self-citationMolecular diversity of myofibrillar proteins: gene regulation and functional significance
Schiaffino, S., & Reggiani, C. (1996) · Physiological Reviews · doi:10.1152/physrev.1996.76.2.371 · Cited by 1,545
Folland, J. P., & Williams, A. G. (2007) · Sports Medicine · doi:10.2165/00007256-200737020-00004 · Cited by 1,347
Self-citationMechanisms of Anterior Cruciate Ligament Injury in Basketball: Video Analysis of 39 Cases
Krosshaug, T., Nakamae, A., Boden, B. P., Engebretsen, L., Smith, G., Slauterbeck, J. R., Hewett, T. E., & Bahr, R. (2007) · The American Journal of Sports Medicine · doi:10.1177/0363546506293899 · Cited by 1,212
Research works printed but not linked: 2
- Aagaard P (2010) Neural adaptations to resistance exercise. In: Cardinale M, Newton RU, Nosaka K (eds) Strength and conditioning: biological principles and practical applications. Wiley-Blackwell, New York, pp 105–124
- Andersen JL (2001) Muscle fibre type characteristics of the runner. In: Bangsbo J, Larsen HB (eds) Running & science in an interdisciplinary perspective. Munksgaard Publishing, Copenhagen, pp 49–65
Cited by
The importance of muscular strength: Training considerations
Suchomel, T. J., Nimphius, S., Bellon, C. R., & Stone, M. H. (2018) · Sports Medicine · doi:10.1007/s40279-018-0862-z · Cited by 940
“Although lower thresholds for MU recruitment may occur during ballistic-type movements due to the required RFD, the size principle appears to hold [36, 46].”
BackgroundAdaptations to Endurance and Strength Training
Hughes, D. C., Ellefsen, S., & Baar, K. (2018) · Cold Spring Harbor Perspectives in Medicine · doi:10.1101/cshperspect.a029769 · Cited by 548
Standardization and Methodological Considerations for the Isometric Midthigh Pull
Comfort, P., Dos'Santos, T., Beckham, G. K., Stone, M. H., Guppy, S. N., & Haff, G. G. (2019) · Strength & Conditioning Journal · doi:10.1519/ssc.0000000000000433 · Cited by 316
Buckthorpe, M. (2019) · Sports Medicine · doi:10.1007/s40279-019-01102-z · Cited by 242
Rodríguez‐Rosell, D., Pareja‐Blanco, F., Aagaard, P., & González‐Badillo, J. J. (2018) · Clinical Physiology and Functional Imaging · doi:10.1111/cpf.12495 · Cited by 216
Self-citation
Metadata
- Authors
- Maffiuletti, N. A., Aagaard, P., Blazevich, A. J., Folland, J., Tillin, N., & Duchateau, J.
- Affiliations
- Schulthess-Klinik (CH)
- University of Southern Denmark (DK)
- Edith Cowan University (AU)
- Loughborough University (GB)
- University of Roehampton (GB)
- Université Libre de Bruxelles (BE)
- Corresponding author
- Maffiuletti, Nicola A.
- Venue
- European Journal of Applied Physiology
- Published
- 2016-03-03
- Volume
- 116
- Issue
- 6
- Pages
- 1091-1116
- ISSN
- 0020-9376 (ISSN-L)
- 1439-6319
- 1439-6327
- PMC
- PMC4875063
- OpenAlex
- W2290888937
- Cited by
- 1,424
- References
- 204
- Citations by year
- 2026: 174 · 2025: 166 · 2024: 158 · 2023: 157 · 2022: 149 · 2021: 158 · 2020: 143 · 2019: 118 · 2018: 95 · 2017: 66 · 2016: 23
- FWCI
- 79.83
- Type
- journal article
- Language
- en
- Open access
- hybrid
- doi.org
- Locations
- European Journal of Applied Physiology (publishedVersion, cc-by)
- University of Southern Denmark Research Portal (University of Southern Denmark) (publishedVersion, other-oa)
- PubMed (publishedVersion)
- Europe PMC (PubMed Central) (submittedVersion, cc-by)
- PubMed Central (submittedVersion, cc-by)
- Australasian Journal of Paramedicine (submittedVersion)
- Dépôt institutionnel de l'Université libre de Bruxelles (Université Libre de Bruxelles) (submittedVersion, other-oa)
- Topics
- Health Sciences › Medicine › Orthopedics and Sports Medicine › Sports Performance and Training
- Health Sciences › Medicine › Orthopedics and Sports Medicine › Sports injuries and prevention
- Physical Sciences › Engineering › Biomedical Engineering › Muscle activation and electromyography studies
- Keywords
- rate of force development, explosive strength, maximal voluntary activation, motor unit discharge rate, resistance training, high-load resistance training, reliability and validity
- MeSH terms
- Animals, Electromyography, Exercise Test, Humans, Motor Neurons, Muscle Contraction, Synaptic Transmission, Neuromuscular Junction
About these checks
Registry, retraction, Cites and statistics results are computed, not judged, with one exception: a printed reference that no index lists is read once by a model before it counts as a citation error. Claims are extracted by a model and kept only when their quote appears verbatim in the text; each cited source is then checked, with a model’s help, for whether it says what the claim relies on. Those verdicts can be wrong — read the claim’s quote and the cited source before relying on one.
The claim verdicts this report counts are experimental: their accuracy is not yet measured.
A language model drew the claims from the paper on 2026-09-30, under version 3 of the claim definition (model deepseek-v4.1-flash, prompt extract-v3).
A second model labelled each claim on 2026-09-30 (model jev-1.13-20260917, definition revision gold-guideline-v0.2).
Cited sources are checked with a language model’s help (gpt-6-sol).
Statistics and arithmetic are recomputed, not judged.
Confidence bands are shown only for fields calibrated on our annotated test set. None is calibrated yet, so no band is shown.
What counts as a claim ›How we measure confidence ›How we check this ›
Are you an author, or do you see a problem with this page? Request a review
How to cite
Cite CoChat for the checks on this page, and the paper for its own findings.
- This page
- CoChat. (2026). Citation check: Rate of force development: physiological and methodological considerations. https://app.cochat.ai/papers/10.1007/s00421-016-3346-6
- The paper
- Maffiuletti, N. A., Aagaard, P., Blazevich, A. J., Folland, J., Tillin, N., & Duchateau, J. (2016). Rate of force development: physiological and methodological considerations. European Journal of Applied Physiology. https://doi.org/10.1007/s00421-016-3346-6
Data sources
Bibliographic data: Semantic Scholar, OpenAlex, Crossref.
Contains information from the Semantic Scholar Academic Graph Datasets, made available under the ODC Attribution License (ODC-BY 1.0).
Semantic Scholar’s data is described in: Kinney, R., et al. (2023). The Semantic Scholar Open Data Platform. arXiv:2301.10140.
