

Estimating red fox density using non-invasive genetic sampling and spatial capture–recapture modelling
Open accessThe DOI matches its Crossref record; 75 of the 75 references it cites were found in a registry or an index.
Abstract
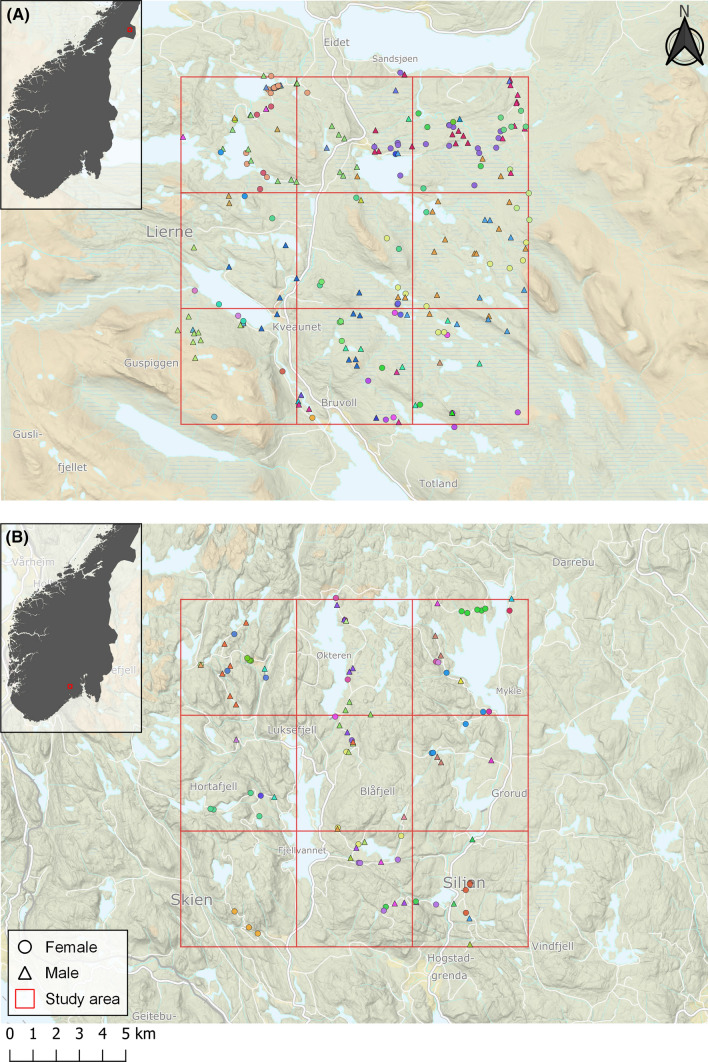
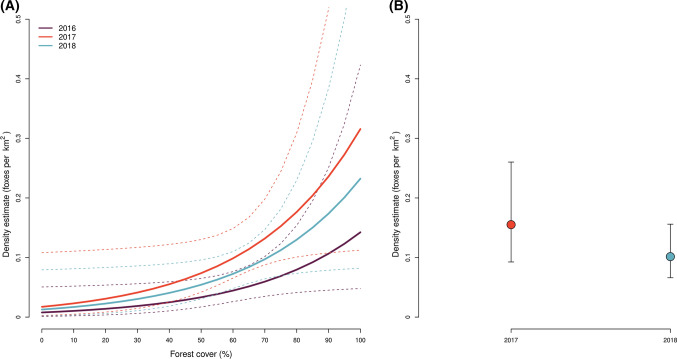
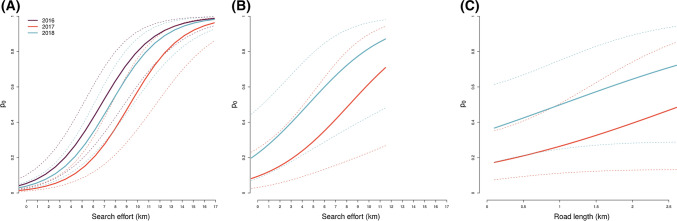
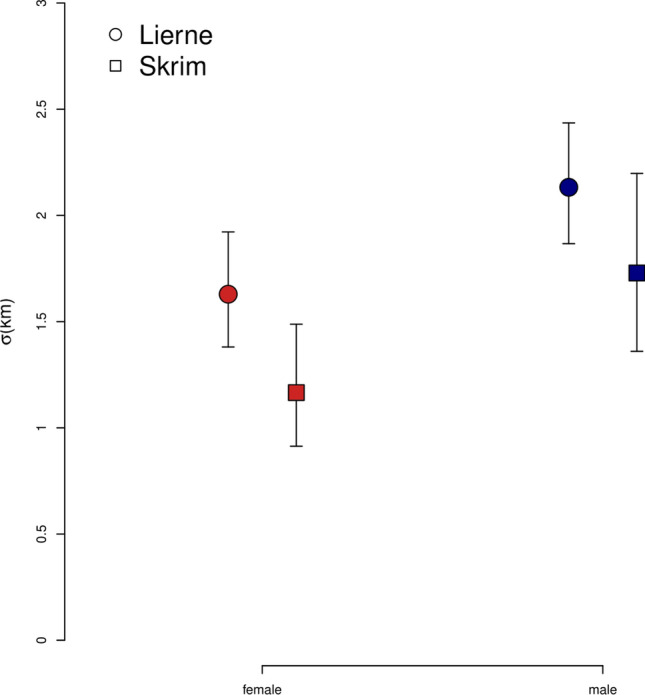
Spatial capture–recapture modelling (SCR) is a powerful tool for estimating density, population size, and space use of elusive animals. Here, we applied SCR modelling to non-invasive genetic sampling (NGS) data to estimate red fox (Vulpes vulpes) densities in two areas of boreal forest in central (2016–2018) and southern Norway (2017–2018). Estimated densities were overall lower in the central study area (mean = 0.04 foxes per km 2 in 2016, 0.10 in 2017, and 0.06 in 2018) compared to the southern study area (0.16 in 2017 and 0.09 in 2018). We found a positive effect of forest cover on density in the central, but not the southern study area. The absence of an effect in the southern area may reflect a paucity of evidence caused by low variation in forest cover. Estimated mean home-range size in the central study area was 45 km 2 [95%CI 34–60] for females and 88 km 2 [69–113] for males. Mean home-range sizes were smaller in the southern study area (26 km 2 [16–42] for females and 56 km 2 [35–91] for males). In both study areas, detection probability was session-dependent and affected by sampling effort. This study highlights how SCR modelling in combination with NGS can be used to efficiently monitor red fox populations, and simultaneously incorporate ecological factors and estimate their effects on population density and space use.
Overview
The claims and statistics of this paper haven’t been checked yet.
Free: it reads the open-access text and checks the first 5 claims that cite a source we can check. Create a free account to check every claim.
Integrity signals
Registry
Cites
Statistics
Figures
Verification
Claims the paper makes
The claims and statistics of this paper haven’t been checked yet.
Free: it reads the open-access text and checks the first 5 claims that cite a source we can check. Create a free account to check every claim.
Claims other papers make about this one
Each is checked against this paper’s own text: does it say what the citing paper says it does?
The source backs part of the claim, not all of it — or backs it for a different population, condition or comparison.
In the citing paper
“Average genotyping success (52.8%) was consistent with previous studies based on faecal DNA (e.g., 48%44, 58%45).”
From Nutritional ecology of a prototypical generalist predator, the red fox (Vulpes vulpes) (2024) · cites this paper as [44]
Experimental — accuracy not yet measuredIn the citing paper
“The red fox ( Vulpes vulpes ) is the most widespread and adaptable wild carnivore in the world (Linds ø et al., 2022; Kobryn et al., 2023), and can be found all over Europe (Delcourt et al., 2022), including Slovenia (Rataj et al., 2010), having adapted its activity level and behaviour to many different habitats (Gil-Fern ´ andez et al., 2020).”
From Exposure assessment of anticoagulant rodenticides in the liver of red foxes (Vulpes vulpes) in Slovenia (2024) · cites this paper as Linds ø et al., 2022
Self-check
Percentages, sums and reported differences re-computed from the paper’s own numbers.
The self-check needs the paper’s full text.
Citations
Cites
R: A Language and Environment for Statistical Computing
R Core Team (2025) · doi:10.32614/r.manuals · Cited by 352,181
Uninformative Parameters and Model Selection Using Akaike's Information Criterion
ARNOLD, T. W. (2010) · The Journal of Wildlife Management · doi:10.1111/j.1937-2817.2010.tb01236.x · Cited by 3,417
Reliable genotyping of samples with very low DNA quantities using PCR
Taberlet, P. (1996) · Nucleic Acids Research · doi:10.1093/nar/24.16.3189 · Cited by 1,491 · cited 1×
“This procedure minimizes the risk of genotyping errors caused by allelic dropout and false alleles (Taberlet et al. 1996).”
Invasive predators and global biodiversity loss
Doherty, T. S., Glen, A. S., Nimmo, D. G., Ritchie, E. G., & Dickman, C. R. (2016) · Proceedings of the National Academy of Sciences · doi:10.1073/pnas.1602480113 · Cited by 1,270 · cited 1×
“2017), and game species like forest birds (Doherty et al. 2016; Jahren 2017; Skrede 2016; Smedshaug et al. 1999).”
BackgroundSpatially Explicit Maximum Likelihood Methods for Capture–Recapture Studies
Borchers, D. L., & Efford, M. G. (2008) · Biometrics · doi:10.1111/j.1541-0420.2007.00927.x · Cited by 881 · cited 1×
“Density may be modelled as a function of spatially explicit covariates (Borchers and Efford 2008).”
BackgroundAbsent or undetected? Effects of non-detection of species occurrence on wildlife–habitat models
Gu, W., & Swihart, R. K. (2004) · Biological Conservation · doi:10.1016/s0006-3207(03)00190-3 · Cited by 788 · cited 1×
“When not accounted for, imperfect detection can lead to erroneous inferences about density and its drivers (Gu and Swihart 2004).”
BackgroundDensity estimation in live‐trapping studies
Efford, M. (2004) · Oikos · doi:10.1111/j.0030-1299.2004.13043.x · Cited by 760 · cited 2×
“The buffer width was calculated by multiplying by 4 the largest estimated σ in a preliminary analysis (Efford 2004).”
MethodCamera traps in animal ecology : methods and analyses
O’Connell, A. F., Nichols, J. D., & Kāranta, K. U. (2011) · Cited by 600
(2014) · Elsevier eBooks · doi:10.1016/c2012-0-01222-7 · Cited by 501
A HIERARCHICAL MODEL FOR SPATIAL CAPTURE–RECAPTURE DATA
Royle, J. A., & Young, K. V. (2008) · Ecology · doi:10.1890/07-0601.1 · Cited by 414 · cited 4×
“2010; Royle and Young 2008).”
BackgroundMethodInfluential
Research works printed but not linked: 6
- Burnham KP, Anderson DR (2002) A practical information-theoretic approach. Model selection and multimodel inference, 2nd edn. Springer, New York, pp 70–71
- Jahren T (2017) The role of nest predation and nest predators in population declines of capercaillie and black grouse. PhD dissertation, Faculty of applied ecology and agricultural sciences, Inland Norway University of Applied Sciences, Evenstad, Norway
- Østbye E, Steen H, Framstad E, Tvete B (1989) Do connections exist between climatic variations and cyclicity in small rodents? Fauna 42:147–153
- Silvy NJ (Eds.) (2012) The Wildlife Techniques Manual: Volume 1: Research. Volume 2: Management 2-vol. Set (Vol. 1). JHU Press, Baltimore.
- Skrede A (2016) Nest-predation in willow ptarmigan – Red fox in the mountains (Original title: Reirpredasjon hjå lirype–Raudrev inntar fjellet). Bachelor's thesis, Faculty of Applied Ecology and Agricultural Sciences, Inland Norway University of Applied Sciences, Evenstad, Norway
- Svendsen K (2016) Movement and habitat use of red foxes in a boreal conifer forest (Original title: Rødrevens bevegelsesmønster og habitatbruk i en boreal barskog). Bachelor's thesis, Faculty of Applied Ecology and Agricultural Sciences, Inland Norway University of Applied Sciences, Evenstad
Cited by
Red fox (Vulpes vulpes) play an important role in the propagation of tick-borne pathogens
Lesiczka, P. M., Rudenko, N., Golovchenko, M., Juránková, J., Daněk, O., Modrý, D., & Hrazdilová, K. (2022) · Ticks and Tick-borne Diseases · doi:10.1016/j.ttbdis.2022.102076 · Cited by 24
Cerkvenik-Flajs, V., Schenke, D., Žele-Vengušt, D., Korenjak-Černe, S., Perpar, A., & Vengušt, G. (2024) · Science of The Total Environment · doi:10.1016/j.scitotenv.2024.170400 · Cited by 10
Lesiczka, P. M., Myśliwy, I., Buńkowska‐Gawlik, K., Modrý, D., Hrazdilová, K., Hildebrand, J., & Perec‐Matysiak, A. (2023) · Parasites & Vectors · doi:10.1186/s13071-023-05996-7 · Cited by 10
“The red fox is the most widespread free-living predator in the world [44], and its role as a host for A. phago-cytophilum is well documented [45, 46].”
BackgroundCelva, R., Crestanello, B., Obber, F., Dellamaria, D., Trevisiol, K., Bregoli, M., Cenni, L., Agreiter, A., Danesi, P., Hauffe, H. C., et al. (2022) · Pathogens · doi:10.3390/pathogens12010060 · Cited by 8
Antimicrobial Resistance in Enterococcus spp. Isolates from Red Foxes (Vulpes vulpes) in Latvia
Terentjeva, M., Ķibilds, J., Avsejenko, J., Cīrulis, A., Labecka, L., & Bērziņš, A. (2024) · Antibiotics · doi:10.3390/antibiotics13020114 · Cited by 10
Metadata
- Authors
- Lindsø, L. K., Dupont, P., Rød-Eriksen, L., Andersskog, I. P. Ø., Ulvund, K. R., Flagstad, Ø., Bischof, R., & Eide, N. E.
- Affiliations
- University of Oslo (NO)
- Norwegian University of Life Sciences (NO)
- Norwegian Institute for Nature Research (NO)
- Corresponding author
- Lindsø, Lars K.
- ORCID
- Venue
- Oecologia
- Published
- 2021-12-02
- Volume
- 198
- Issue
- 1
- Pages
- 139-151
- ISSN
- 0029-8549 (ISSN-L)
- 1432-1939
- PMC
- PMC8803778
- OpenAlex
- W3153442753
- Cited by
- 19
- References
- 75
- Citations by year
- 2026: 5 · 2025: 3 · 2024: 6 · 2023: 3 · 2022: 2
- FWCI
- 1.48
- Type
- journal article
- Language
- en
- Open access
- hybrid
- doi.org
- Licence
- cc-by
- creativecommons.org/licenses/by/4.0 (tdm)
- creativecommons.org/licenses/by/4.0 (vor)
- Locations
- Oecologia (publishedVersion, cc-by)
- PubMed Central (publishedVersion, cc-by)
- PubMed (publishedVersion)
- NORA - Norwegian Open Research Archives (submittedVersion, other-oa)
- Zenodo (CERN European Organization for Nuclear Research) (submittedVersion, cc-by)
- Funders
- Miljødirektoratet (18S247E2)
- Norges Forskningsråd (Project ECOFUNC, grant 244557/E50, Project WildMap, NFR 286886)
- University of Oslo
- Topics
- Physical Sciences › Environmental Science › Ecology › Wildlife Ecology and Conservation
- Physical Sciences › Mathematics › Statistics and Probability › Census and Population Estimation
- Physical Sciences › Environmental Science › Ecology › Animal Ecology and Behavior Studies
- Keywords
- red fox, population density estimation, non-invasive genetic sampling, spatial capture-recapture, home range size, space use, forest cover, detection probability, boreal forest, population monitoring, sex differences in home range
- MeSH terms
- Animals, Female, Foxes, Male, Norway, Population Density, Probability
About these checks
Registry, retraction, Cites and statistics results are computed, not judged, with one exception: a printed reference that no index lists is read once by a model before it counts as a citation error. Claims are extracted by a model and kept only when their quote appears verbatim in the text; each cited source is then checked, with a model’s help, for whether it says what the claim relies on. Those verdicts can be wrong — read the claim’s quote and the cited source before relying on one.
Statistics and arithmetic are recomputed, not judged.
Confidence bands are shown only for fields calibrated on our annotated test set. None is calibrated yet, so no band is shown.
What counts as a claim ›How we measure confidence ›How we check this ›
Are you an author, or do you see a problem with this page? Request a review
How to cite
Cite CoChat for the checks on this page, and the paper for its own findings.
- This page
- CoChat. (2026). Citation check: Estimating red fox density using non-invasive genetic sampling and spatial capture–recapture modelling. https://app.cochat.ai/papers/10.1007/s00442-021-05087-3
- The paper
- Lindsø, L. K., Dupont, P., Rød-Eriksen, L., Andersskog, I. P. Ø., Ulvund, K. R., Flagstad, Ø., Bischof, R., & Eide, N. E. (2022). Estimating red fox density using non-invasive genetic sampling and spatial capture–recapture modelling. Oecologia. https://doi.org/10.1007/s00442-021-05087-3
Data sources
Bibliographic data: Semantic Scholar, OpenAlex, Crossref.
Contains information from the Semantic Scholar Academic Graph Datasets, made available under the ODC Attribution License (ODC-BY 1.0).
Semantic Scholar’s data is described in: Kinney, R., et al. (2023). The Semantic Scholar Open Data Platform. arXiv:2301.10140.
