

Visitation patterns across mobility groups: wandering, commuting, and exploring
Open accessThe DOI matches its Crossref record; 66 of the 66 references it cites were found in a registry or an index; 8 of the 23 sources its claims cite were checked for support.
Abstract
In today’s increasingly mobile world, the dynamics of connectivity and accessibility are reshaping our understanding of movement. Mobility extends beyond physical travel, acting as a form of social currency deeply intertwined with broader societal structures and inequalities. Distinct daily mobility patterns allow different groups to navigate and experience urban spaces in diverse ways. This study aims to understand daily mobility profiles across cities and examine whether these profiles differ between locations or reflect similar patterns in different urban contexts. We analyze the daily movements of approximately 13,000 individuals in Auckland, New Zealand, and 23,500 individuals in Rio de Janeiro city, Brazil, using individual daily mobility data and a clustering algorithm to identify four distinct mobility groups. Our findings suggest a broader, more universal pattern of mobility-based divisions. While these groups show moderate mixing in residential areas, they are more segregated in the places they visit. This suggests that daily mobility, like other forms of capital, has the potential to reinforce (spatial) segregation, as individuals who live in close proximity often frequent different parts of the city, limiting exposure between members of different mobility groups.
Overview
CoChat Summary
TL;DR
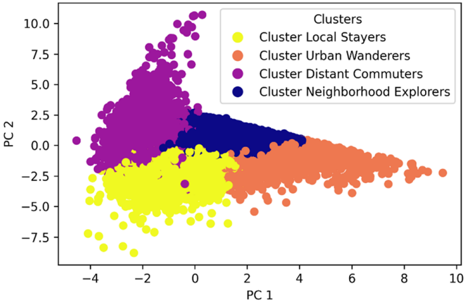
This study clusters individual daily mobility in Auckland and Rio de Janeiro into four groups—Urban Wanderers, Local Stayers, Neighborhood Explorers, and Distant Commuters—and finds similar mobility profiles across both cities. The groups mix more in residential sectors than in the sectors they visit, suggesting daily mobility can reinforce spatial segregation.
Key findings
- Four mobility groups emerged in both cities, but their proportions differed: Auckland (n = 13,096) had 34.59% Urban Wanderers, 30.49% Local Stayers, 17.23% Neighborhood Explorers, and 17.69% Distant Commuters; Rio de Janeiro (n = 23,518) had 28.32% Urban Wanderers, 41.13% Local Stayers, 23.91% Neighborhood Explorers, and 6.64% Distant Commuters.
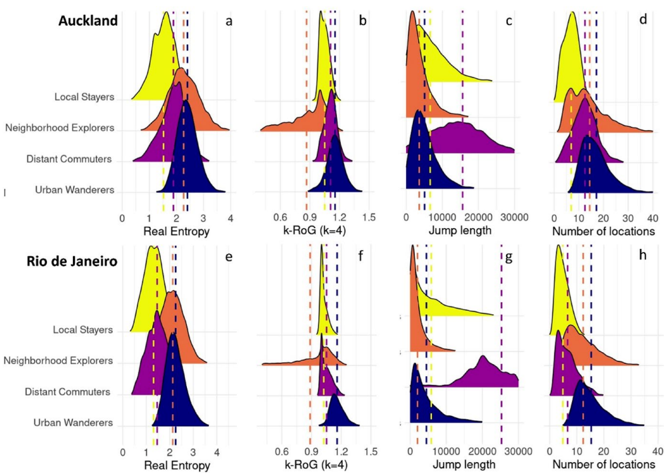
- Auckland individuals showed more exploratory and spatially extensive mobility than Rio individuals: real entropy S = 2.02 ± 0.58 vs. 1.78 ± 0.60; radius of gyration = 1623.07 ± 1658.95 m vs. 1608.76 ± 2052.95 m; visited locations L = 12.73 ± 7.24 vs. 9.73 ± 6.70; median jump length = 7174.65 ± 6664.1 m vs. 5854.95 ± 7623.20 m.
- PCA retained 3 components, explaining 71% of variance in Auckland and 74% in Rio; including PCA improved clustering performance by an average of 35% compared with clustering without PCA, and N = 4 clusters was the most consistent and interpretable solution.
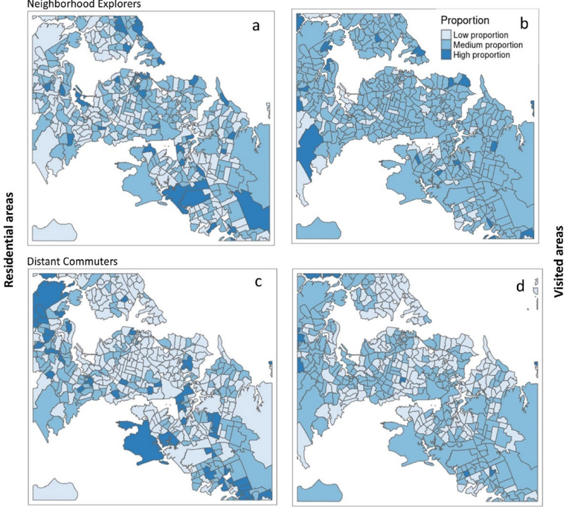
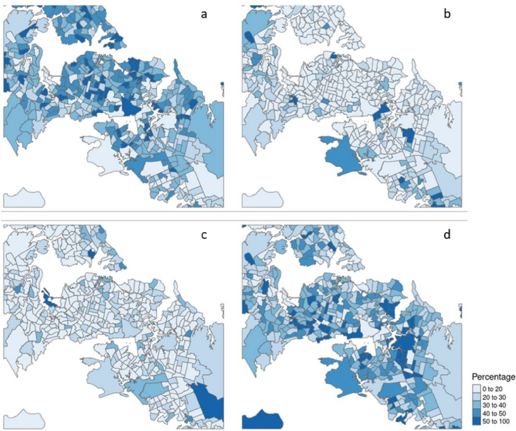
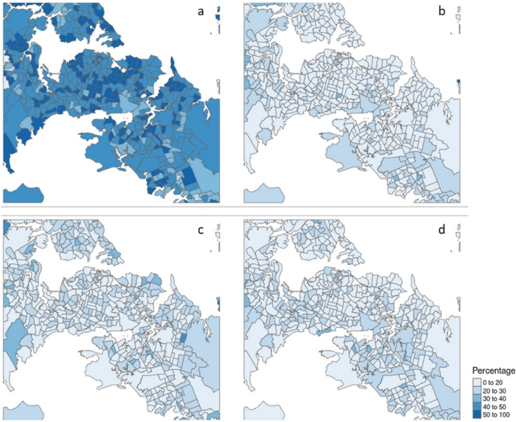
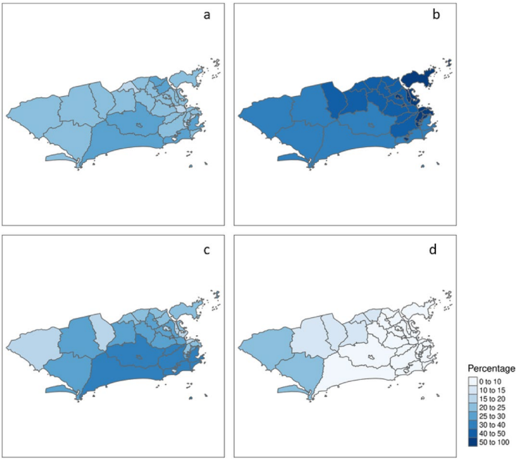
- Groups were more mixed in residential sectors but more segregated in visited sectors; Shannon entropy tests were significant in Auckland (Wilcoxon V = 48.946, p = 0.023; KS D = 0.132, p = 0.001) and Rio (Wilcoxon V = 376, p = 0.047), though Rio’s KS test was not significant (D = 0.277, p = 0.130).
Methods
- Analyzed high-resolution individual mobility trajectories from Auckland, New Zealand (approx. 1.7 million residents) and Rio de Janeiro, Brazil (approx. 6.2 million residents), using anonymized mobile app data from Azira/Near; median recording frequency was 10 min, and 30-day windows were selected to maximize complete trajectories, yielding 13,096 Auckland and 23,518 Rio individuals.
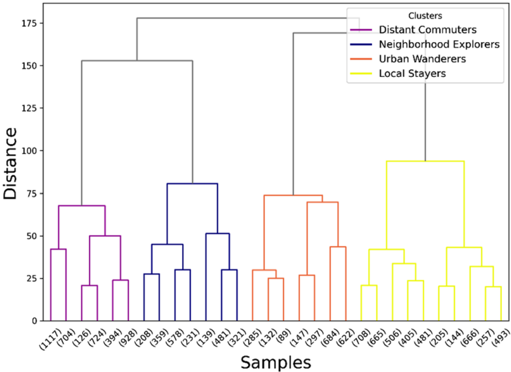
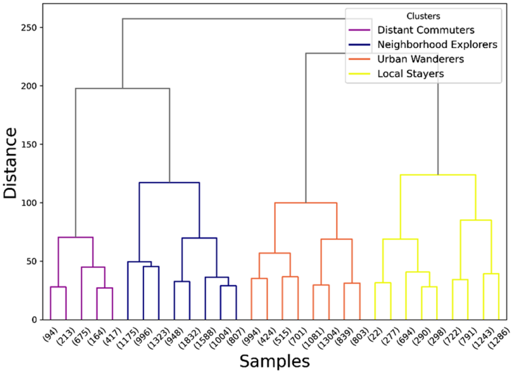
- Computed eight mobility metrics (number of visited locations, radius of gyration, k-radius ratios, jump length, location frequency, median distance from home, random entropy, real entropy); detected stop locations with Infostop (r1 = r2 = 50 m, tmin = 10 min, tmax = 24 h); standardized data, excluded L due to correlation with random entropy, applied PCA with the Broken-stick criterion, then Ward hierarchical clustering, evaluated with silhouette score, DBI, and CHI.
- For segregation, assigned home locations to statistical sectors, calculated each mobility group’s proportion in residential and visited sectors (excluding stops in one’s own residential sector), and used Shannon entropy plus global spatial autocorrelation.
Limitations
- Stated by authors: app-based mobility data are not fully representative, over-representing digitally active users and under-representing older adults, children, and lower-income populations; users who disable location services or have limited sensors are excluded. These biases limit population-level inferences, though the authors argue internal comparisons remain valid.
- Stated by authors: segregation analysis at the statistical sector level introduces uncertainties from geography and scale, and sector sizes differ between the two cities, making cross-city comparisons challenging; finer spatial units were unavailable due to privacy constraints and the need for sufficient observations.
- Stated by authors: the datasets come from different time periods and seasonal/pandemic contexts; Auckland’s data fall within the COVID-19 timeline, though no significant mobility restrictions were in place during most of the observation period, and residual effects may persist. The authors also note that further studies across broader cultural and urban contexts are needed before strong claims about universality can be made.
Model-written summary. Check it against the paper before relying on it.
Integrity signals
Registry
Cites
Statistics
Figures




Verification
Claims the paper makes
6 Valid · 2 Not valid · 8 Not checked · 166 Own results and interpretations
At least one cited source doesn’t support this claim or points to a different paper, and none confirmed it — see the verdicts below.
In the paper
“Additionally, research indicates that at least 14 days of data are required to capture routine individual mobility patterns (Stanley et al. 2018).”
§ Visitation patterns across mobility groups: wandering, commuting, and exploring > 3.1 Individual mobility data and data preprocessing
What the sources say
- Disputedcites Stanley et al. 2018 sourceExperimental — accuracy not yet measured
The Abstract says fewer than 14 days of GPS data were necessary to establish complete activity spaces in the study’s student participants. It reports negligible information gain in less than two weeks, contrary to the claim that at least 14 days are required. (LLM, conf=0.90)
Checked by a reasoning model — may be wrong.
hedged- Asserted: passes — The authors put it forward as true.
- Checkable: passes — It can be checked against evidence.
- Load-bearing: passes — The paper’s conclusions depend on it.
- Based: passes — The paper gives a reason why it holds.
- Disputed
Every source the paper cites for this claim was checked and supports it.
In the paper
“This approach allows us to detect emergent and interpretable mobility types in a robust and reproducible manner (Abrahms et al. 2017).”
§ Visitation patterns across mobility groups: wandering, commuting, and exploring > 3.3 Cluster analysis
What the sources say
- Supportedcites Abrahms et al. 2017 source
The Methods (Cluster analysis; page not available) describe clustering without a predetermined number of groups, testing cluster significance by bootstrap resampling, and interpreting clusters through simulated movement syndromes. The Discussion reports that a lower-resolution reanalysis retained four distinct clusters and most empirical assignments, supporting robustness, while noting some sensitivity to sampling resolution. (LLM, conf=0.86)
plainstates a cause- Asserted: passes — The authors put it forward as true.
- Checkable: passes — It can be checked against evidence.
- Load-bearing: passes — The paper’s conclusions depend on it.
- Based: passes — The paper gives a reason why it holds.
- Supported
A result the paper reports from its own data — it cites no other source for it, so there is none to check. The quote shows it is in the paper.
In the paper
“Overall, individuals in Auckland exhibit more exploratory and spatially extensive mobility behaviors than those in Rio.”
§ Visitation patterns across mobility groups: wandering, commuting, and exploring > 4.2 Individual mobility metrics
plainstates an association- Asserted: passes — The authors put it forward as true.
- Checkable: passes — It can be checked against evidence.
- Load-bearing: passes — The paper’s conclusions depend on it.
- Based: passes — The paper gives a reason why it holds.
A result the paper reports from its own data — it cites no other source for it, so there is none to check. The quote shows it is in the paper.
In the paper
“Including PCA improved clustering performance across both cities, as measured by silhouette score, DBI and CHI.”
§ Visitation patterns across mobility groups: wandering, commuting, and exploring > 4.3 Clustering results
plainstates a cause- Asserted: passes — The authors put it forward as true.
- Checkable: passes — It can be checked against evidence.
- Load-bearing: passes — The paper’s conclusions depend on it.
- Based: passes — The paper gives a reason why it holds.
A result the paper states — it cites no source for it, so there is none to check. The quote shows it is in the paper.
In the paper
“Finally, Distant Commuters are distinct from all the other groups due to their focus on long-distance travel.”
§ Visitation patterns across mobility groups: wandering, commuting, and exploring > 4.4 Clusters interpretation
plainstates an association- Asserted: passes — The authors put it forward as true.
- Checkable: passes — It can be checked against evidence.
- Load-bearing: passes — The paper’s conclusions depend on it.
- Based: passes — The paper gives a reason why it holds.
109 more claims
Create a free account to see all 182 claims and every source verdict.
- Probably not a substantial claim. 14
- It may state two separate claims as one. 58
- The quote only partly states this claim. 3
Self-check
Percentages, sums and reported differences re-computed from the paper’s own numbers.
Each contradiction between two passages listed here was confirmed by an independent check.
Rated major: it would touch a result — a value a result rests on, reported and recomputed p-values on opposite sides of the significance level, two passages that conflict with no sign which is right, or a cited work retracted before this paper was published.
In the paper
§ Visitation patterns across mobility groups: wandering, commuting, and exploring > 2013; Uteng 2009b).
“Specifically, Rio de Janeiro has a smaller share of individuals in groups characterized by long-distance travel, such as Neighborhood Explorers and Distant Commuters.”
§ Visitation patterns across mobility groups: wandering, commuting, and exploring > Segregation analysis
“| | | | Neighborhood explorers | 2256 17.23% | 5623 23.91% | |”
Rated minor: it would not touch a result — a value no result rests on, a p-value that stays on the same side of the significance level, or a conflict that is clerical, resolved elsewhere in the paper, or outside its own findings.
In the paper
§ Visitation patterns across mobility groups: wandering, commuting, and exploring > Segregation analysis
“Their radius of gyration is moderate, with Auckland's value at 1187.59 m and Rio's at 1699.09 m, indicating they travel across a larger area than Local Stayers but remain within their neighborhoods or nearby districts.”
§ Visitation patterns across mobility groups: wandering, commuting, and exploring > Segregation analysis
“Their radius of gyration is also small, with Auckland's Local Stayers traveling an average of 1290.53 m and Rio's at 1342.37 m, indicating a strong preference for staying within familiar, localized areas.”
Citations
Cites
Statistical Power Analysis for the Behavioral Sciences
Cohen, J. (2013) · doi:10.4324/9780203771587 · Cited by 25,373
Silhouettes: A graphical aid to the interpretation and validation of cluster analysis
Rousseeuw, P. J. (1987) · Journal of Computational and Applied Mathematics · doi:10.1016/0377-0427(87)90125-7 · Cited by 21,392
Davies, D. L., & Bouldin, D. W. (1979) · IEEE Transactions on Pattern Analysis and Machine Intelligence · doi:10.1109/tpami.1979.4766909 · Cited by 9,145
Sheller, M., & Urry, J. (2006) · Environment and Planning A: Economy and Space · doi:10.1068/a37268 · Cited by 5,591
A dendrite method for cluster analysis
Caliński, T., & Harabasz, J. (1974) · Communications in Statistics · doi:10.1080/03610927408827101 · Cited by 4,480
The Dimensions of Residential Segregation
Massey, D. S., & Denton, N. A. (1988) · Social Forces · doi:10.1093/sf/67.2.281 · Cited by 3,483
WHAT ABOUT PEOPLE IN REGIONAL SCIENCE?
Hägerstraand, T. (1970) · Papers in Regional Science · doi:10.1111/j.1435-5597.1970.tb01464.x · Cited by 3,405
Limits of Predictability in Human Mobility
Song, C., Qu, Z., Blumm, N., & Barabási, A.-L. (2010) · Science · doi:10.1126/science.1177170 · Cited by 3,234
The Dimensions of Residential Segregation
Massey, D. S., & Denton, N. A. (1988) · Social Forces · doi:10.2307/2579183 · Cited by 2,103
What about people in Regional Science?
Hägerstrand, T. (1970) · Papers of the Regional Science Association · doi:10.1007/bf01936872 · Cited by 1,568
The Uncertain Geographic Context Problem
Kwan, M.-P. (2012) · Annals of the Association of American Geographers · doi:10.1080/00045608.2012.687349 · Cited by 1,413
Modelling the scaling properties of human mobility
Song, C., Koren, T., Wang, P., & Barabási, A.-L. (2010) · Nature Physics · doi:10.1038/nphys1760 · Cited by 1,284
Kaufmann, V., Bergman, M. M., & Joye, D. (2004) · International Journal of Urban and Regional Research · doi:10.1111/j.0309-1317.2004.00549.x · Cited by 1,214
Kwan, M. (1998) · Geographical Analysis · doi:10.1111/j.1538-4632.1998.tb00396.x · Cited by 1,156
Rosvall, M., Axelsson, D., & Bergstrom, C. T. (2009) · The European Physical Journal Special Topics · doi:10.1140/epjst/e2010-01179-1 · Cited by 844
Returners and explorers dichotomy in human mobility
Pappalardo, L., Simini, F., Rinzivillo, S., Pedreschi, D., Giannotti, F., & Barabási, A.-L. (2015) · Nature Communications · doi:10.1038/ncomms9166 · Cited by 494
Canzian, L., & Musolesi, M. (2015) · Proceedings of the 2015 ACM International Joint Conference on Pervasive and Ubiquitous Computing · doi:10.1145/2750858.2805845 · Cited by 477
Flows of Meaning, Cultures of Movements – Urban Mobility as Meaningful Everyday Life Practice
Jensen, O. B. (2009) · Mobilities · doi:10.1080/17450100802658002 · Cited by 367
Alessandretti, L., Aslak, U., & Lehmann, S. (2020) · Nature · doi:10.1038/s41586-020-2909-1 · Cited by 361
Measuring segregation: an activity space approach
Wong, D. W. S., & Shaw, S.-L. (2011) · Journal of Geographical Systems · doi:10.1007/s10109-010-0112-x · Cited by 323
Application of an Hierarchical Grouping Procedure to a Problem of Grouping Profiles
Ward, J. H., & Hook, M. E. (1963) · Educational and Psychological Measurement · doi:10.1177/001316446302300107 · Cited by 309
Kim, H.-M., & Kwan, M.-P. (2003) · Journal of Geographical Systems · doi:10.1007/s101090300104 · Cited by 291
Analysis of human mobility patterns from GPS trajectories and contextual information
Siła-Nowicka, K., Vandrol, J., Oshan, T., Long, J. A., Demšar, U., & Fotheringham, A. S. (2016) · International Journal of Geographical Information Science · doi:10.1080/13658816.2015.1100731 · Cited by 274
Self-citationMobility patterns are associated with experienced income segregation in large US cities
Moro, E., Calacci, D., Dong, X., & Pentland, A. (2021) · Nature Communications · doi:10.1038/s41467-021-24899-8 · Cited by 259
Linking modal choice to motility: A comprehensive review
De Witte, A., Hollevoet, J., Dobruszkes, F., Hubert, M., & Macharis, C. (2013) · Transportation Research Part A: Policy and Practice · doi:10.1016/j.tra.2013.01.009 · Cited by 254
Human mobility and socioeconomic status: Analysis of Singapore and Boston
Xu, Y., Belyi, A., Bojic, I., & Ratti, C. (2018) · Computers, Environment and Urban Systems · doi:10.1016/j.compenvurbsys.2018.04.001 · Cited by 234
Social networks, mobile lives and social inequalities
Urry, J. (2012) · Journal of Transport Geography · doi:10.1016/j.jtrangeo.2011.10.003 · Cited by 224
Variable selection in large environmental data sets using principal components analysis
King, J. R., & Jackson, D. A. (1999) · Environmetrics · doi:10.1002/(sici)1099-095x(199901/02)10:1<67::aid-env336>3.0.co;2-0 · Cited by 197
Human mobility networks reveal increased segregation in large cities
Nilforoshan, H., Looi, W., Pierson, E., Villanueva, B., Fishman, N., Chen, Y., Sholar, J., Redbird, B., Grusky, D., & Leskovec, J. (2023) · Nature · doi:10.1038/s41586-023-06757-3 · Cited by 162
Problematizing Mobility: A Metaphor of Stickiness, Non-Places and the Kinetic Elite
Costas, J. (2013) · Organization Studies · doi:10.1177/0170840613495324 · Cited by 138
The impact of social segregation on human mobility in developing and industrialized regions
Amini, A., Kung, K., Kang, C., Sobolevsky, S., & Ratti, C. (2014) · EPJ Data Science · doi:10.1140/epjds31 · Cited by 126
Estimating experienced racial segregation in US cities using large-scale GPS data
Athey, S., Ferguson, B., Gentzkow, M., & Schmidt, T. (2021) · Proceedings of the National Academy of Sciences · doi:10.1073/pnas.2026160118 · Cited by 124
Using human mobility data to quantify experienced urban inequalities
Xu, F., Wang, Q., Moro, E., Chen, L., Miranda, A. S., González, M. C., Tizzoni, M., Song, C., Ratti, C., Bettencourt, L. M. A., et al. (2025) · Nature Human Behaviour · doi:10.1038/s41562-024-02079-0 · Cited by 119
Rhythms of the Night: Spatiotemporal Inequalities in the Nighttime Economy
Schwanen, T., van Aalst, I., Brands, J., & Timan, T. (2012) · Environment and Planning A: Economy and Space · doi:10.1068/a44494 · Cited by 117
Moving with and against the state: digital nomads and frictional mobility regimes
Mancinelli, F., & Molz, J. G. (2023) · Mobilities · doi:10.1080/17450101.2023.2209825 · Cited by 115
Suite of simple metrics reveals common movement syndromes across vertebrate taxa
Abrahms, B., Seidel, D. P., Dougherty, E., Hazen, E. L., Bograd, S. J., Wilson, A. M., Weldon McNutt, J., Costa, D. P., Blake, S., Brashares, J. S., et al. (2017) · Movement Ecology · doi:10.1186/s40462-017-0104-2 · Cited by 109
From residence to movement: The nature of racial segregation in everyday urban mobility
Candipan, J., Phillips, N. E., Sampson, R. J., & Small, M. (2021) · Urban Studies · doi:10.1177/0042098020978965 · Cited by 108
Social segregation around the clock in the Paris region (France)
Le Roux, G., Vallée, J., & Commenges, H. (2017) · Journal of Transport Geography · doi:10.1016/j.jtrangeo.2017.02.003 · Cited by 104
Clustering Weekly Patterns of Human Mobility Through Mobile Phone Data
Thuillier, E., Moalic, L., Lamrous, S., & Caminada, A. (2017) · IEEE Transactions on Mobile Computing · doi:10.1109/tmc.2017.2742953 · Cited by 92
Gender, Ethnicity, and Constrained Mobility: Insights into the Resultant Social Exclusion
Uteng, T. P. (2009) · Environment and Planning A: Economy and Space · doi:10.1068/a40254 · Cited by 85
Time Geography and Space–Time Prism
Miller, H. J. (2017) · International Encyclopedia of Geography · doi:10.1002/9781118786352.wbieg0431 · Cited by 84
Garsten, C. (2008) · Palgrave Macmillan UK eBooks · doi:10.1057/9780230227460 · Cited by 76
Predictability of individuals' mobility with high-resolution positioning data
Lin, M., Hsu, W.-J., & Lee, Z. Q. (2012) · Proceedings of the 2012 ACM Conference on Ubiquitous Computing · doi:10.1145/2370216.2370274 · Cited by 72
Human Mobility Modelling: Exploration and Preferential Return Meet the Gravity Model
Pappalardo, L., Rinzivillo, S., & Simini, F. (2016) · Procedia Computer Science · doi:10.1016/j.procs.2016.04.188 · Cited by 71
Östh, J., Shuttleworth, I., & Niedomysl, T. (2018) · Environment and Planning A Economy and Space · doi:10.1177/0308518x18763167 · Cited by 69
Weather effects on human mobility: a study using multi-channel sequence analysis
Brum-Bastos, V. S., Long, J. A., & Demšar, U. (2018) · Computers, Environment and Urban Systems · doi:10.1016/j.compenvurbsys.2018.05.004 · Cited by 66
Self-citationPlyushteva, A., & Boussauw, K. (2020) · Transport Policy · doi:10.1016/j.tranpol.2020.01.002 · Cited by 60
On the relationship between socio-economic factors and cell phone usage
Frias-Martinez, V., & Virseda, J. (2012) · Proceedings of the Fifth International Conference on Information and Communication Technologies and Development · doi:10.1145/2160673.2160684 · Cited by 55
The Link Between Ethnic Segregation and Socio‐Economic Status: An Activity Space Approach
Järv, O., Masso, A., Silm, S., & Ahas, R. (2020) · Tijdschrift voor Economische en Sociale Geografie · doi:10.1111/tesg.12465 · Cited by 54
Scherrer, L., Tomko, M., Ranacher, P., & Weibel, R. (2018) · EPJ Data Science · doi:10.1140/epjds/s13688-018-0147-7 · Cited by 47
Assessing the socio-demographic representativeness of mobile phone application data
Sinclair, M., Maadi, S., Zhao, Q., Hong, J., Ghermandi, A., & Bailey, N. (2023) · Applied Geography · doi:10.1016/j.apgeog.2023.102997 · Cited by 43
How many days are enough?: capturing routine human mobility
Stanley, K., Yoo, E.-H., Paul, T., & Bell, S. (2018) · International Journal of Geographical Information Science · doi:10.1080/13658816.2018.1434888 · Cited by 42
Developing A Model of Mobility Capital for An Ageing Population
Musselwhite, C., & Scott, T. (2019) · International Journal of Environmental Research and Public Health · doi:10.3390/ijerph16183327 · Cited by 36
Re‐working mobilities: Emergent geographies of employment‐related mobility
Dorow, S., Roseman, S. R., & Cresswell, T. (2017) · Geography Compass · doi:10.1111/gec3.12350 · Cited by 35
Understanding individuals' proclivity for novelty seeking
Amichi, L., Viana, A. C., Crovella, M. E., & Loureiro, A. A. F. (2020) · ACM SIGSPATIAL International Conference on Advances in Geographic Information Systems (SIGSPATIAL GIS) · doi:10.1145/3397536.3422248 · Cited by 24
Cornacchia, G., & Pappalardo, L. (2021) · Procedia Computer Science · doi:10.1016/j.procs.2021.03.035 · Cited by 22
Infostop: Scalable stop-location detection in multi-user mobility data
Aslak, U., & Alessandretti, L. (2020) · arXiv · doi:10.48550/arxiv.2003.14370 · Cited by 21
Hołubowska, O., & Poorthuis, A. (2024) · Journal of Ethnic and Migration Studies · doi:10.1080/1369183x.2024.2352502 · Cited by 12
Self-citationJi, Y., Gao, S., Huynh, T., Scheele, C., Triveri, J., Kruse, J., Bennett, C., & Wen, Y. (2023) · Transactions in GIS · doi:10.1111/tgis.13043 · Cited by 12
The experiences of daily smartphone use among older adults in Brazil: A grounded theory analysis
Gallo, A. M., Laranjeira, C., Araújo, J. P., Marques, F. R. D. M., Baccon, W. C., Salci, M. A., & Carreira, L. (2024) · Heliyon · doi:10.1016/j.heliyon.2024.e35120 · Cited by 11
An individual-level ground truth dataset for home location detection
Pappalardo, L., Ferres, L., Sacasa, M., Cattuto, C., & Bravo, L. (2020) · arXiv · doi:10.48550/arxiv.2010.08814 · Cited by 7
The Impact of Social Segregation on Human Mobility in Developing and Urbanized RegionsPreprint
Amini, A., Kung, K. S., Kang, C., et al. (2014) · arXiv (Cornell University) · doi:10.48550/arxiv.1401.5743 · Cited by 6
11 Moving in Circles: Kinetic Elite and Kinetic Proletariat in ‘End of the World’ Films
Mazierska, E. H. (2018) · Edinburgh University Press eBooks · doi:10.1515/9781474421843-014
Research works printed but not linked: 5
- Browning CR, Soller B (2014) Moving beyond neighborhood: Activity spaces and ecological networks as contexts for youth development. Cityscape Wash DC 16:165–196
- Cresswell T (2006) On the move: mobility in the modern western world. Taylor & Francis
- Sheller M (2018) Mobility justice: the politics of movement in an age of extremes, 1st edition. ed. Verso, London
- Uteng TP (2009b) Gender, ethnicity, and constrained mobility: insights into the resultant social exclusion. Environ Plan A Econ Space 41:1055–1071. https://doi.org/10.1068/a40254 · DOI · Paper page
- Vaserstein LN (1969) Markov processes over denumerable products of spaces, describing large systems of automata. Probl Peredachi Inf 5:64–72
Metadata
- Authors
- Hołubowska, O., Smolak, K., Brum-Bastos, V., & Sila-Nowicka, K.
- Affiliations
- KU Leuven (BE)
- Wrocław University of Environmental and Life Sciences (PL)
- University of Canterbury (NZ)
- Corresponding author
- Smolak, Kamil
- Venue
- Journal of Geographical Systems
- Published
- 2026-06-12
- ISSN
- 1435-5930 (ISSN-L)
- 1435-5949
- OpenAlex
- W7164540984
- Semantic Scholar
- 88a014458848deeba24cc75336d4f2b0c8f5b91a
- Cited by
- 0
- References
- 62
- FWCI
- 0.00
- Type
- journal article
- Language
- en
- Open access
- hybrid
- doi.org
- Licence
- cc-by
- creativecommons.org/licenses/by/4.0 (tdm)
- creativecommons.org/licenses/by/4.0 (vor)
- Locations
- Journal of Geographical Systems (publishedVersion, cc-by)
- University of Canterbury Research Repository (University of Canterbury) (submittedVersion, cc-by)
- Funders
- Uniwersytet Przyrodniczy we Wroclawiu (N060/0003/24)
- Topics
- Social Sciences › Transportation › Human Mobility and Location-Based Analysis
- Social Sciences › Transportation › Urban Transport and Accessibility
- Social Sciences › Urban Studies › Urban Design and Spatial Analysis
- Keywords
- daily mobility patterns, wandering, commuting, urban exploration, spatial segregation, social capital, urban mobility, residential segregation, Auckland, Rio de Janeiro
About these checks
Registry, retraction, Cites and statistics results are computed, not judged, with one exception: a printed reference that no index lists is read once by a model before it counts as a citation error. Claims are extracted by a model and kept only when their quote appears verbatim in the text; each cited source is then checked, with a model’s help, for whether it says what the claim relies on. Those verdicts can be wrong — read the claim’s quote and the cited source before relying on one.
The claim verdicts this report counts are experimental: their accuracy is not yet measured.
A language model drew the claims from the paper on 2026-10-11, under version 3 of the claim definition (model deepseek-v4.1-flash, prompt extract-v3).
A second model labelled each claim on 2026-10-11 (model jev-1.13-20260917, definition revision gold-guideline-v0.2).
Cited sources are checked with a language model’s help (gpt-6-sol).
Statistics and arithmetic are recomputed, not judged.
Confidence bands are shown only for fields calibrated on our annotated test set. None is calibrated yet, so no band is shown.
What counts as a claim ›How we measure confidence ›How we check this ›
Are you an author, or do you see a problem with this page? Request a review
Data sources
Bibliographic data: Semantic Scholar, OpenAlex, Crossref.
Contains information from the Semantic Scholar Academic Graph Datasets, made available under the ODC Attribution License (ODC-BY 1.0).
Semantic Scholar’s data is described in: Kinney, R., et al. (2023). The Semantic Scholar Open Data Platform. arXiv:2301.10140.
