Cited by 37

The DOI matches its Crossref record; 15 of the 15 references it cites were found in a registry or an index.

Fractalkine Induces Hepcidin Expression of BV-2 Microglia and Causes Iron Accumulation in SH-SY5Y Cells

Pandur, Edina, Tamási, Kitti, Pap, Ramóna, Varga, Edit, Miseta, Attila, Sipos, Katalin·2019·Cellular and Molecular Neurobiology

Abstract

Fractalkine (CX3CL1) is a potent inflammatory mediator of the central nervous system, which is expressed by neurons and regulates microglial functions by binding to fractalkine receptor (CX3CR1). It has been demonstrated that neuroinflammation plays an important role in iron accumulation of the brain leading to neuronal cell death. The major regulator of iron homeostasis is the peptide hormone hepcidin. Hepcidin expression is triggered by inflammatory conditions, which may contribute to the neuronal iron accumulation. In the present study, we established a bilaminar co-culture system of differentiated SH-SY5Y cells and BV-2 microglia as a neuronal model to examine the effect of soluble fractalkine on iron homeostasis of microglia and SH-SY5Y cells. We determined the hepcidin expression of fractalkine-treated microglia which showed significant elevation. We examined the relation between increased hepcidin secretion, the known hepcidin regulators and the signalling pathways controlled by fractalkine receptor. Our data revealed that TMPRSS6 and alpha 1-antitrypsin levels decreased due to fractalkine treatment, as well as the activity of NFκB pathway and the tyrosine phosphorylation of STAT5 factor. Moreover, fractalkine-induced hepcidin production of microglia initiated ferroportin internalisation of SH-SY5Y cells, which contributed to iron accumulation of neurons. Our results demonstrate that soluble form of fractalkine regulates hepcidin expression of BV-2 cells through fractalkine-mediated CX3CR1 internalisation. Moreover, fractalkine indirectly contributes to the iron accumulation of SH-SY5Y cells by activating ferroportin internalisation and by triggering the expressions of divalent metal transporter-1, ferritin heavy chain and mitochondrial ferritin.

Overview

The claims and statistics of this paper haven’t been checked yet.

Run the check — free, no account needed. It reads the open-access text and checks the sources it cites.

A few free checks a day · papers already verified open instantly · results are public

Integrity signals

Registry

Crossref · 10.1007/s10571-019-00694-4

Cites

15 of 15 references verified0 citation errors · 0 not checkable

Statistics

Figures

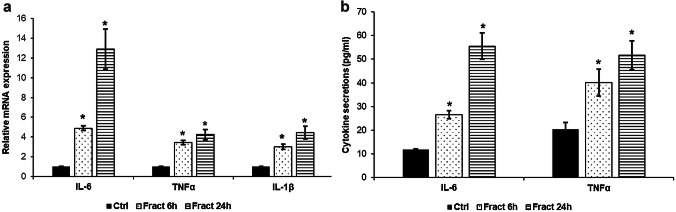
Fig. 1 mRNA expression levels of IL-6, TNFα and IL-1β and concentrations of the secreted IL-6 and TNFα in fractalkine-treated co-cultured BV-2 cells. Real-time PCR was performed with SYBR green protocol using gene-specific primers. β-actin was used as housekeeping gene for the normalisation and relative expression of controls was regarded as 1. Secreted IL-6 and TNFα were measured with ELISA according to the manufacturer’s protocols. a Relative mRNA expression levels of IL-6, TNFα and IL-1β. b Concentrations of the secreted IL-6 and TNFα measured from the cell culture medium. The bars represent mean values and error bars represent standard errors of the mean (S.E.M.) for three independent experiments (n = 3). The asterisks mark p < 0.05 compared to the controls
Fig. 1 mRNA expression levels of IL-6, TNFα and IL-1β and concentrations of the secreted IL-6 and TNFα in fractalkine-treated co-cultured BV-2 cells. Real-time PCR was performed with SYBR green protocol using gene-specific primers. β-actin was used as housekeeping gene for the normalisation and relative expression of controls was regarded as 1. Secreted IL-6 and TNFα were measured with ELISA according to the manufacturer’s protocols. a Relative mRNA expression levels of IL-6, TNFα and IL-1β. b Concentrations of the secreted IL-6 and TNFα measured from the cell culture medium. The bars represent mean values and error bars represent standard errors of the mean (S.E.M.) for three independent experiments (n = 3). The asterisks mark p < 0.05 compared to the controlsCC BY · PubMed Central
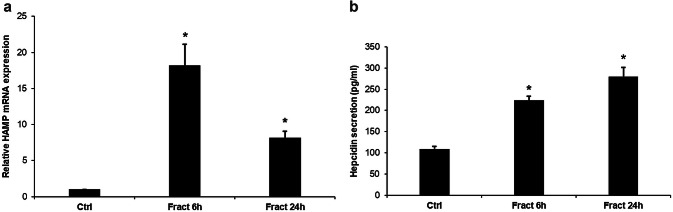
Fig. 2 mRNA expression levels of HAMP and concentration of the secreted hepcidin in fractalkine-treated co-cultured BV-2 cells. Real-time PCR was performed with SYBR green protocol using gene specific primers. The β-actin was used as housekeeping gene for the normalisation and the relative expression of the controls was regarded as 1. Secreted hepcidin was quantified with ELISA according to the manufacturer’s instructions. a Relative mRNA levels of HAMP. b Concentration of the secreted hepcidin measured from the cell culture medium. The bars represent mean values and error bars represent standard errors of the mean (S.E.M.) for three independent experiments (n = 3). The asterisks indicate p < 0.05 compared to the controls
Fig. 2 mRNA expression levels of HAMP and concentration of the secreted hepcidin in fractalkine-treated co-cultured BV-2 cells. Real-time PCR was performed with SYBR green protocol using gene specific primers. The β-actin was used as housekeeping gene for the normalisation and the relative expression of the controls was regarded as 1. Secreted hepcidin was quantified with ELISA according to the manufacturer’s instructions. a Relative mRNA levels of HAMP. b Concentration of the secreted hepcidin measured from the cell culture medium. The bars represent mean values and error bars represent standard errors of the mean (S.E.M.) for three independent experiments (n = 3). The asterisks indicate p < 0.05 compared to the controlsCC BY · PubMed Central
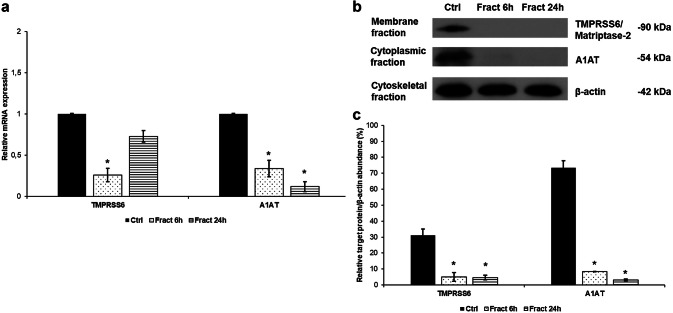
Fig. 3 Analyses of the mRNA and protein levels of hepcidin regulators. Real-time PCR was performed with SYBR green protocol using gene specific primers. The β-actin was used as housekeeping gene for the normalisation and the relative expression of the controls was considered as 1. Pelleted BV-2 cells from the co-cultures were fractionated. Protein contents of the fractions were measured. The same amount of protein (15 µg) from each sample was loaded onto 12% SDS-PAGE and transferred by electroblotting to nitrocellulose membranes and was probed with TMPRSS6, A1AT and β-actin polyclonal rabbit antibodies according to the manufacturer’s protocols. a Relative mRNA expression levels of the negative hepcidin regulators TMPRSS6 and alpha-1 antitrypsin. b Protein levels of negative hepcidin regulators TMPRSS6 and A1AT. c Optical densities of Western blot analyses of TMPRSS6 and A1AT. The analyses were done using ImageJ software; the optical density of the examined proteins was expressed as percentage of target protein/β-actin abundance. The bars represent mean values and error bars represent standard errors of the mean (SEM) for three independent experiments (n = 3). The asterisks indicate p < 0.05 compared to the controls
Fig. 3 Analyses of the mRNA and protein levels of hepcidin regulators. Real-time PCR was performed with SYBR green protocol using gene specific primers. The β-actin was used as housekeeping gene for the normalisation and the relative expression of the controls was considered as 1. Pelleted BV-2 cells from the co-cultures were fractionated. Protein contents of the fractions were measured. The same amount of protein (15 µg) from each sample was loaded onto 12% SDS-PAGE and transferred by electroblotting to nitrocellulose membranes and was probed with TMPRSS6, A1AT and β-actin polyclonal rabbit antibodies according to the manufacturer’s protocols. a Relative mRNA expression levels of the negative hepcidin regulators TMPRSS6 and alpha-1 antitrypsin. b Protein levels of negative hepcidin regulators TMPRSS6 and A1AT. c Optical densities of Western blot analyses of TMPRSS6 and A1AT. The analyses were done using ImageJ software; the optical density of the examined proteins was expressed as percentage of target protein/β-actin abundance. The bars represent mean values and error bars represent standard errors of the mean (SEM) for three independent experiments (n = 3). The asterisks indicate p < 0.05 compared to the controlsCC BY · PubMed Central
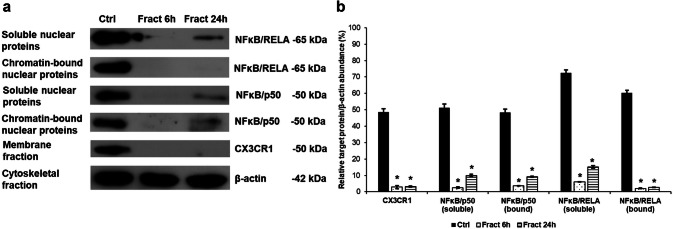
Fig. 4 Western blot analysis of the proteins in the NFκB signalling pathways. Pelleted BV-2 cells from the co-cultures were fractionated and protein concentrations of the fractions were measured. The same amount of protein (15 µg) from each sample was loaded onto 12% SDS-PAGE and transferred by electro blotting to nitrocellulose membranes and were probed with CX3CR1, p50 (NFκB) and RELA (NFκB) polyclonal rabbit antibodies according to the manufacturer’s protocols. β-actin was used as loading control. a Protein levels of CX3CR1, p50 (NFκB) and RELA (NFκB) in the different protein fractions of BV-2 cells. b Optical densities of the Western blot analyses of CX3CR1, p50 (NFκB) and RELA (NFκB). The analyses were carried out using ImageJ software; the optical density of the examined proteins was expressed as percentage of target protein/β-actin abundance. The bars represent mean values and error bars represent standard errors of the mean (SEM) for three independent determinations (n = 3). The asterisks indicate p < 0.05 compared to the controls
Fig. 4 Western blot analysis of the proteins in the NFκB signalling pathways. Pelleted BV-2 cells from the co-cultures were fractionated and protein concentrations of the fractions were measured. The same amount of protein (15 µg) from each sample was loaded onto 12% SDS-PAGE and transferred by electro blotting to nitrocellulose membranes and were probed with CX3CR1, p50 (NFκB) and RELA (NFκB) polyclonal rabbit antibodies according to the manufacturer’s protocols. β-actin was used as loading control. a Protein levels of CX3CR1, p50 (NFκB) and RELA (NFκB) in the different protein fractions of BV-2 cells. b Optical densities of the Western blot analyses of CX3CR1, p50 (NFκB) and RELA (NFκB). The analyses were carried out using ImageJ software; the optical density of the examined proteins was expressed as percentage of target protein/β-actin abundance. The bars represent mean values and error bars represent standard errors of the mean (SEM) for three independent determinations (n = 3). The asterisks indicate p < 0.05 compared to the controlsCC BY · PubMed Central
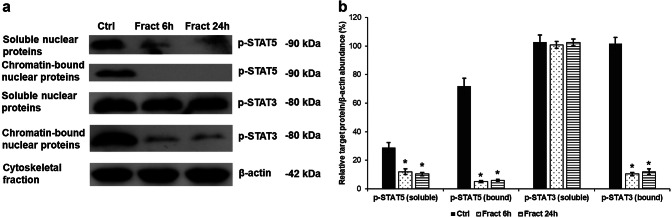
Fig. 5 Western blot analysis of STAT5 and STAT3 tyrosine phosphorylation due to fractalkine treatment of co-cultured BV-2 cells. Pelleted BV-2 cells from the co-cultures were fractionated and protein concentrations of the fractions were measured. The same amount of protein (15 µg) from each sample was loaded onto 10% SDS-PAGE and transferred to nitrocellulose membranes and was probed with p-STAT5 or p-STAT3 polyclonal rabbit antibodies according to the manufacturer’s protocols. The β-actin was used as loading control. a Protein expression levels of p-STAT5 and p-STAT3 in the nuclear protein fractions of BV-2 cells. b Optical densities of the Western blot analyses of p-STAT5 and p-STAT3. The analyses were carried out using ImageJ software; the optical density of the examined proteins was expressed as percentage of target protein/β-actin abundance. The bars represent mean values and error bars represent standard errors of the mean (S.E.M.) for three independent experiments (n = 3). The asterisks indicate p < 0.05 compared to the controls
Fig. 5 Western blot analysis of STAT5 and STAT3 tyrosine phosphorylation due to fractalkine treatment of co-cultured BV-2 cells. Pelleted BV-2 cells from the co-cultures were fractionated and protein concentrations of the fractions were measured. The same amount of protein (15 µg) from each sample was loaded onto 10% SDS-PAGE and transferred to nitrocellulose membranes and was probed with p-STAT5 or p-STAT3 polyclonal rabbit antibodies according to the manufacturer’s protocols. The β-actin was used as loading control. a Protein expression levels of p-STAT5 and p-STAT3 in the nuclear protein fractions of BV-2 cells. b Optical densities of the Western blot analyses of p-STAT5 and p-STAT3. The analyses were carried out using ImageJ software; the optical density of the examined proteins was expressed as percentage of target protein/β-actin abundance. The bars represent mean values and error bars represent standard errors of the mean (S.E.M.) for three independent experiments (n = 3). The asterisks indicate p < 0.05 compared to the controlsCC BY · PubMed Central
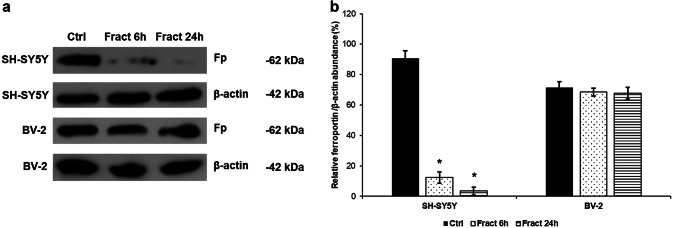
Fig. 6 Western blot analysis of the iron exporter ferroportin (Fp) in BV-2 and differentiated SH-SY5Y cells after fractalkine treatment. SH-SY5Y cells were collected from Thermanox coverslips and BV-2 cells were collected from the cell culture dish with trypsinization. Cells were lysed and protein concentrations of the samples were measured. The same amount of protein (15 µg) from each sample was loaded onto 12% SDS-PAGE and transferred to nitrocellulose membranes and was probed with Fp polyclonal rabbit antibody according to the manufacturer’s protocol. The β-actin was used as loading control. a Protein expression levels of ferroportin in the BV-2 and SH-SY5Y cells. b Optical densities of the Western blot analyses of ferroportin. The analyses were carried out using ImageJ software; the optical density of the ferroportin was expressed as percentage of ferroportin protein/β-actin abundance. The bars represent mean values and error bars represent standard errors of the mean (S.E.M.) for three independent experiments (n = 3). The asterisks mark p < 0.05 compared to the controls
Fig. 6 Western blot analysis of the iron exporter ferroportin (Fp) in BV-2 and differentiated SH-SY5Y cells after fractalkine treatment. SH-SY5Y cells were collected from Thermanox coverslips and BV-2 cells were collected from the cell culture dish with trypsinization. Cells were lysed and protein concentrations of the samples were measured. The same amount of protein (15 µg) from each sample was loaded onto 12% SDS-PAGE and transferred to nitrocellulose membranes and was probed with Fp polyclonal rabbit antibody according to the manufacturer’s protocol. The β-actin was used as loading control. a Protein expression levels of ferroportin in the BV-2 and SH-SY5Y cells. b Optical densities of the Western blot analyses of ferroportin. The analyses were carried out using ImageJ software; the optical density of the ferroportin was expressed as percentage of ferroportin protein/β-actin abundance. The bars represent mean values and error bars represent standard errors of the mean (S.E.M.) for three independent experiments (n = 3). The asterisks mark p < 0.05 compared to the controlsCC BY · PubMed Central
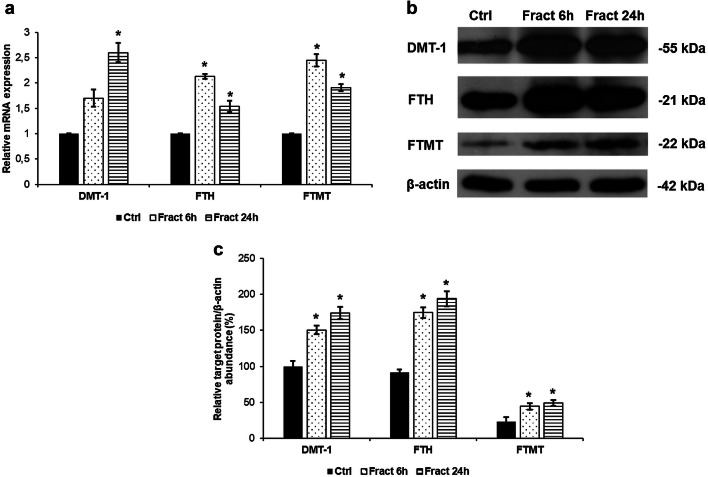
Fig. 7 mRNA and Western blot analyses of genes responsible for iron uptake and storage in the co-cultured SH-SY5Y cells. Real-time PCR was performed with SYBR green protocol using gene-specific primers. The β-actin was used as housekeeping gene for the normalisation and the relative expression of the controls was considered as 1. Pelleted SH-SY5Y cells from the co-cultures were lysed and protein contents of the samples were measured. The same amount of protein (15 µg) from each sample was loaded onto 12% SDS-PAGE and transferred by electro blotting to nitrocellulose membranes and was probed with DMT-1, FTH and FTMT polyclonal rabbit antibodies according to the manufacturer’s protocols. The β-actin was used as loading control. a Relative mRNA expression levels of DMT-1, FTH and FTMT. b Protein levels of DMT-1, FTH and FTMT showing increased expressions. c Optical densities of the Western blot analyses of the DMT-1, FTH and FTMT. The analyses were carried out using ImageJ software; the optical densities of investigated proteins were expressed as percentage of target protein/β-actin abundance. The bars represent mean values and error bars represent standard errors of the mean for three independent experiments. The asterisks mark p < 0.05 compared to the controls
Fig. 7 mRNA and Western blot analyses of genes responsible for iron uptake and storage in the co-cultured SH-SY5Y cells. Real-time PCR was performed with SYBR green protocol using gene-specific primers. The β-actin was used as housekeeping gene for the normalisation and the relative expression of the controls was considered as 1. Pelleted SH-SY5Y cells from the co-cultures were lysed and protein contents of the samples were measured. The same amount of protein (15 µg) from each sample was loaded onto 12% SDS-PAGE and transferred by electro blotting to nitrocellulose membranes and was probed with DMT-1, FTH and FTMT polyclonal rabbit antibodies according to the manufacturer’s protocols. The β-actin was used as loading control. a Relative mRNA expression levels of DMT-1, FTH and FTMT. b Protein levels of DMT-1, FTH and FTMT showing increased expressions. c Optical densities of the Western blot analyses of the DMT-1, FTH and FTMT. The analyses were carried out using ImageJ software; the optical densities of investigated proteins were expressed as percentage of target protein/β-actin abundance. The bars represent mean values and error bars represent standard errors of the mean for three independent experiments. The asterisks mark p < 0.05 compared to the controlsCC BY · PubMed Central
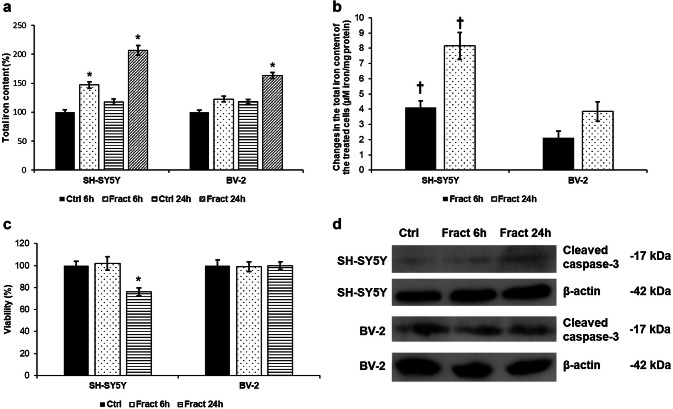
Fig. 8 Iron measurements and cell viability determinations of the co-cultured SH-SY5Y and BV-2 cells. Intracellular iron contents of SH-SY5Y and BV-2 cells were determined using a colorimetric ferrozine-based assay and were expressed as % of the controls. Changes in the intracellular iron contents of the fractalkine-treated cells were expressed as µM iron/mg protein. The values are calculated from the differences between the treated and the control cells. Viability of the SH-SY5Y cells was measured using CCK-8 cell viability assay after the separation of the two cells types from the treated co-cultures. Viability is expressed as percentile of the total cell number of the untreated control cells. a Comparison of the total iron contents of fractalkine-treated, co-cultured SH-SY5Y and BV-2 cells. b Comparison of the changes of the total iron contents of fractalkine-treated, co-cultured SH-SY5Y and BV-2 cells. c Cell viability measurements of co-cultured SH-SY5Y and BV-2 cells after fractalkine treatment. d Protein levels of cleaved-caspase-3 in co-cultured SH-SY5Y and BV-2 cells. The bars represent mean values and error bars represent standard errors of the mean (S.E.M.) for four independent experiments (n = 4). The asterisks indicate p < 0.05 compared to the controls, while crosses mark difference p < 0.05 between the two cell types
Fig. 8 Iron measurements and cell viability determinations of the co-cultured SH-SY5Y and BV-2 cells. Intracellular iron contents of SH-SY5Y and BV-2 cells were determined using a colorimetric ferrozine-based assay and were expressed as % of the controls. Changes in the intracellular iron contents of the fractalkine-treated cells were expressed as µM iron/mg protein. The values are calculated from the differences between the treated and the control cells. Viability of the SH-SY5Y cells was measured using CCK-8 cell viability assay after the separation of the two cells types from the treated co-cultures. Viability is expressed as percentile of the total cell number of the untreated control cells. a Comparison of the total iron contents of fractalkine-treated, co-cultured SH-SY5Y and BV-2 cells. b Comparison of the changes of the total iron contents of fractalkine-treated, co-cultured SH-SY5Y and BV-2 cells. c Cell viability measurements of co-cultured SH-SY5Y and BV-2 cells after fractalkine treatment. d Protein levels of cleaved-caspase-3 in co-cultured SH-SY5Y and BV-2 cells. The bars represent mean values and error bars represent standard errors of the mean (S.E.M.) for four independent experiments (n = 4). The asterisks indicate p < 0.05 compared to the controls, while crosses mark difference p < 0.05 between the two cell typesCC BY · PubMed Central
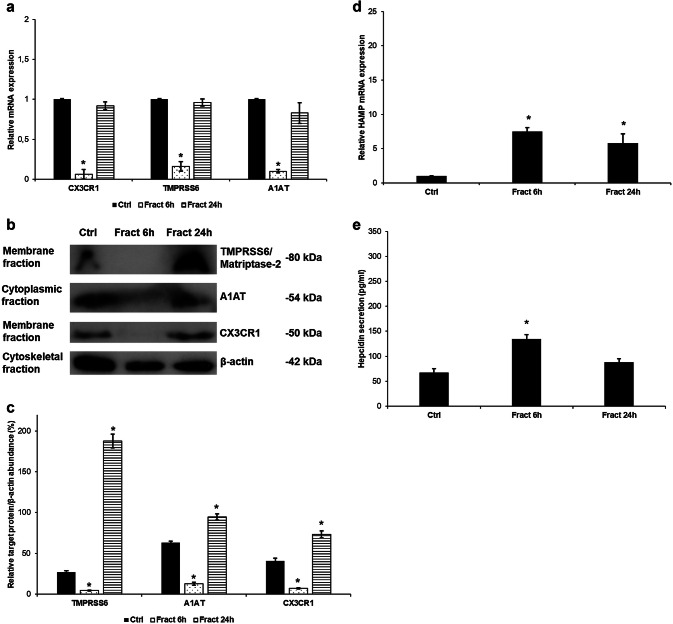
Fig. 9 Effect of fractalkine on BV-2 monocultures. Real-time PCR was performed with SYBR green protocol using gene-specific primers. The β-actin was used as housekeeping gene for the normalisation and the relative expression of the controls was considered as 1. Pelleted BV-2 cells were fractionated and protein contents of the fractions were measured. The same amount of protein (15 µg) from each sample was loaded onto 12% SDS-PAGE and transferred to nitrocellulose membranes and was probed with CX3CR1, TMPRSS6 and A1AT polyclonal rabbit antibodies according to the manufacturer’s protocols. The β-actin was used as the loading control. Secreted hepcidin was quantified with ELISA kit according to the manufacturer’s instructions. a Relative mRNA expression levels of CX3CR1 and the negative hepcidin regulators TMPRSS6 and A1AT. b Protein levels of TMPRSS6, A1AT and CX3CR1. c Optical densities of the Western blot analyses of TMPRSS6, A1AT and CX3CR1. The analyses were done using ImageJ software; the optical density of the examined proteins was expressed as percentage of target protein/β-actin abundance. d Relative HAMP mRNA expression of the fractalkine-treated BV-2 cells. e Hepcidin secretion of the fractalkine-treated BV-2 cells. The bars represent mean values and error bars represent standard errors of the mean (SEM) for three independent experiments (n = 3 in each experiment). The asterisks indicate p < 0.05 compared to the controls
Fig. 9 Effect of fractalkine on BV-2 monocultures. Real-time PCR was performed with SYBR green protocol using gene-specific primers. The β-actin was used as housekeeping gene for the normalisation and the relative expression of the controls was considered as 1. Pelleted BV-2 cells were fractionated and protein contents of the fractions were measured. The same amount of protein (15 µg) from each sample was loaded onto 12% SDS-PAGE and transferred to nitrocellulose membranes and was probed with CX3CR1, TMPRSS6 and A1AT polyclonal rabbit antibodies according to the manufacturer’s protocols. The β-actin was used as the loading control. Secreted hepcidin was quantified with ELISA kit according to the manufacturer’s instructions. a Relative mRNA expression levels of CX3CR1 and the negative hepcidin regulators TMPRSS6 and A1AT. b Protein levels of TMPRSS6, A1AT and CX3CR1. c Optical densities of the Western blot analyses of TMPRSS6, A1AT and CX3CR1. The analyses were done using ImageJ software; the optical density of the examined proteins was expressed as percentage of target protein/β-actin abundance. d Relative HAMP mRNA expression of the fractalkine-treated BV-2 cells. e Hepcidin secretion of the fractalkine-treated BV-2 cells. The bars represent mean values and error bars represent standard errors of the mean (SEM) for three independent experiments (n = 3 in each experiment). The asterisks indicate p < 0.05 compared to the controlsCC BY · PubMed Central
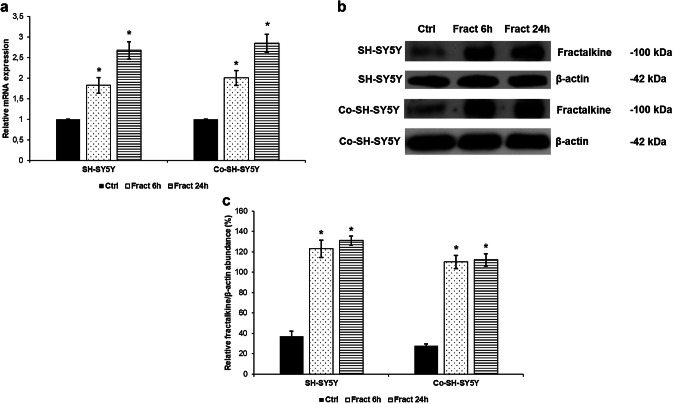
Fig. 10 mRNA and Western blot analyses of fractalkine in the fractalkine-treated mono- and co-cultured SH-SY5Y cells. Real-time PCR was performed with SYBR green protocol using gene specific primers. The β-actin was used as housekeeping gene for the normalisation and the relative expression of the controls was considered as 1. Pelleted SH-SY5Y cells were lysed and protein contents of the samples were measured. The same amount of protein (15 µg) from each sample was loaded onto 10% SDS-PAGE and transferred by electro blotting to nitrocellulose membranes and was probed with fractalkine polyclonal rabbit antibodies according to the manufacturer’s protocol. The β-actin was used as loading control. a Relative mRNA expression levels of fractalkine in mono-and co-cultured SH-SY5Y cells. b Protein levels of fractalkine in fractalkine-treated SH-SY5Y cells. c Optical densities of the Western blot analysis of fractalkine. The analysis was carried out using ImageJ software, the optical density of the investigated protein was expressed as percentage of fractalkine protein/β-actin abundance. The bars represent mean values and error bars represent standard errors of the mean (SEM) for three independent experiments (n = 3). The asterisks mark p < 0.05 compared to the controls
Fig. 10 mRNA and Western blot analyses of fractalkine in the fractalkine-treated mono- and co-cultured SH-SY5Y cells. Real-time PCR was performed with SYBR green protocol using gene specific primers. The β-actin was used as housekeeping gene for the normalisation and the relative expression of the controls was considered as 1. Pelleted SH-SY5Y cells were lysed and protein contents of the samples were measured. The same amount of protein (15 µg) from each sample was loaded onto 10% SDS-PAGE and transferred by electro blotting to nitrocellulose membranes and was probed with fractalkine polyclonal rabbit antibodies according to the manufacturer’s protocol. The β-actin was used as loading control. a Relative mRNA expression levels of fractalkine in mono-and co-cultured SH-SY5Y cells. b Protein levels of fractalkine in fractalkine-treated SH-SY5Y cells. c Optical densities of the Western blot analysis of fractalkine. The analysis was carried out using ImageJ software, the optical density of the investigated protein was expressed as percentage of fractalkine protein/β-actin abundance. The bars represent mean values and error bars represent standard errors of the mean (SEM) for three independent experiments (n = 3). The asterisks mark p < 0.05 compared to the controlsCC BY · PubMed Central
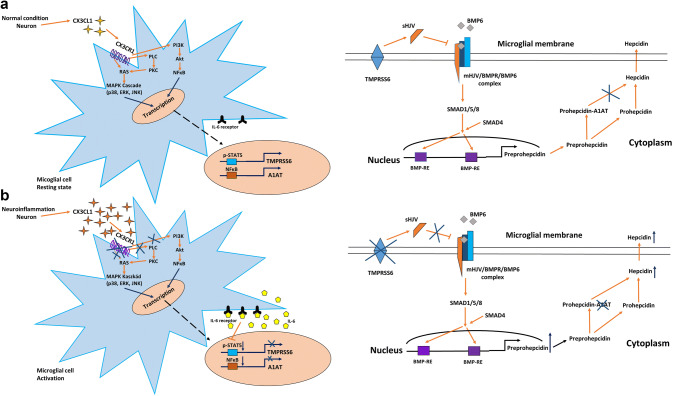
Fig. 11 Regulation of HAMP mRNA expression and hepcidin maturation/secretion in microglia through activation/internalisation of CX3CR1 receptor at a normal and b inflammatory conditions. The key molecule of hepcidin regulation is CX3CR1 which controls cell signalling pathways that play a role in the transcriptional regulation of the two negative hepcidin regulators TMPRSS6 and A1AT. Internalisation of the receptor will cause the downregulation of TMPRSS6 and A1AT mRNA expressions and as a consequence HAMP transcriptional rate will decrease. Decreasing level of A1AT enhances prohepcidin–hepcidin conversion. For further explanation, see discussion section
Fig. 11 Regulation of HAMP mRNA expression and hepcidin maturation/secretion in microglia through activation/internalisation of CX3CR1 receptor at a normal and b inflammatory conditions. The key molecule of hepcidin regulation is CX3CR1 which controls cell signalling pathways that play a role in the transcriptional regulation of the two negative hepcidin regulators TMPRSS6 and A1AT. Internalisation of the receptor will cause the downregulation of TMPRSS6 and A1AT mRNA expressions and as a consequence HAMP transcriptional rate will decrease. Decreasing level of A1AT enhances prohepcidin–hepcidin conversion. For further explanation, see discussion sectionCC BY · PubMed Central
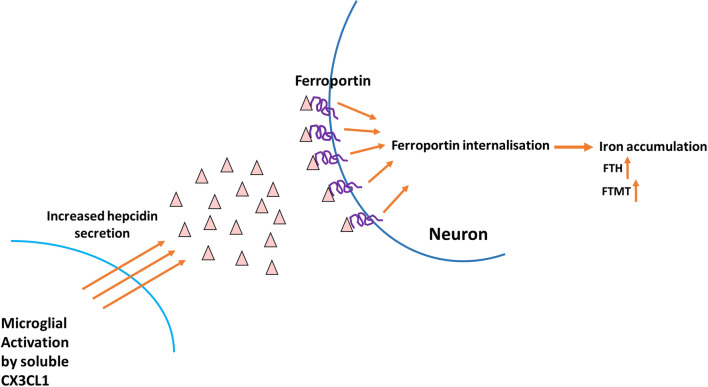
Fig. 12 Effect of microglial hepcidin on differentiated SH-SY5Y cells. Secreted microglial hepcidin binds to its cognate receptor ferroportin expressed by SH-SY5Y cells. Upon hepcidin binding ferroportin is internalised reducing iron release and increasing iron retention. FTH and FTMT expression levels increased, suggesting iron accumulation
Fig. 12 Effect of microglial hepcidin on differentiated SH-SY5Y cells. Secreted microglial hepcidin binds to its cognate receptor ferroportin expressed by SH-SY5Y cells. Upon hepcidin binding ferroportin is internalised reducing iron release and increasing iron retention. FTH and FTMT expression levels increased, suggesting iron accumulationCC BY · PubMed Central

Verification

Claims the paper makes

The claims and statistics of this paper haven’t been checked yet.

Run the check — free, no account needed. It reads the open-access text and checks the sources it cites.

A few free checks a day · papers already verified open instantly · results are public

Claims other papers make about this one

Each is checked against this paper’s own text: does it say what the citing paper says it does?

Self-check

Percentages, sums and reported differences re-computed from the paper’s own numbers.

The self-check needs the paper’s full text.

Citations

Cites

Show all 15 references

Research works printed but not linked: 66

  1. Aguirre P, Mena N, Tapia V, Arredondo M, Núñez MT (2005) Iron homeostasis in neuronal cells: a role for IREG1. BMC Neurosci 6:3 · DOI
  2. Bishop GM, Dang TN, Dringen R, Robinson SR (2011) Accumulation of non-transferrin-bound iron by neurons, astrocytes, and microglia. Neurotox Res 19:443–451 · DOI
  3. Bureau G, Longpre F, Martinoli MG (2008) Resveratrol and quercetin, two natural polyphenols, reduce apoptotic neuronal cell death induced by neuroinflammation. J Neurosci Res 86:403–410 · DOI
  4. Clark AK, Gentry C, Bradbury EJ, McMahon SB, Malcangio M (2007) Role of spinal microglia in rat models of peripheral nerve injury and inflammation. Eur J Pain 11:223–230 · DOI
  5. Cook A, Hippensteel R, Shimizu S, Nicolai J, Fatatis A, Meucci O (2010) Interactions between chemokines: regulation of fractalkine/CX3CL1 homeostasis by SDF/CXCL12 in cortical neurons. J Biol Chem 285:10563–71051 · DOI
  6. Cotter R, Williams C, Ryan L, Erichsen D, Lopez A, Peng H, Zheng J (2002) Fractalkine (CX3CL1) and brain inflammation: Implications for HIV-1-associated dementia. J Neurovirol 8:585–598 · DOI
  7. De Domenico I, Ward DM, Kaplan J (2007) Hepcidin regulation: ironing out the details. J Clin Invest 117:1755–1758 · DOI
  8. Du F, Qian ZM, Luo Q, Yung WH, Ke Y (2015) Hepcidin suppresses brain iron accumulation by downregulating iron transport proteins in iron-overloaded rats. Mol Neurobiol 52:101–114 · DOI
  9. Finberg KE, Whittlesey RL, Fleming MD, Andrews NC (2010) Down-regulation of Bmp/Smad signaling by Tmprss6 is required for maintenance of systemic iron homeostasis. Blood 115:3817–3826 · DOI
  10. Ganz T (2018) Erythropoietic regulators of iron metabolism. Free Radic Biol Med S0891–5849:31188–31192
  11. Hadzhieva M, Kirches E, Mawrin C (2014) Review: iron metabolism and the role of iron in neurodegenerative disorders. Neuropathol Appl Neurobiol 40:240–257 · DOI
  12. Haider L (2015) Inflammation, iron, energy failure, and oxidative stress in the pathogenesis of multiple sclerosis. Oxid Med Cell Longev 2015:725370 · DOI
  13. Harrison JK, Jiang Y, Chen S, Xia Y, Maciejewski D, McNamara RK, Streit WJ, Salafranca MN, Adhikari S, Thompson DA, Botti P, Bacon KB, Feng L (1998) Role for neuronally derived fractalkine in mediating interactions between neurons and CX3CR17-expressing microglia. Proc Natl Acad Sci U S A 95:10896–10901 · DOI · Paper page
  14. Huang H, Constante M, Layoun A, Santos MM (2009) Contribution of STAT3 and SMAD4 pathways to the regulation of hepcidin by opposing stimuli. Blood 113:3593–3599 · DOI
  15. Hundhausen C, Misztela D, Berkhout TA, Broadway N, Saftig P, Reiss K, Hartmann D, Fahrenholz F, Postina R, Matthews V, Kallen KJ, Rose-John S, Ludwig A (2003) The disintegrin-like metalloproteinase ADAM10 is involved in constitutive cleavage of CX3CL1 (fractalkine) and regulates CX3CL1-mediated cell-cell adhesion. Blood 102:1186–1195 · DOI
  16. Ke Y, Ming Qian Z (2003) Iron misregulation in the brain: a primary cause of neurodegenerative disorders. Lancet Neurol 2:246–253 · DOI
  17. Korzus E, Nagase H, Rydell R, Travis J (1997) The mitogen-activated protein kinase and JAK-STAT signaling pathways are required for an oncostatin M-responsive element-mediated activation of matrix metalloproteinase 1 gene expression. J Biol Chem 272:1188–1196 · DOI
  18. Lauro C, Catalano M, Trettel F, Limatola C (2015) Fractalkine in the nervous system: neuroprotective or neurotoxic molecule? Ann N Y Acad Sci 1351:141–148 · DOI
  19. Lee S, Xu G, Jay TR, Bhatta S, Kim KW, Jung S, Landreth GE, Ransohoff RM, Lamb BT (2014) Opposing effects of membrane-anchored CX3CL1 on amyloid and tau pathologies via the p38 MAPK pathway. J Neurosci 34:12538–12546 · DOI · Paper page
  20. Leonardi-Essmann F, Emig M, Kitamura Y, Spanagel R, Gebicke-Haerter PJ (2005) Fractalkine-upregulated milk-fat globule EGF factor-8 protein in cultured rat microglia. J Neuroimmunol 160:92–101 · DOI
  21. Li K, Reichmann H (2016) Role of iron in neurodegenerative diseases. J Neural Transm (Vienna) 123:389–399 · DOI
  22. Lu H, Lian L, Shi D, Zhao H, Dai Y (2015) Hepcidin promotes osteogenic differentiation through the bone morphogenetic protein 2/small mothers against decapentaplegic and mitogen-activated protein kinase/P38 signaling pathways in mesenchymal stem cells. Mol Med Rep 11:143–150 · DOI
  23. Meynard D, Sun CC, Wu Q, Chen W, Chen S, Nelson CN, Waters MJ, Babitt JL, Lin HY (2013) Inflammation regulates TMPRSS6 expression via STAT5. PLoS ONE 8:e82127 · DOI
  24. Milligan E, Zapata V, Schoeniger D, Chacur M, Green P, Poole S, Martin D, Maier SF, Watkins LR (2005) An initial investigation of spinal mechanisms underlying pain enhancement induced by fractalkine, a neuronally released chemokine. Eur J Neurosci 22:2775–2782 · DOI
  25. Mizuno T, Kawanokuchi J, Numata K, Suzumura A (2003) Production and neuroprotective functions of fractalkine in the central nervous system. Brain Res 979:65–70 · DOI
  26. Morganti JM, Nash KR, Grimmig BA, Ranjit S, Small B, Bickford PC, Gemma C (2012) The soluble isoform of CX3CL1 is necessary for neuroprotection in a mouse model of Parkinson’s disease. J Neurosci 32:14592–14601 · DOI
  27. Muckenthaler MU (2008) Fine tuning of hepcidin expression by positive and negative regulators. Cell Metab 8:1–3 · DOI · Paper page
  28. Neiva I, Malva JO, Valero J (2014) Can we talk about microglia without neurons? A discussion of microglial cell autonomous properties in culture. Front Cell Neurosci 8:202 · DOI
  29. Nemeth E, Tuttle MS, Powelson J, Vaughn MB, Donovan A, Ward DM, Ganz T, Kaplan J (2004) Hepcidin regulates cellular iron efflux by binding to ferroportin and inducing its internalization. Science 306:2090–2093 · DOI · Paper page
  30. Nie G, Sheftel AD, Kim SF, Ponka P (2005) Overexpression of mitochondrial ferritin causes cytosolic iron depletion and changes cellular iron homeostasis. Blood 105:2161–2167 · DOI
  31. Núñez MT, Urrutia P, Mena N, Aguirre P, Tapia V, Salazar J (2012) Iron toxicity in neurodegeneration. Biometals 25:761–776 · DOI
  32. Ong WY, Farooqui AA (2005) Iron, neuroinflammation, and Alzheimer’s disease. J Alzheimers Dis 8:183–200 · DOI
  33. Pan Y, Sun L, Wang J, Fu W, Fu Y, Wang J, Tong Y, Pan B (2014) STI571 protects neuronal cells from neurotoxic prion protein fragment-induced apoptosis. Neuropharmacology 93:191–198 · DOI · Paper page
  34. Pan B, Yang L, Wang J, Wang Y, Wang J, Zhou X, Yin X, Zhang Z, Zhao D (2015) C-Abl tyrosine kinase mediates neurotoxic prion peptide-induced neuronal apoptosis via regulating mitochondrial homeostasis. Mol Neurobiol 49:1102–1116 · DOI · Paper page
  35. Pan B, Zhang H, Cui T, Wang X (2017) TFEB activation protects against cardiac proteotoxicity via increasing autophagic flux. J Mol Cell Cardiol 113:51–62 · DOI
  36. Pandur E, Nagy J, Poór VS, Sarnyai A, Huszár A, Miseta A, Sipos K (2009) Alpha-1 antitrypsin binds preprohepcidin intracellularly and prohepcidin in the serum. FEBS J 276:2012–2021 · DOI
  37. Pandur E, Varga E, Tamási K, Pap R, Nagy J, Sipos K (2019) Effect of inflammatory mediators lipopolysaccharide and lipoteichoic acid on iron metabolism of differentiated SH-SY5Y cells alters in the presence of BV-2 microglia. Int J Mol Sci 20:E17 · DOI
  38. Paolicelli RC, Bolasco G, Pagani F, Maggi L, Scianni M, Panzanelli P, Giustetto M, Ferreira TA, Guiducci E, Dumas L, Ragozzino D, Gross CT (2011) Synaptic pruning by microglia is necessary for normal brain development. Science 333:1456–1458 · DOI · Paper page
  39. Paolicelli RC, Bisht K, Tremblay MÈ (2014) Fractalkine regulation of microglial physiology and consequences on the brain and behavior. Front Cell Neurosci 8:129 · DOI
  40. Pastore N, Ballabio A, Brunetti-Pierri N (2013) Autophagy master regulator TFEB induces clearance of toxic SERPINA1/α-1-antitrypsin polymers. Autophagy 9:1094–1096 · DOI
  41. Raha AA, Vaishnav RA, Friedland RP, Bomford A, Raha-Chowdhury R (2013) The systemic iron-regulatory proteins hepcidin and ferroportin are reduced in the brain in Alzheimer’s disease. Acta Neuropathol Commun 1:55 · DOI
  42. Ramsay AJ, Hooper JD, Folgueras AR, Velasco G, López-Otín C (2009) Matriptase-2 (TMPRSS6): a proteolytic regulator of iron homeostasis. Haematologica 94:840–849 · DOI
  43. Ray A, Gao X, Ray BK (1995) Role of a distal enhancer containing a functional NF-kappa B-binding site in lipopolysaccharide-induced expression of a novel alpha 1-antitrypsin gene. J Biol Chem 270:29201–29208 · DOI
  44. Ré DB, Przedborski S (2006) Fractalkine: moving from chemotaxis to neuroprotection. Nat Neurosci 9:859–861 · DOI
  45. Riemer J, Hoepken HH, Czerwinska H, Robinson SR, Dringen R (2004) Colorimetric ferrozine-based assay for the quantitation of iron in cultured cells. Anal Biochem 331:370–375 · DOI
  46. Rishi G, Wallace DF, Subramaniam VN (2015) Hepcidin: regulation of the master iron regulator. Biosci Rep 35:e00192 · DOI · Paper page
  47. Rostene W, Buckingham JC (2007) Chemokines as modulators of neuroendocrine functions. J Mol Endocrinol 38:351–353 · DOI
  48. Sangkhae V, Nemeth E (2017) Regulation of the iron homeostatic hormone hepcidin. Adv Nutr 8:126–136 · DOI
  49. Santambrogio P, Erba BG, Campanella A, Cozzi A, Causarano V, Cremonesi L, Gallì A, Della Porta MG, Invernizzi R, Levi S (2011) Over-expression of mitochondrial ferritin affects the JAK2/STAT5 pathway in K562 cells and causes mitochondrial iron accumulation. Haematologica 96:1424–1432 · DOI
  50. Schmidt PJ (2015) Regulation of iron metabolism by hepcidin under conditions of inflammation. J Biol Chem 290:18975–18983 · DOI
  51. Shan S, Hong-Min T, Yi F, Jun-Peng G, Yue F, Yan-Hong T, Yun-Ke Y, Wen-Wei L, Xiang-Yu W, Jun M, Guo-Hua W, Ya-Ling H, Hua-Wei L, Ding-Fang C (2011) New evidences for fractalkine/CX3CL1 involved in substantia nigral microglial activation and behavioral changes in a rat model of Parkinson’s disease. Neurobiol Aging 32:443–458 · DOI
  52. Shen Y, Schlessinger K, Zhu X, Meffre E, Quimby F, Levy DE, Darnell JE Jr (2004) Essential role of STAT3 in postnatal survival and growth revealed by mice lacking STAT3 serine 727 phosphorylation. Mol Cell Biol 24:407–419 · DOI · Paper page
  53. Sheridan GK, Murphy KJ (2013) Neuron-glia crosstalk in health and disease: fractalkine and CX3CR62 take centre stage. Open Biol 3:130181 · DOI
  54. Sonnweber T, Nachbaur D, Schroll A, Nairz M, Seifert M, Demetz E, Haschka D, Mitterstiller AM, Kleinsasser A, Burtscher M, Trübsbach S, Murphy AT, Wroblewski V, Witcher DR, Mleczko-Sanecka K, Vecchi C, Muckenthaler MU, Pietrangelo A, Theurl I, Weiss G (2014) Hypoxia induced downregulation of hepcidin is mediated by platelet derived growth factor BB. Gut 63:1951–1959 · DOI · Paper page
  55. Szepesi Z, Manouchehrian O, Bachiller S, Deierborg T (2018) Bidirectional microglia-neuron communication in health and disease. Front Cell Neurosci 12:323 · DOI · Paper page
  56. Tarozzo G, Campanella M, Ghiani M, Bulfone A, Beltramo M (2002) Expression of fractalkine and its receptor, CX3CR65, in response to ischaemia-reperfusion brain injury in the rat. Eur J Neurosci 15:1663–1668 · DOI
  57. Urrutia P, Aguirre P, Esparza A, Tapia V, Mena NP, Arredondo M, González-Billault C, Núñez MT (2013) Inflammation alters the expression of DMT1, FPN1 and hepcidin, and it causes iron accumulation in central nervous system cells. J Neurochem 126:541–549 · DOI · Paper page
  58. Urrutia PJ, Mena NP, Núñez MT (2014) The interplay between iron accumulation, mitochondrial dysfunction, and inflammation during the execution step of neurodegenerative disorders. Front Pharmacol 5:38 · DOI
  59. Urrutia PJ, Hirsch EC, González-Billault C, Núñez MT (2017) Hepcidin attenuates amyloid beta-induced inflammatory and pro-oxidant responses in astrocytes and microglia. J Neurochem 142:140–152 · DOI
  60. Vela D (2018a) The dual role of hepcidin in brain iron load and inflammation. Front Neurosci 12:740 · DOI
  61. Vela D (2018b) Hepcidin, an emerging and important player in brain iron homeostasis. J Transl Med 16:25 · DOI
  62. Wang SM, Fu LJ, Duan XL, Crooks DR, Yu P, Qian ZM, Di XJ, Li J, Rouault TA, Chang YZ (2010) Role of hepcidin in murine brain iron metabolism. Cell Mol Life Sci 67:123–133 · DOI
  63. Ward RJ, Zucca FA, Duyn JH, Crichton RR, Zecca L (2014) The role of iron in brain ageing and neurodegenerative disorders. Lancet Neurol 13:1045–1060 · DOI · Paper page
  64. Wen Z, Darnell JE Jr (1997) Mapping of Stat3 serine phosphorylation to a single residue (727) and evidence that serine phosphorylation has no influence on DNA binding of Stat1 and Stat3. Nucleic Acids Res 25:2062–2067 · DOI
  65. Zechel S, Huber-Wittmer K, von Bohlen und Halbach O (2006) Distribution of the iron-regulating protein hepcidin in the murine central nervous system. J Neurosci Res 84:790–800 · DOI
  66. Zhang Y, Yan J, Hu R, Sun Y, Ma Y, Chen Z, Jiang H (2015) Microglia are involved in pruritus induced by DNFB via the CX3CR81/p38 MAPK pathway. Cell Physiol Biochem 35:1023–1033 · DOI

Cited by

Sorted by citations

Metadata

Authors
Pandur, E., Tamási, K., Pap, R., Varga, E., Miseta, A., & Sipos, K.
Venue
Cellular and Molecular Neurobiology
Published
2019-06-06
Volume
39
Issue
7
Pages
985-1001
ISSN
  • 0272-4340
  • 1573-6830
Cited by
37
References
15
Language
en

About these checks

Registry, retraction, Cites and statistics results are computed, not judged, with one exception: a printed reference that no index lists is read once by a model before it counts as a citation error. Claims are extracted by a model and kept only when their quote appears verbatim in the text; each cited source is then checked, with a model’s help, for whether it says what the claim relies on. Those verdicts can be wrong — read the claim’s quote and the cited source before relying on one.

Statistics and arithmetic are recomputed, not judged.

Confidence bands are shown only for fields calibrated on our annotated test set. None is calibrated yet, so no band is shown.

What counts as a claim ›How we measure confidence ›How we check this ›

Are you an author, or do you see a problem with this page? Request a review