

The DOI matches its Crossref record; 71 of the 72 references it cites were found in a registry or an index.
Rate-Limiting Steps in Yeast Protein Translation
Open accessAbstract
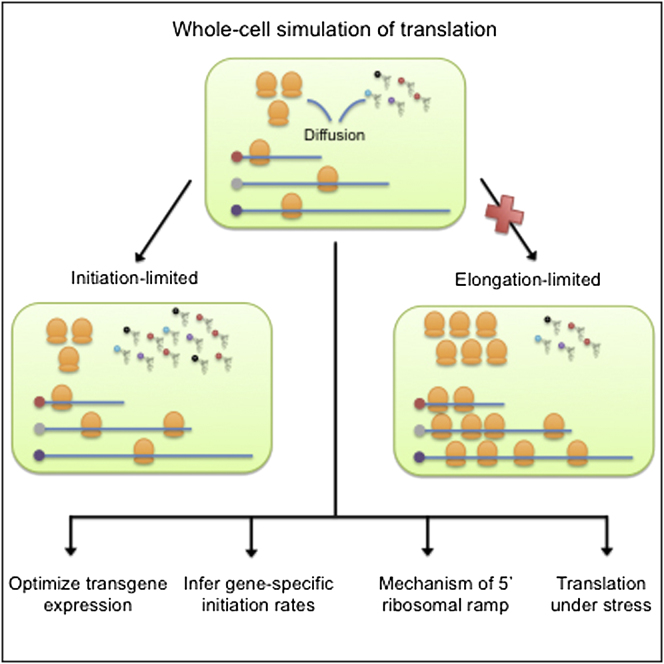
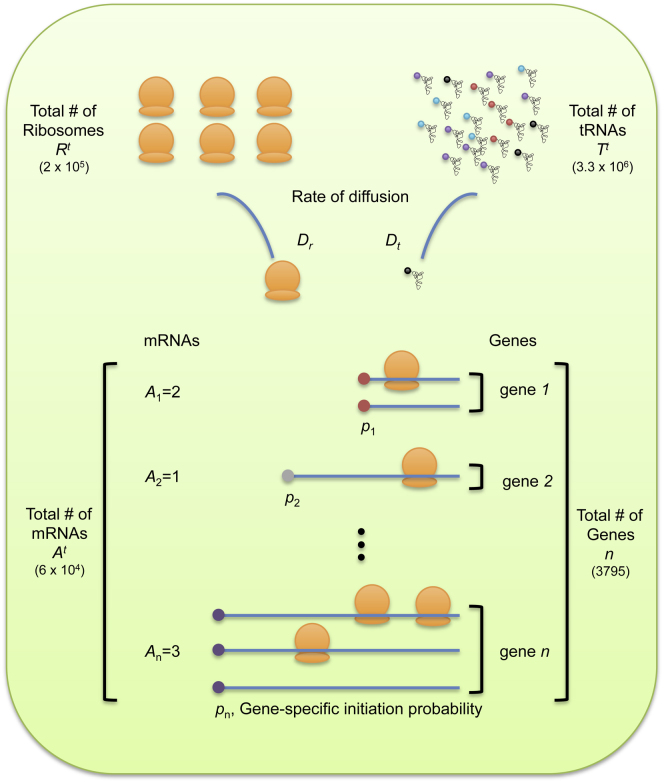
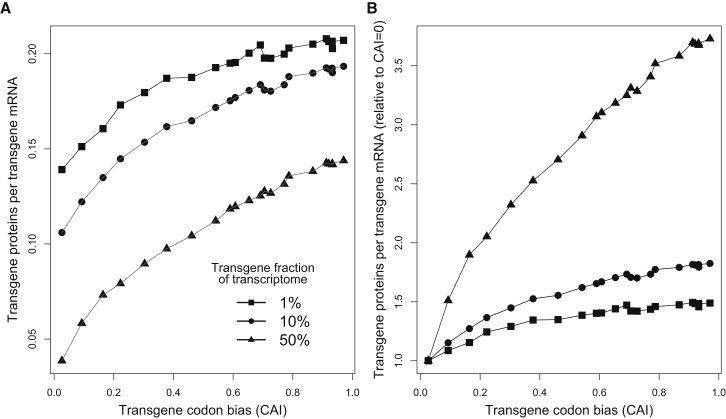
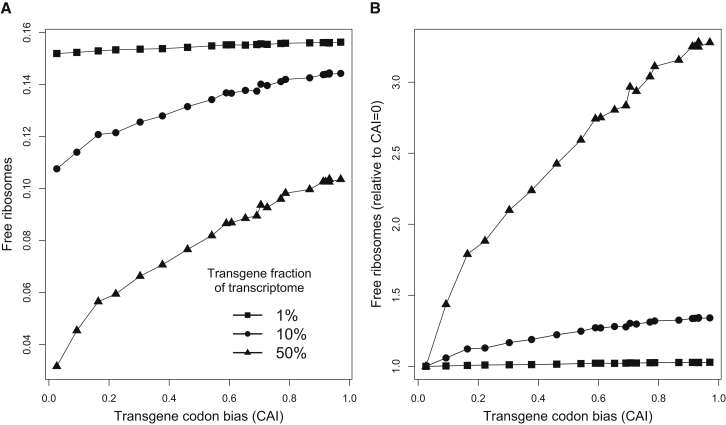
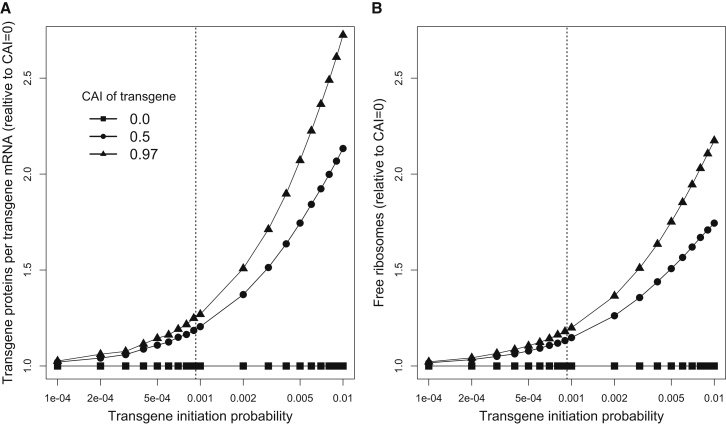
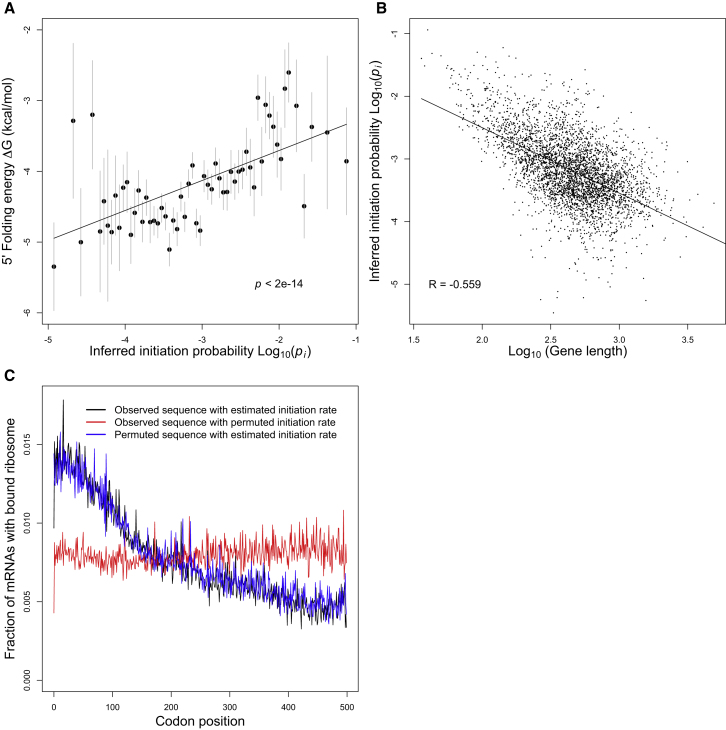
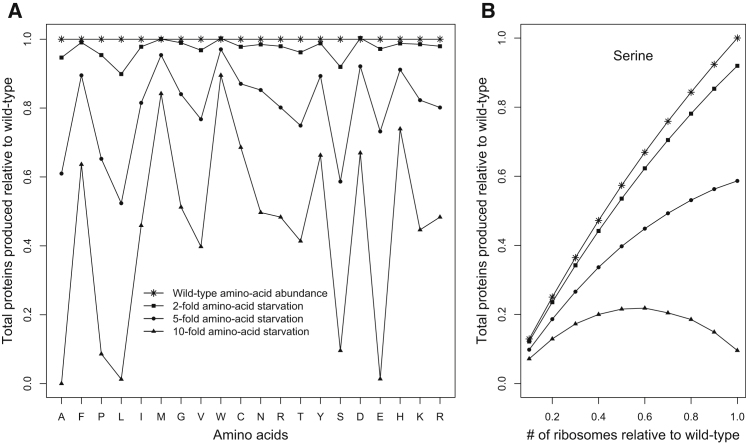
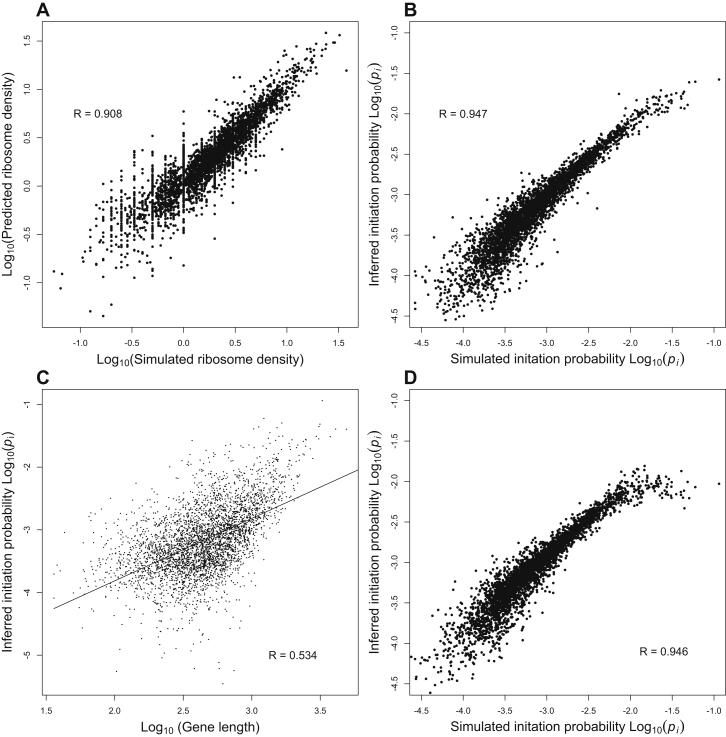
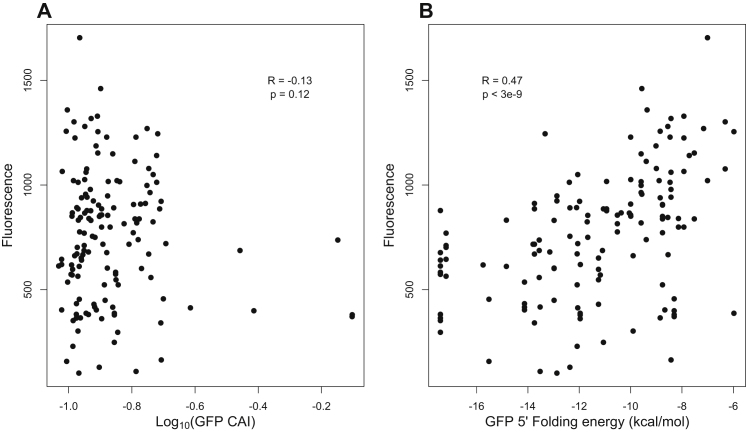
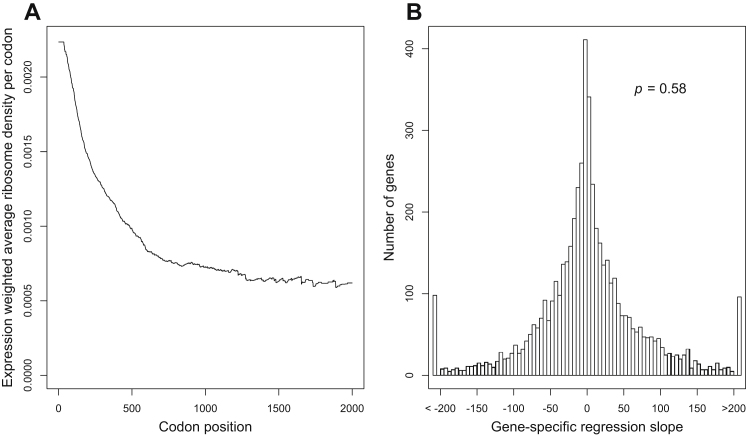
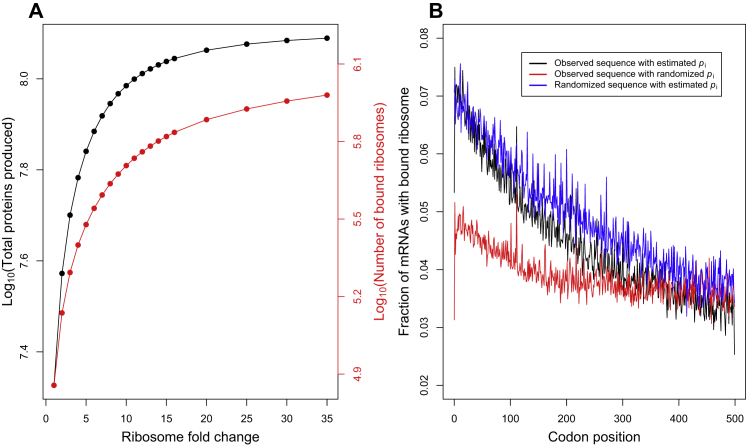
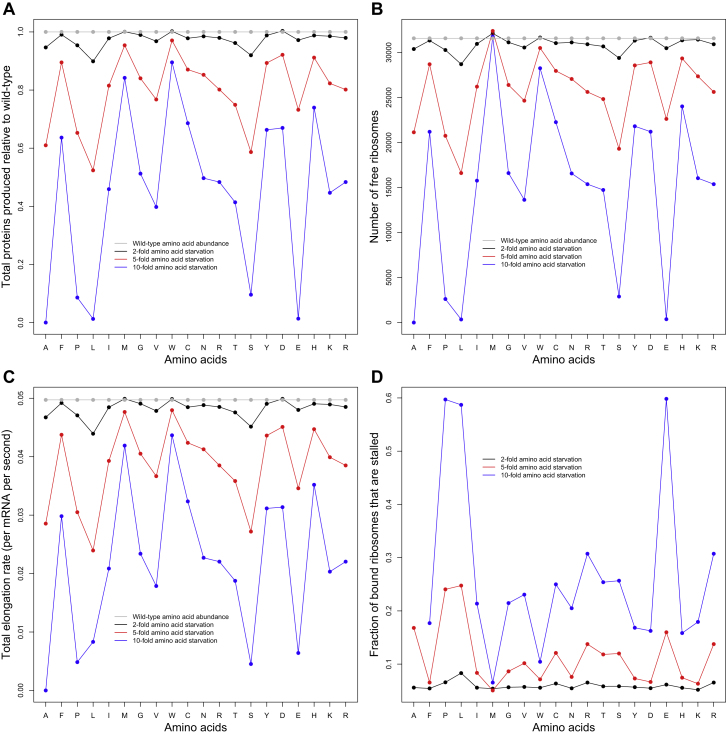
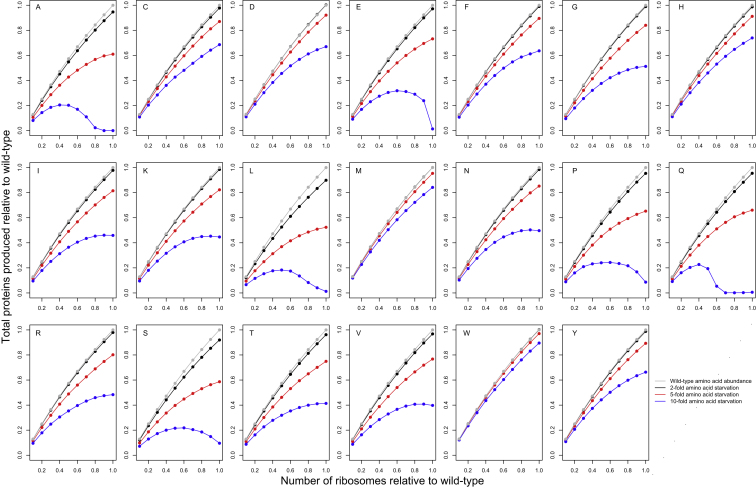
Deep sequencing now provides detailed snapshots of ribosome occupancy on mRNAs. We leverage these data to parameterize a computational model of translation, keeping track of every ribosome, tRNA, and mRNA molecule in a yeast cell. We determine the parameter regimes in which fast initiation or high codon bias in a transgene increases protein yield and infer the initiation rates of endogenous Saccharomyces cerevisiae genes, which vary by several orders of magnitude and correlate with 5' mRNA folding energies. Our model recapitulates the previously reported 5'-to-3' ramp of decreasing ribosome densities, although our analysis shows that this ramp is caused by rapid initiation of short genes rather than slow codons at the start of transcripts. We conclude that protein production in healthy yeast cells is typically limited by the availability of free ribosomes, whereas protein production under periods of stress can sometimes be rescued by reducing initiation or elongation rates.
Overview
The claims and statistics of this paper haven’t been checked yet.
Run the check — free, no account needed. It reads the open-access text and checks the sources it cites.
Integrity signals
Registry
Cites
Statistics
Figures
Verification
Claims the paper makes
The claims and statistics of this paper haven’t been checked yet.
Run the check — free, no account needed. It reads the open-access text and checks the sources it cites.
Claims other papers make about this one
Each is checked against this paper’s own text: does it say what the citing paper says it does?
The source backs part of the claim, not all of it — or backs it for a different population, condition or comparison.
In the citing paper
“Some studies have shown that protein expression level drops if the 5′-end leader region has more secondary structure5,50–53.”
From Algorithm for optimized mRNA design improves stability and immunogenicity (2023) · cites this paper as [52]
Experimental — accuracy not yet measuredThe cited source says what the claim attributes to it.
In the citing paper
“Most surprising, in contrast to previous reports47–49, we found 5’ UTRs that are highly structured, such as the dengue virus (DEN2), can support efficient translation.”
From Combinatorial optimization of mRNA structure, stability, and translation for RNA-based therapeutics (2022) · cites this paper as [49]
Self-check
Percentages, sums and reported differences re-computed from the paper’s own numbers.
The self-check needs the paper’s full text.
Citations
Cites
Exact stochastic simulation of coupled chemical reactions
Gillespie, D. T. (1977) · The Journal of Physical Chemistry · doi:10.1021/j100540a008 · Cited by 10,215
Sharp, P. M., & Li, W.-H. (1987) · Nucleic Acids Research · doi:10.1093/nar/15.3.1281 · Cited by 3,992
Genome-Wide Analysis in Vivo of Translation with Nucleotide Resolution Using Ribosome Profiling
Ingolia, N. T., Ghaemmaghami, S., Newman, J. R. S., & Weissman, J. S. (2009) · Science · doi:10.1126/science.1168978 · Cited by 3,853
The mechanism of eukaryotic translation initiation and principles of its regulation
Jackson, R. J., Hellen, C. U. T., & Pestova, T. V. (2010) · Nature Reviews Molecular Cell Biology · doi:10.1038/nrm2838 · Cited by 2,759
A "Silent" Polymorphism in the MDR 1 Gene Changes Substrate Specificity
Kimchi-Sarfaty, C., Oh, J. M., Kim, I.-W., Sauna, Z. E., Calcagno, A. M., Ambudkar, S. V., & Gottesman, M. M. (2007) · Science · doi:10.1126/science.1135308 · Cited by 2,416
Fast folding and comparison of RNA secondary structures
Hofacker, I. L., Fontana, W., Stadler, P. F., Bonhoeffer, S., Tacker, M., & Schuster, P. M. (1994) · Monatshefte für Chemie - Chemical Monthly · doi:10.1007/bf00818163 · Cited by 2,314
The economics of ribosome biosynthesis in yeast
Warner, J. R. (1999) · Trends in Biochemical Sciences · doi:10.1016/s0968-0004(99)01460-7 · Cited by 1,933
The UCSC Genome Browser Database
Karolchik, D. (2003) · Nucleic Acids Research · doi:10.1093/nar/gkg129 · Cited by 1,890
Saccharomyces Genome Database: the genomics resource of budding yeast
Cherry, J., Hong, E., Amundsen, C., Balakrishnan, R., Binkley, G., Chan, E. T., Christie, K., Costanzo, M., Dwight, S., Engel, S., et al. (2011) · Nucleic Acids Res. · doi:10.1093/nar/gkr1029 · Cited by 1,886
Automated design of synthetic ribosome binding sites to control protein expression
Salis, H. M., Mirsky, E. A., & Voigt, C. A. (2009) · Nature Biotechnology · doi:10.1038/nbt.1568 · Cited by 1,844
Research works printed but not linked: 1
- Tuller, 2010, An evolutionarily conserved mechanism for controlling the efficiency of protein translation, Cell, 141, 344, 10.1016/j.cell.2010.03.031 · DOI · Paper page
Cited by
Sorted by citations
Items 401–463 of 463
Current and Emerging Therapies Targeting Translation
Galicia-Vázquez, G., & Pelletier, J. (2014) · Springer eBooks · doi:10.1007/978-94-017-9078-9_14
REDOX REGULATION OF PROTEIN TRANSLATION IN EUKARYOTES
Gerashchenko, M. V. (2014) · Lincoln (University of Nebraska)
Teng, T. (2013) · OhioLink ETD Center (Ohio Library and Information Network)
Engineering membrane proteins for production and topology
Toddo, S. (2015) · KTH Publication Database DiVA (KTH Royal Institute of Technology)
Dyken, J. D. V. (2016) · bioRxiv (Cold Spring Harbor Laboratory) · doi:10.1101/068510
Fluorescent Labeling, Co-Tracking, and Quantification of RNA In Cellulo.
Custer, T. (2016) · Deep Blue (University of Michigan)
Modulation of Translation Efficiency in S. cerevisiae by Codon Pairs and mRNA Structure
Gamble, C. E. (2016) · ResearchWorks at the University of Washington (University of Washington)
Tuning for light and more : engineering phototrophy and membrane proteins in Escherichia coli
Claassens, N. J. (2017) · doi:10.18174/405559 · Cited by 1
Ribosome Processivity and Co-translational Protein Folding
Thommen, M. (2017) · eDiss (Georg-August-Universität Göttingen) · doi:10.53846/goediss-6242
Combinations of slow translating codon clusters can increase mRNA half-lifePreprint
Sharma, A. K., & O’Brien, E. P. (2018) · bioRxiv (Cold Spring Harbor Laboratory) · doi:10.1101/490995
“structure near the 5¢ UTR decreases translation-initiation rates (24, 25, 33).”
BackgroundSplicing buffers suboptimal codon usage in human cellsPreprint
Mordstein, C., Savisaar, R., Young, R. S., Bazile, J., Talmane, L., Luft, J., Liss, M. A., Taylor, M. S., Hurst, L. D., & Kudla, G. R. (2019) · bioRxiv (Cold Spring Harbor Laboratory) · doi:10.1101/527440
“In contrast to the results reported by us and others in bacteria and yeast (Goodman et al., 2013; Kudla et al., 2009; Shah et al., 2013), but consistently with the positive correlation between GC content and expression, strong mRNA folding near the beginning of the coding sequence correlated with…”
BackgroundResultSelf-citationRibosome profiling reveals post-transcriptional buffering of divergent gene expression in yeastPreprint
McManus, C. J., May, G. E., Spealman, P., & Shteyman, A. (2013) · arXiv (Cornell University) · doi:10.48550/arxiv.1312.1765
“This is consistent with the common model that yeast protein synthesis is largely regulated at the translation initiation step (Lackner et al. 2007; Sonenberg and Hinnebusch 2009; Shah et al. 2013).”
Ribosome Flow Model with Extended ObjectsPreprint
Zarai, Y., Michael Margaliot, A., & Tuller, T. (2017) · arXiv (Cornell University) · doi:10.48550/arxiv.1705.09347
“, [10], [55], [54], [7], [47], [12], [40], [69]).”
Visualizing mRNA quality control
Hoek, T. A. (2021) · doi:10.33540/625
The role of the coding sequence in regulating human mRNA stability
Narula, A. (2018) · TSpace (University of Toronto)
Excess ribosomal protein production unbalances translation in Fragile X SyndromePreprint
Seo, S. S., Louros, S. R., Anstey, N. J., Gonzalez‐Lozano, M. A., Harper, C. B., Verity, N., Dando, O., Thomson, S. R., Darnell, J. C., Kind, P. C., et al. (2022) · bioRxiv (Cold Spring Harbor Laboratory) · doi:10.1101/2022.04.07.487442
Županič, A., & Grellscheid, S. N. (2016) · Springer eBooks · doi:10.1007/978-3-319-31350-4_8
Faculty Opinions recommendation of A rare codon-based translational program of cell proliferation.
Hannenhalli, S. S. (2020) · Faculty Opinions – Post-Publication Peer Review of the Biomedical Literature · doi:10.3410/f.737448448.793579000
Johnson, A. M. (2019) · Faculty Opinions – Post-Publication Peer Review of the Biomedical Literature · doi:10.3410/f.732863257.793565434
Kimchi‐Sarfaty, C., Kames, J. M., & Katneni, U. (2020) · Faculty Opinions – Post-Publication Peer Review of the Biomedical Literature · doi:10.3410/f.737477385.793573044
Kimchi‐Sarfaty, C., & Kames, J. M. (2018) · Faculty Opinions – Post-Publication Peer Review of the Biomedical Literature · doi:10.3410/f.733575049.793551770
Kuroda, S., & Hironaka, K. (2019) · Faculty Opinions – Post-Publication Peer Review of the Biomedical Literature · doi:10.3410/f.734774279.793555453
Environment and the Evolutionary Trajectory of Horizontal Gene Transfer
Bhatia, R. P., Kirit, H. A., Lewis, C. M., Sankaranarayanan, K., & Bollback, J. P. (2022) · Access Microbiology · doi:10.1099/acmi.ac2021.po0142
Obermann, W., Azri, M. F. D., Konopka, L., Schmidt, N., Magari, F., Sherman, J., Silva, L. M. R., Hermosilla, C. R., Ludewig, A. H., Houhou, H., et al. (2022) · bioRxiv (Cold Spring Harbor Laboratory) · doi:10.1101/2022.09.09.507249
“Of the three steps that constitute translation—initiation, elongation and termination, initiation has garnered particular interest as a target for inhibiting translation in eukaryotic pathogens due to the diversity of factors involved in the process and its rate limiting effect on the overall translation process [5-7].”
BackgroundMangkalaphiban, K., Ganesan, R., & Jacobson, A. (2023) · bioRxiv (Cold Spring Harbor Laboratory) · doi:10.1101/2023.05.31.543082
Stochastic model for mRNA translation with applications to yeast
Brazil, M., Friend, K., LaRiviere, F. J., Mazilu, D., Mazilu, I., & Stoleriu, L. (2023) · AIP conference proceedings · doi:10.1063/5.0163740
(2023) · SciPost Physics Codebases · doi:10.21468/scipost.report.7842
(2023) · SciPost Physics Codebases · doi:10.21468/scipost.report.7843
Joiret, M., Kerff, F., Rapino, F. A., Close, P., & Geris, L. (2024) · Computational and Structural Biotechnology Journal · doi:10.1016/j.csbj.2024.05.045
“…the ribosome exit tunnel [10–12], mRNA secondary structure [13–15], proline residues at either A or P site of the ribosome [16,17], steric hindrance between contiguous ribosomes translating the same mRNA molecule [18], and the finite resource of the ribosome pool available in the cell [19–21].”
BackgroundHormone-regulated dynamics of mRNA distribution on ribosomes in Sertoli cellsPreprint
Leray, X., Morales, J., Trefier, A., Leon, K. E., Bourquard, T., Musnier, A., Pecnard, E., Drobecq, L., Boulben, S., Azzopardi, N., et al. (2024) · bioRxiv (Cold Spring Harbor Laboratory) · doi:10.1101/2024.12.20.629416
Daniels, K. G., Radrizzani, S., & Hurst, L. D. (2025) · NAR Genomics and Bioinformatics · doi:10.1093/nargab/lqaf086
5′ untranslated regions tune Toxoplasma translationPreprint
Peters, M. L., Shukla, A., Gotthold, Z. A., McCormick, D. M., Xiang, K., Bartel, D. P., & Lourido, S. (2025) · bioRxiv (Cold Spring Harbor Laboratory) · doi:10.1101/2025.07.14.664749
Single-mRNA imaging and modeling reveal coupled translation initiation and elongation ratesPreprint
Lamberti, I., Chao, J. A., Gobet, C., & Naef, F. (2025) · eLife · doi:10.7554/elife.107160 · Cited by 1
Single-mRNA imaging and modeling reveal coupled translation initiation and elongation ratesPreprint
Lamberti, I., Chao, J. A., Gobet, C., & Naef, F. (2025) · eLife · doi:10.7554/elife.107160.1 · Cited by 1
Multi-omic assessment of mRNA translation dynamics in liver cancer cell lines
González, A., Pandey, M., Schlusser, N., Rahaman, S., Ataman, M., Mittal, N., Schmidt, A., Becskei, A., & Zavolan, M. (2025) · Scientific Data · doi:10.1038/s41597-025-05861-5 · Cited by 1
“Its application in yeast has identified initiation as the major rate-limiting step of translation 19,21,22 , primarily influenced by features of the 5 ′ UTR that affect ribosome recruitment and scanning 23,24 .”
Integrated analysis of post-transcriptional regulations reveals insights into acute myeloid leukemia
Khadra, E., Iqbal, Z., Gall, M. L., Clary, G., Levavasseur, F., Tuerdi, Z., Dussiau, C., Rombaut, D., Templé, M., Friedrich, C., et al. (2025) · Communications Biology · doi:10.1038/s42003-025-09156-8
Stochastic Models of –1 Programmed Ribosomal Frameshifting
Bailey, B. L. (2014) · UA Campus Repository (The University of Arizona)
Witte, F., Ruiz‐Orera, J., Mattioli, C. C., Blachut, S., Adami, E., Schulz, J. F., Schneider-Lunitz, V., Hummel, O., Patone, G., Mücke, M. B., et al. (2021) · Figshare · doi:10.6084/m9.figshare.14870609
Additional file 1 of Current limitations in predicting mRNA translation with deep learning models
Schlusser, N., González, A., Pandey, M., & Zavolan, M. (2024) · Figshare · doi:10.6084/m9.figshare.26793712
Additional file 3 of Experimental determination of evolutionary barriers to horizontal gene transfer
Acar Kirit, H., Lagator, M., & Bollback, J. P. (2020) · Figshare · doi:10.6084/m9.figshare.13161440
Additional file 2 of Current limitations in predicting mRNA translation with deep learning models
Schlusser, N., González, A., Pandey, M., & Zavolan, M. (2024) · Figshare · doi:10.6084/m9.figshare.26793805
Witte, F., Ruiz‐Orera, J., Mattioli, C. C., Blachut, S., Adami, E., Schulz, J. F., Schneider-Lunitz, V., Hummel, O., Patone, G., Mücke, M. B., et al. (2021) · Figshare · doi:10.6084/m9.figshare.14870585
Xue, M., Dong, L., Zhang, H., Li, Y., Qiu, K., Zhao, Z., Gao, M., Han, L., Chan, A., Li, W., et al. (2024) · Figshare · doi:10.6084/m9.figshare.25132035
Sun, Y., Shao, X., Zhang, Y., Han, L., Huang, J., Xie, Y., Liu, J., & Deng, X. (2022) · Figshare · doi:10.6084/m9.figshare.20968113
Ribosome-associated quality control of aberrant protein production during amino acid limitationPreprint
Darnell, A. M., Chidley, C., Paradise, V., Cui, D. S., Davidsen, K., Lincoln, S. C., Abbott, K. L., Elbashir, R., Heiden, C. P. V., Sorger, P. K., et al. (2026) · bioRxiv (Cold Spring Harbor Laboratory) · doi:10.64898/2026.01.14.699605 · Cited by 1
Single-mRNA imaging and modeling reveal coupled translation initiation and elongation ratesPreprint
Lamberti, I., Chao, J. A., Gobet, C., & Naef, F. (2026) · eLife · doi:10.7554/elife.107160.2
UTR-DynaPro: a CNN–transformer multimodal language model for decoding 5′UTR regulatory mechanisms
Shen, H., Liu, S., Guo, F., Zhu, J., Meng, J., & Chen, J. (2026) · Scientific Reports · doi:10.1038/s41598-026-42175-x
N terminal wobble base usage determines ribosome loading and thus protein expression fatePreprint
Yu, H., Jiang, R., Zheng, Y., Wei, Y., Zhang, Z., Song, M., Yang, S., Wang, K., Du, Y., Zhou, Y., et al. (2026) · Research Square · doi:10.21203/rs.3.rs-8581843/v1
Identification de gènes candidats pour l'anémie de Blackfan-Diamond et caractérisation phénotypique
Saby, M. (2019) · theses.fr (ABES) · doi:10.70675/6af1f1f8za19cz47d2zb676zc0fece80504b
Study of regulatory factors of translation in Escherichia coli
Nguyen, H. L. (2019) · theses.fr (ABES) · doi:10.70675/db3173c3z33a7z411bzb16ez15631ed1cfbe
“From an evolutionary point of view, highly needed proteins such as ribosomal proteins have short length and high translation efficiency, a selection during evolution to fulfil the cell demand (Shah et al., 2013).”
BackgroundDel-Pozo-Rodríguez, J. (2020) · theses.fr (ABES) · doi:10.70675/c4e031efz0a8bz4cfaz93abza990eb954d53
Regulation of mRNA translation during the inflammatory response in murine macrophages
Blin, J. (2020) · theses.fr (ABES) · doi:10.70675/9eed69d2z2c72z4b4dz8603zdc632396f487
Structural characterization of the rescue mechanism of proteins synthesis in bacteria
D’Urso, G. (2022) · theses.fr (ABES) · doi:10.70675/41c69952z9b9fz4022za074z400d52d844c8
Nascent protein retention at polysomes reduces kinetic barriers to self-assemblyPreprint
Venkatesan, S., Schulze, A. T. V., Lange, J. J., Jensen, J., Berkowicz, L. E., Tsuchiya, D., Zhang, N., Gardner, J., McCroskey, S., Zhang, Y., et al. (2026) · bioRxiv (Cold Spring Harbor Laboratory) · doi:10.64898/2026.05.17.725791
“This experimental design created two distinct translational regimes at the same bulk abundance: one with more ribosomes loaded onto fewer mRNAs (strong Kozak/low mRNA) and one with less ribosomes loaded onto more mRNAs (weak Kozak/high mRNA) (Hinnebusch, 2014; Shah et al., 2013).”
Modeling the Language of Codons with Artificial Intelligence
Lemay-St-Denis, C., & Kolodny, R. (2026) · Annual Review of Biomedical Data Science · doi:10.1146/annurev-biodatasci-092624-105741
Fitness-Driven Scaling Laws between mRNA and Protein Levels
Yan, Y., & Lin, J. (2026) · Physical Review Letters · doi:10.1103/gkzp-r681
Ahmadi, A. (2015) · MacSphere (McMaster University) · doi:10.71548/9902
Zarai, Y., & Michael Margaliot, A. (2014) · arXiv (Cornell University) · doi:10.48550/arxiv.1410.4088
Metadata
- Authors
- Shah, P., Ding, Y., Niemczyk, M., Kudla, G., & Plotkin, J. B.
- Affiliations
- University of Pennsylvania (US)
- Wellcome Centre for Cell Biology (GB)
- Corresponding author
- Plotkin, Joshua B.
- Venue
- Cell
- Publisher
- Elsevier BV
- Published
- 2013-06
- Volume
- 153
- Issue
- 7
- Pages
- 1589-1601
- ISSN
- 0092-8674 (ISSN-L)
- PMC
- PMC3694300
- OpenAlex
- W2011503994
- Cited by
- 463
- References
- 72
- Citations by year
- 2026: 15 · 2025: 24 · 2024: 31 · 2023: 33 · 2022: 37 · 2021: 27 · 2020: 40 · 2019: 37 · 2018: 42 · 2017: 50 · 2016: 48 · 2015: 26 · 2014: 44 · 2013: 9
- FWCI
- 18.98
- Type
- journal article
- Language
- en
- Open access
- hybrid
- doi.org
- Licence
- Locations
- Cell (publishedVersion, cc-by)
- Europe PMC (PubMed Central) (publishedVersion, cc-by)
- PubMed Central (publishedVersion, cc-by)
- PubMed (publishedVersion)
- Edinburgh Research Explorer (University of Edinburgh) (submittedVersion, cc-by)
- Funders
- Burroughs Wellcome Fund
- Army Research Office (D12AP00025, W911NF-12-1-0552)
- James S. McDonnell Foundation
- David and Lucile Packard Foundation
- U.S. Department of the Interior
- Wellcome Trust (077248)
- Alfred P. Sloan Foundation (RFP-12-16)
- Topics
- Life Sciences › Biochemistry, Genetics and Molecular Biology › Molecular Biology › RNA and protein synthesis mechanisms
- Life Sciences › Biochemistry, Genetics and Molecular Biology › Molecular Biology › RNA Research and Splicing
- Life Sciences › Biochemistry, Genetics and Molecular Biology › Molecular Biology › Genomics and Chromatin Dynamics
- Keywords
- mRNA translation, ribosome occupancy, translation initiation rate, codon usage bias, free ribosomes, protein production, Saccharomyces cerevisiae, tRNA availability, stress response
- MeSH terms
- Codon, Markov Chains, Models, Genetic, Ribosomes, RNA, Messenger, RNA, Transfer, Saccharomyces cerevisiae, Protein Biosynthesis
About these checks
Registry, retraction, Cites and statistics results are computed, not judged, with one exception: a printed reference that no index lists is read once by a model before it counts as a citation error. Claims are extracted by a model and kept only when their quote appears verbatim in the text; each cited source is then checked, with a model’s help, for whether it says what the claim relies on. Those verdicts can be wrong — read the claim’s quote and the cited source before relying on one.
Statistics and arithmetic are recomputed, not judged.
Confidence bands are shown only for fields calibrated on our annotated test set. None is calibrated yet, so no band is shown.
What counts as a claim ›How we measure confidence ›How we check this ›
Are you an author, or do you see a problem with this page? Request a review
