

The DOI matches its Crossref record; 87 of the 87 references it cites were found in a registry or an index.
Lineage-Specific Genome Architecture Links Enhancers and Non-coding Disease Variants to Target Gene Promoters
Open accessAbstract
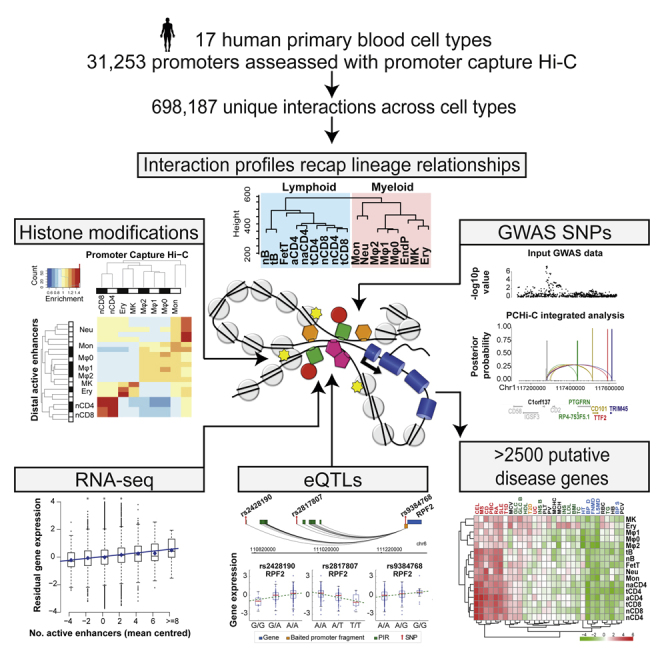
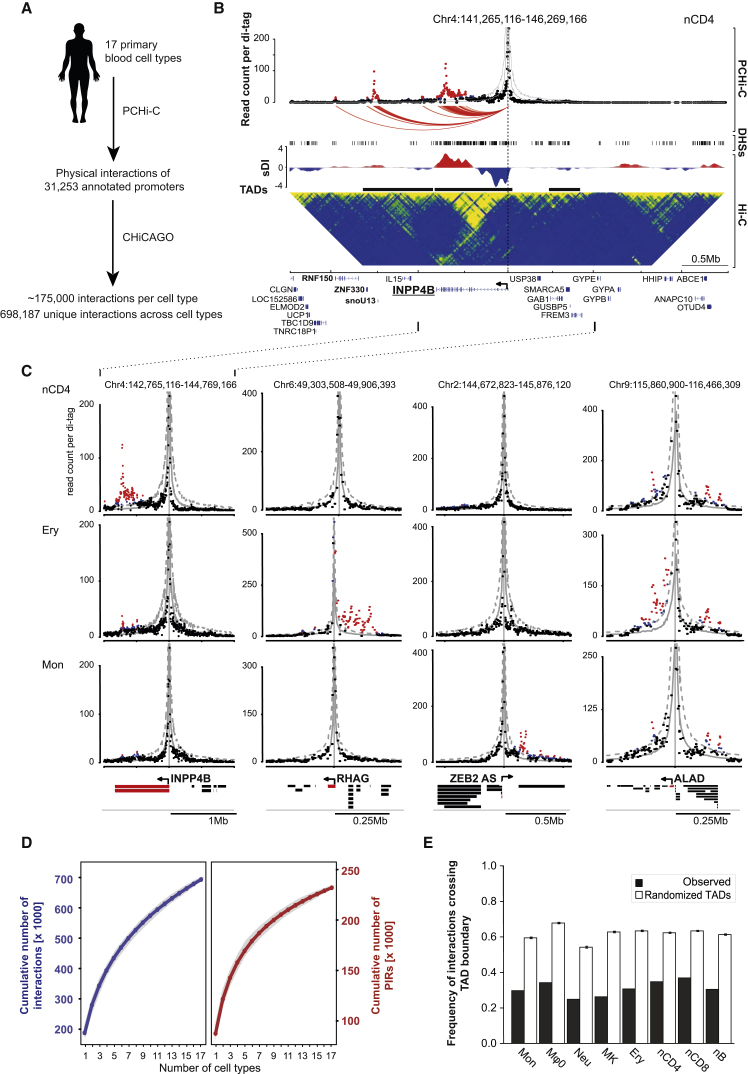
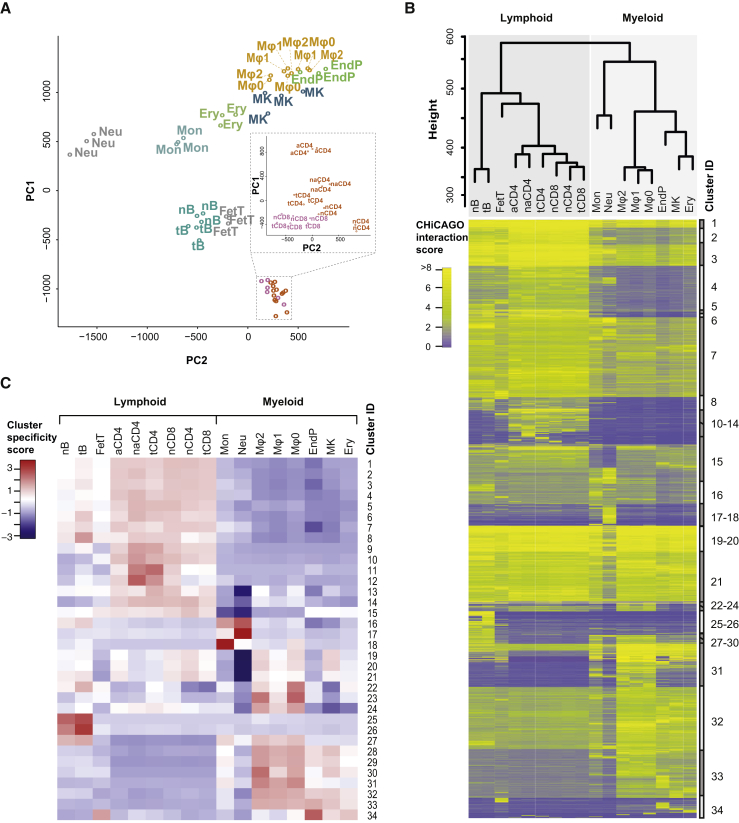
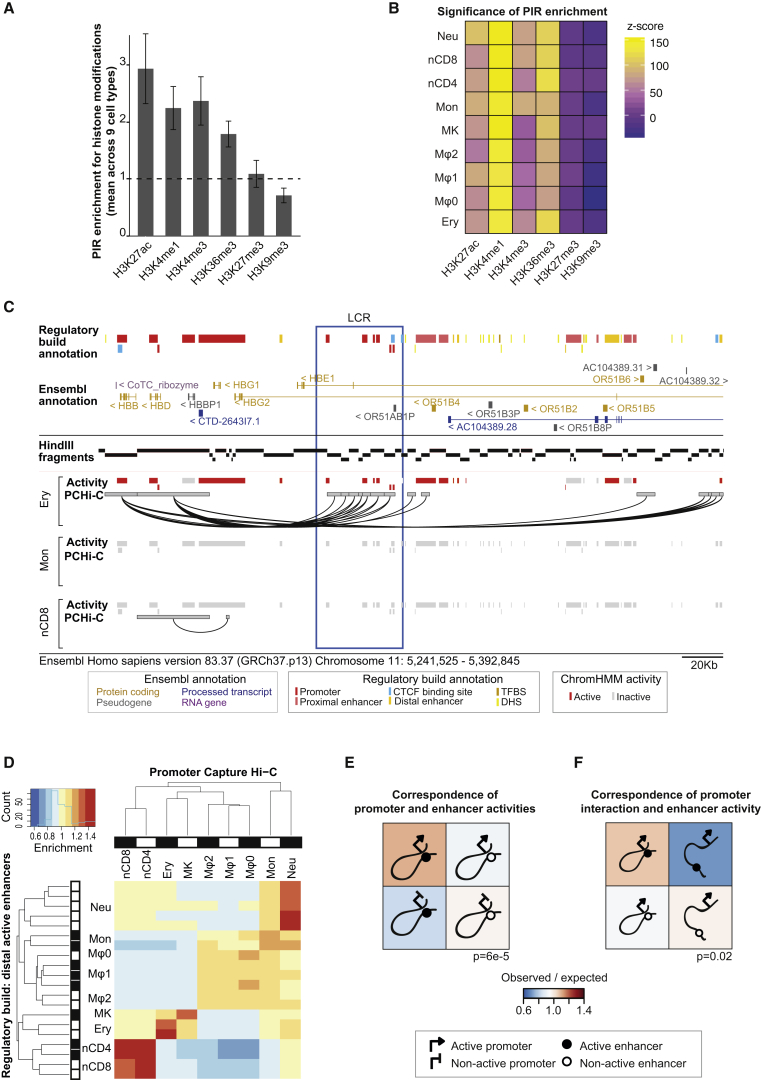
Long-range interactions between regulatory elements and gene promoters play key roles in transcriptional regulation. The vast majority of interactions are uncharted, constituting a major missing link in understanding genome control. Here, we use promoter capture Hi-C to identify interacting regions of 31,253 promoters in 17 human primary hematopoietic cell types. We show that promoter interactions are highly cell type specific and enriched for links between active promoters and epigenetically marked enhancers. Promoter interactomes reflect lineage relationships of the hematopoietic tree, consistent with dynamic remodeling of nuclear architecture during differentiation. Interacting regions are enriched in genetic variants linked with altered expression of genes they contact, highlighting their functional role. We exploit this rich resource to connect non-coding disease variants to putative target promoters, prioritizing thousands of disease-candidate genes and implicating disease pathways. Our results demonstrate the power of primary cell promoter interactomes to reveal insights into genomic regulatory mechanisms underlying common diseases.
Overview
The claims and statistics of this paper haven’t been checked yet.
Run the check — free, no account needed. It reads the open-access text and checks the sources it cites.
Integrity signals
Registry
Cites
Statistics
Figures
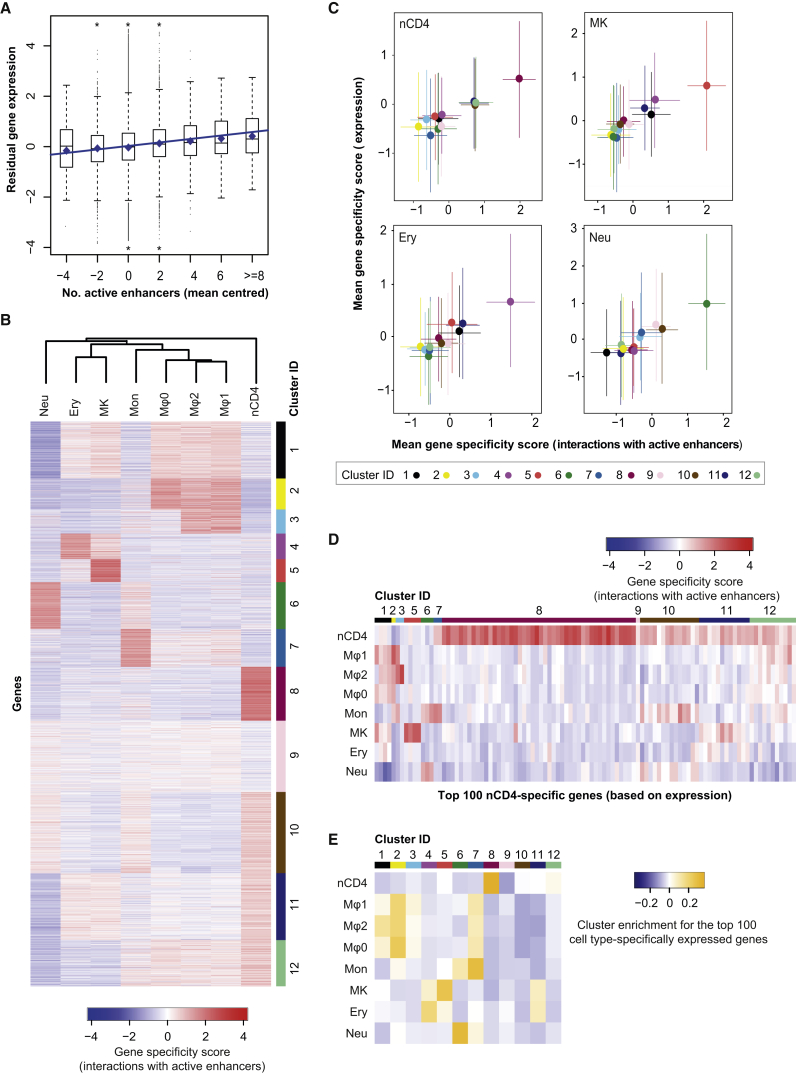
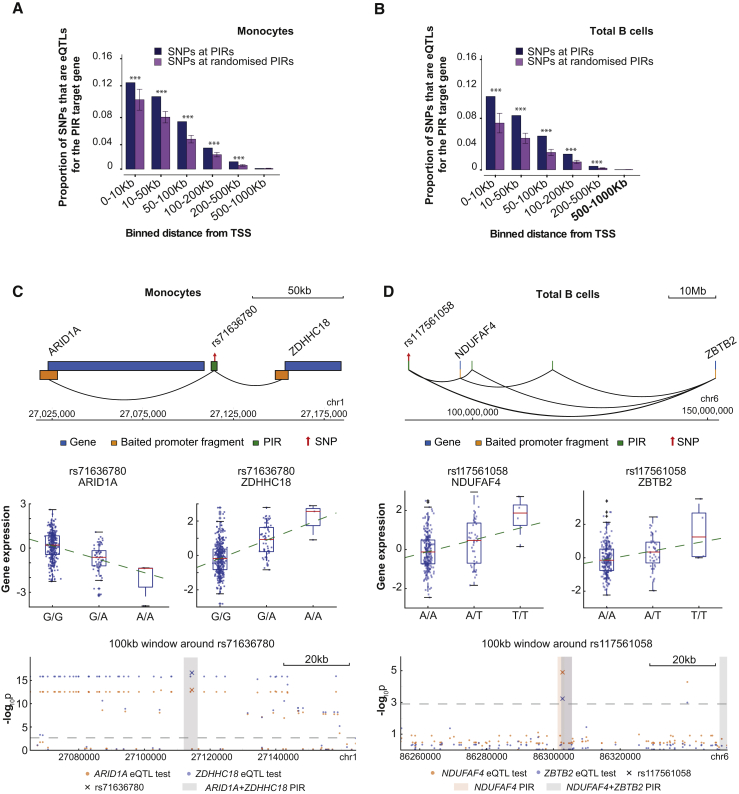
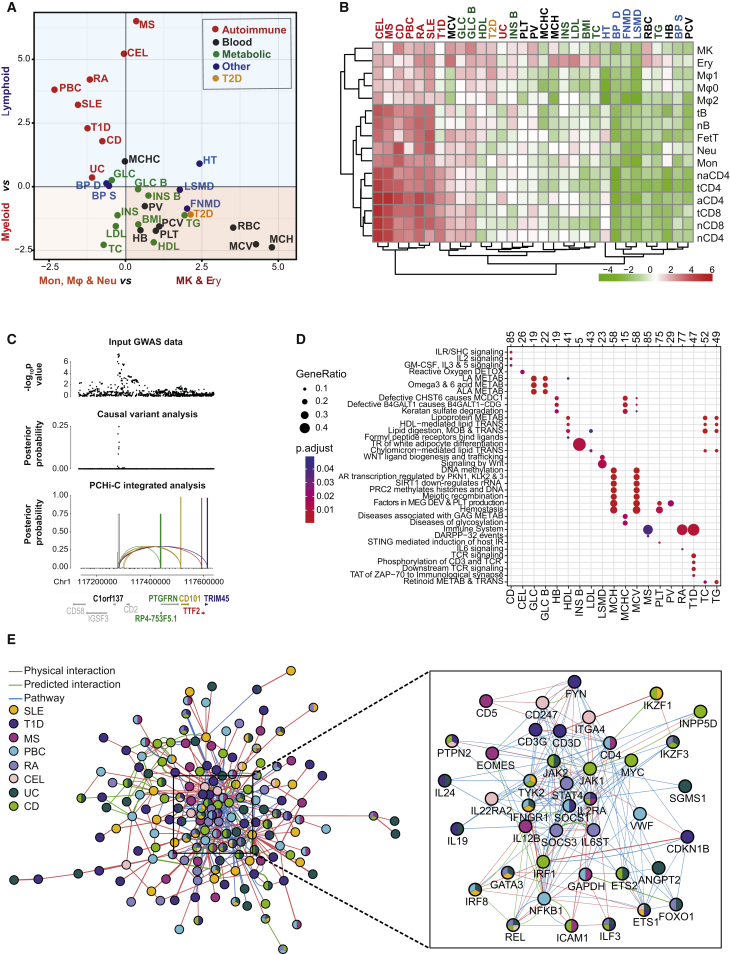
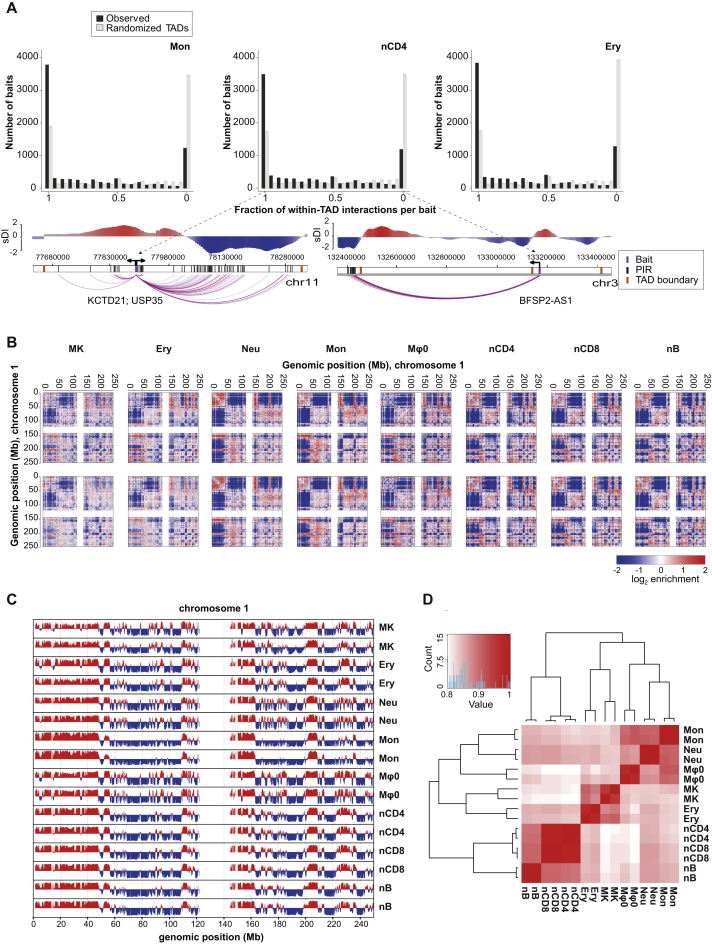
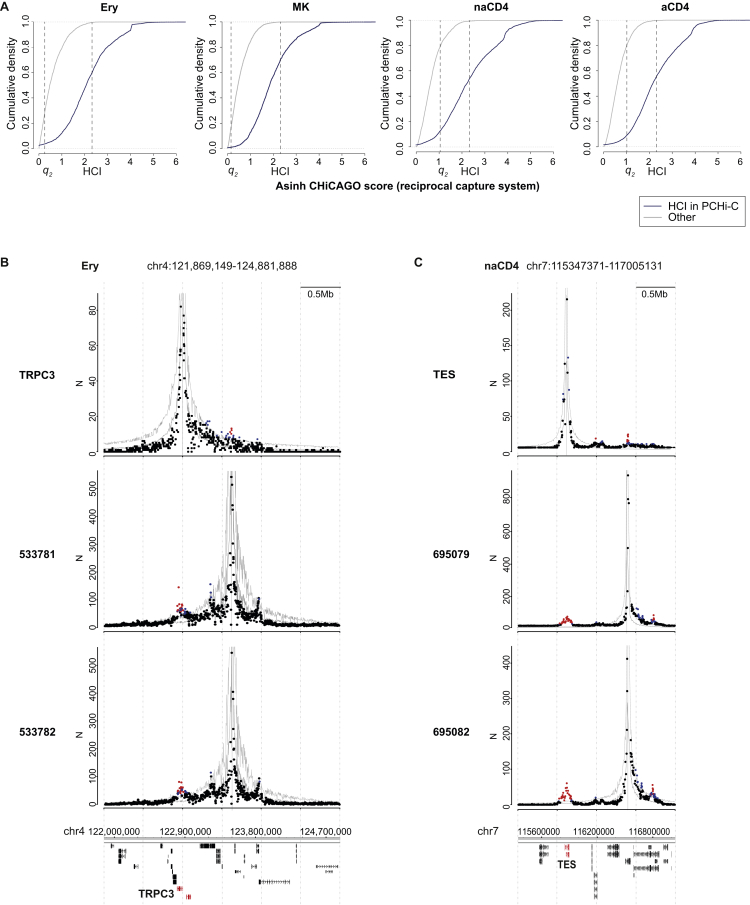
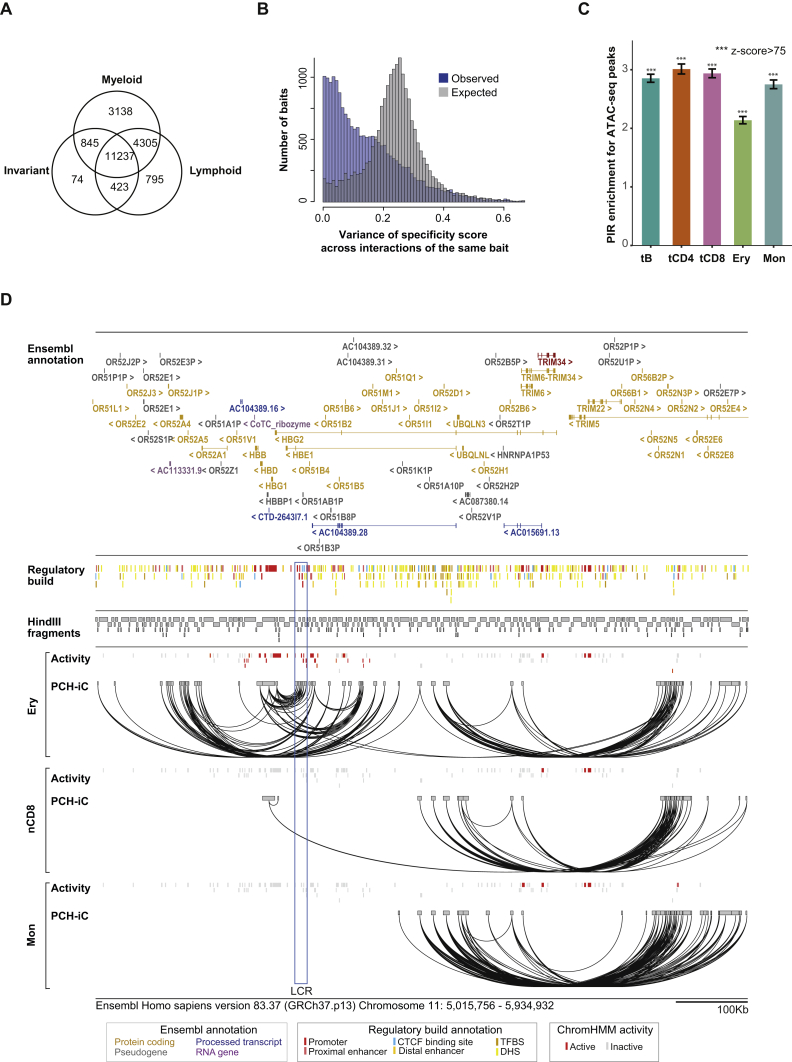
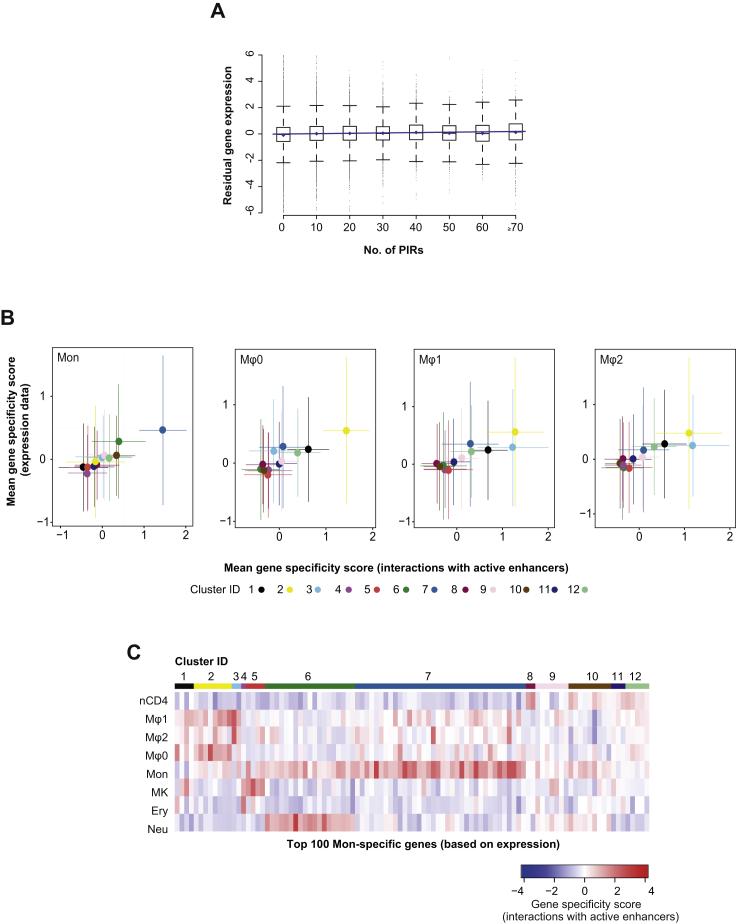
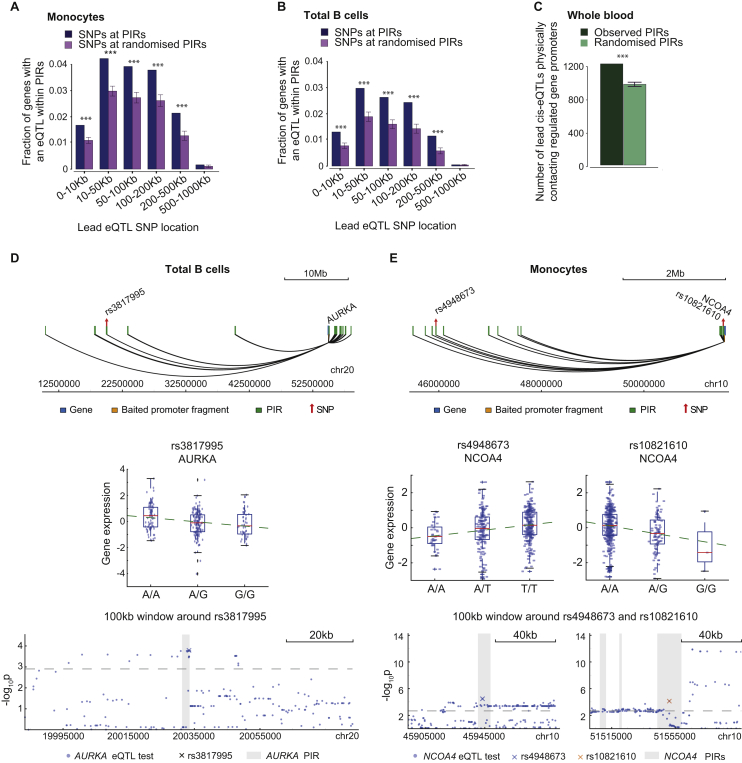
Verification
Claims the paper makes
The claims and statistics of this paper haven’t been checked yet.
Run the check — free, no account needed. It reads the open-access text and checks the sources it cites.
Claims other papers make about this one
Each is checked against this paper’s own text: does it say what the citing paper says it does?
The source backs part of the claim, not all of it — or backs it for a different population, condition or comparison.
In the citing paper
“Capture Hi-C analyses in multiple cell types consistently detect enhancer–promoter contacts that cross TAD boundaries [141, 243].”
From Transcriptional enhancers and their communication with gene promoters (2021) · cites this paper as [243]
Experimental — accuracy not yet measuredThe source backs part of the claim, not all of it — or backs it for a different population, condition or comparison.
In the citing paper
“PCHi-C showed that active promoters contacted a median of two active enhancers in human primary blood cells [243].”
From Transcriptional enhancers and their communication with gene promoters (2021) · cites this paper as [243]
Experimental — accuracy not yet measuredThe source backs part of the claim, not all of it — or backs it for a different population, condition or comparison.
In the citing paper
“A similar network of contacts is also detectable between the active promoters of multiple histone genes in many mammalian cell types [243, 279, 471, 492].”
From Transcriptional enhancers and their communication with gene promoters (2021) · cites this paper as [243]
Experimental — accuracy not yet measuredThe source backs part of the claim, not all of it — or backs it for a different population, condition or comparison.
In the citing paper
“the number of enhancers correlates with the expression level of a gene across cell types [243, 278, 279, 349].”
From Transcriptional enhancers and their communication with gene promoters (2021) · cites this paper as [243]
Experimental — accuracy not yet measuredThe cited source says what the claim attributes to it.
In the citing paper
“These enrichment methods have detected multitudes of enhancer–promoter loops in many human and mouse cell types [243, 286–291].”
From Transcriptional enhancers and their communication with gene promoters (2021) · cites this paper as [243]
The cited source says what the claim attributes to it.
In the citing paper
“Enhancers vastly outnumber promoters in human and mouse genomes [131], and consistently promoters often contact more than one enhancer in the same cell type [141, 243, 278, 279].”
From Transcriptional enhancers and their communication with gene promoters (2021) · cites this paper as [243]
In the citing paper
“disease-associated SNPs in non-coding areas of the genome influence genes associated with diseases including Alzheimer’s Disease (AD)”
From Neuronal DNA double-strand breaks lead to genome structural variations and 3D genome disruption in neurodegeneration (2023) · cites this paper as [50]
Self-check
Percentages, sums and reported differences re-computed from the paper’s own numbers.
The self-check needs the paper’s full text.
Citations
Cites
Moderated estimation of fold change and dispersion for RNA-seq data with DESeq2
Love, M. I., Huber, W., & Anders, S. (2014) · Genome Biology · doi:10.1186/s13059-014-0550-8 · Cited by 95,106
limma powers differential expression analyses for RNA-sequencing and microarray studies
Ritchie, M. E., Phipson, B., Wu, D., Hu, Y., Law, C. W., Shi, W., & Smyth, G. K. (2015) · Nucleic Acids Research · doi:10.1093/nar/gkv007 · Cited by 40,458
clusterProfiler: an R Package for Comparing Biological Themes Among Gene Clusters
Yu, G., Wang, L.-G., Han, Y., & He, Q.-Y. (2012) · OMICS: A Journal of Integrative Biology · doi:10.1089/omi.2011.0118 · Cited by 36,259
A global reference for human genetic variation
The 1000 Genomes Project Consortium, authors, C., Auton, A., Abecasis, G. R., Steering committee, Altshuler, D. M., Durbin, R. M., Abecasis, G. R., Bentley, D. R., Chakravarti, A., et al. (2015) · Nature · doi:10.1038/nature15393 · Cited by 18,247
Self-citationAn integrated encyclopedia of DNA elements in the human genome
The ENCODE Project Consortium (2012) · Nature · doi:10.1038/nature11247 · Cited by 18,072
Self-citationHeinz, S., Benner, C., Spann, N., Bertolino, E., Lin, Y. C., Laslo, P., Cheng, J. X., Murre, C., Singh, H., & Glass, C. K. (2010) · Molecular Cell · doi:10.1016/j.molcel.2010.05.004 · Cited by 13,382
Comprehensive Mapping of Long-Range Interactions Reveals Folding Principles of the Human Genome
Lieberman-Aiden, E., van Berkum, N. L., Williams, L., Imakaev, M., Ragoczy, T., Telling, A., Amit, I., Lajoie, B. R., Sabo, P. J., Dorschner, M. O., et al. (2009) · Science · doi:10.1126/science.1181369 · Cited by 8,898
Topological domains in mammalian genomes identified by analysis of chromatin interactions
Dixon, J. R., Selvaraj, S., Yue, F., Kim, A., Li, Y., Shen, Y., Hu, M., Liu, J. S., & Ren, B. (2012) · Nature · doi:10.1038/nature11082 · Cited by 6,829
The Reactome pathway Knowledgebase
Fabregat, A., Sidiropoulos, K., Garapati, P., Gillespie, M., Hausmann, K., Haw, R., Jassal, B., Jupe, S., Korninger, F., McKay, S., et al. (2016) · Nucleic Acids Research · doi:10.1093/nar/gkv1351 · Cited by 5,605
Genetic studies of body mass index yield new insights for obesity biology
Study, T. L. C., Locke, A. E., The ADIPOGen Consortium, The AGEN-BMI Working Group, The CARDIOGRAMplusC4D Consortium, The CKDGen Consortium, The, G. L. G. C., The, I. C. B. P., The MAGIC Investigators, The MuTHER Consortium, et al. (2015) · Nature · doi:10.1038/nature14177 · Cited by 4,534
A second generation human haplotype map of over 3.1 million SNPs
The International HapMap Consortium (2007) · Nature · doi:10.1038/nature06258 · Cited by 4,438
Mapping identifiers for the integration of genomic datasets with the R/Bioconductor package biomaRt
Durinck, S., Spellman, P. T., Birney, E., & Huber, W. K. (2009) · Nature Protocols · doi:10.1038/nprot.2009.97 · Cited by 4,226
Systematic Localization of Common Disease-Associated Variation in Regulatory DNA
Maurano, M. T., Humbert, R., Rynes, E., Thurman, R. E., Haugen, E., Wang, H., Reynolds, A. P., Sandstrom, R., Qu, H., Brody, J., et al. (2012) · Science · doi:10.1126/science.1222794 · Cited by 3,716
Biological, clinical and population relevance of 95 loci for blood lipids
Teslovich, T. M., Musunuru, K., Smith, A. V., Edmondson, A. C., Stylianou, I. M., Koseki, M., Pirruccello, J. P., Ripatti, S., Chasman, D. I., Willer, C. J., et al. (2010) · Nature · doi:10.1038/nature09270 · Cited by 3,487
Integration of summary data from GWAS and eQTL studies predicts complex trait gene targets
Zhu, Z., Zhang, F., Hu, H., Bakshi, A., Robinson, M. R., Powell, J. E., Montgomery, G. W., Goddard, M. E., Wray, N. R., Visscher, P. M., et al. (2016) · Nature Genetics · doi:10.1038/ng.3538 · Cited by 3,352
Genetic risk and a primary role for cell-mediated immune mechanisms in multiple sclerosis
The International Multiple Sclerosis Genetics Consortium & The Wellcome Trust Case Control Consortium 2 (2011) · Nature · doi:10.1038/nature10251 · Cited by 2,697
Franke, A., McGovern, D. P. B., Barrett, J. C., Wang, K., Radford-Smith, G. L., Ahmad, T., Lees, C. W., Balschun, T., Lee, J., Roberts, R., et al. (2010) · Nature Genetics · doi:10.1038/ng.717 · Cited by 2,520
Integration of biological networks and gene expression data using Cytoscape
Cline, M. S., Smoot, M., Cerami, E., Kuchinsky, A., Landys, N., Workman, C., Christmas, R., Avila-Campilo, I., Creech, M., Gross, B., et al. (2007) · Nature Protocols · doi:10.1038/nprot.2007.324 · Cited by 2,507
ChromHMM: automating chromatin-state discovery and characterization
Ernst, J., & Kellis, M. (2012) · Nature Methods · doi:10.1038/nmeth.1906 · Cited by 2,457
Genetic variants in novel pathways influence blood pressure and cardiovascular disease risk
The International Consortium for Blood Pressure Genome-Wide Association Studies (2011) · Nature · doi:10.1038/nature10405 · Cited by 2,033
ReactomePA: an R/Bioconductor package for reactome pathway analysis and visualization
Yu, G., & He, Q. (2015) · Molecular BioSystems · doi:10.1039/c5mb00663e · Cited by 1,922
the DIAbetes Genetics Replication And Meta-analysis (DIAGRAM) Consortium, Morris, A. P., Voight, B. F., Teslovich, T. M., Ferreira, T., Segrè, A. V., Steinthorsdottir, V., Strawbridge, R. J., Khan, H., Grallert, H., et al. (2012) · Nature Genetics · doi:10.1038/ng.2383 · Cited by 1,912
The Electronic Medical Records and Genomics (eMERGE) Consortium, Wood, A. R., The MIGen Consortium, The PAGE Consortium, Study, T. L. C., Esko, T., Yang, J., Vedantam, S., Pers, T. H., Gustafsson, S., et al. (2014) · Nature Genetics · doi:10.1038/ng.3097 · Cited by 1,853
The Type 1 Diabetes Genetics Consortium, Barrett, J. C., Clayton, D. G., Concannon, P., Akolkar, B., Cooper, J. D., Erlich, H. A., Julier, C., Morahan, G., Nerup, J., et al. (2009) · Nature Genetics · doi:10.1038/ng.381 · Cited by 1,746
Self-citationSystematic identification of trans eQTLs as putative drivers of known disease associations
Westra, H.-J., Peters, M. J., Esko, T., Yaghootkar, H., Schurmann, C., Kettunen, J., Christiansen, M. W., Fairfax, B. P., Schramm, K., Powell, J. E., et al. (2013) · Nature Genetics · doi:10.1038/ng.2756 · Cited by 1,658
Deriving the consequences of genomic variants with the Ensembl API and SNP Effect Predictor
McLaren, W. M., Yates, B., Ríos, D., Chen, Y., Flicek, P., & Cunningham, F. M. (2010) · Bioinformatics · doi:10.1093/bioinformatics/btq330 · Cited by 1,586
Self-citationThe long-range interaction landscape of gene promoters
Sanyal, A., Lajoie, B. R., Jain, G., & Dekker, J. (2012) · Nature · doi:10.1038/nature11279 · Cited by 1,489
Iterative correction of Hi-C data reveals hallmarks of chromosome organization
Imakaev, M., Fudenberg, G., McCord, R. P., Naumova, N., Goloborodko, A., Lajoie, B. R., Dekker, J., & Mirny, L. A. (2012) · Nature Methods · doi:10.1038/nmeth.2148 · Cited by 1,423
Anderson, C., Boucher, G., Lees, C., Franke, A., D'Amato, M., Taylor, K., Lee, J., Goyette, P., Imieliński, M., Latiano, A., et al. (2011) · Nature Genetics · doi:10.1038/ng.764 · Cited by 1,361
Looping and Interaction between Hypersensitive Sites in the Active β-globin Locus
Tolhuis, B., Palstra, R.-J., Splinter, E., Grosveld, F., & de Laat, W. (2002) · Molecular Cell · doi:10.1016/s1097-2765(02)00781-5 · Cited by 1,344
Genome-wide association study meta-analysis identifies seven new rheumatoid arthritis risk loci
BIRAC Consortium, Stahl, E. A., YEAR Consortium, Raychaudhuri, S., Remmers, E. F., Xie, G., Eyre, S., Thomson, B. P., Li, Y., Kurreeman, F. A. S., et al. (2010) · Nature Genetics · doi:10.1038/ng.582 · Cited by 1,253
Obesity-associated variants within FTO form long-range functional connections with IRX3
Smemo, S., Tena, J. J., Kim, K.-H., Gamazon, E. R., Sakabe, N. J., Gómez-Marín, C., Aneas, I., Credidio, F. L., Sobreira, D. R., Wasserman, N. F., et al. (2014) · Nature · doi:10.1038/nature13138 · Cited by 1,219
A high-resolution map of the three-dimensional chromatin interactome in human cells
Jin, F., Li, Y., Dixon, J. R., Selvaraj, S., Ye, Z., Lee, A. Y., Yen, C.-A., Schmitt, A. D., Espinoza, C. A., & Ren, B. (2013) · Nature · doi:10.1038/nature12644 · Cited by 1,208
Estrada, K., Styrkársdóttir, U., Εvangelou, Ε., Hsu, Y., Duncan, E. L., Ntzani, E., Oei, L., Albagha, O., Amin, N., Kemp, J. P., et al. (2012) · Nature Genetics · doi:10.1038/ng.2249 · Cited by 1,184
Corces, M. R., Buenrostro, J. D., Wu, B., Greenside, P. G., Chan, S. M., Koenig, J. L., Snyder, M. P., Pritchard, J. K., Kundaje, A., Greenleaf, W. J., et al. (2016) · Nature Genetics · doi:10.1038/ng.3646 · Cited by 1,151
Multiple common variants for celiac disease influencing immune gene expression
Dubois, P. C. A., Trynka, G., Franke, L., Hunt, K. A., Romanos, J., Curtotti, A., Zhernakova, A., Heap, G., Ádány, R., Aromaa, A. J., et al. (2010) · Nature Genetics · doi:10.1038/ng.543 · Cited by 1,027
Bentham, J., Morris, D. L., Graham, D. S. C., Pinder, C. L., Tombleson, P., Behrens, T. W., Martin, J. J., Fairfax, B. P., Knight, J. C., Chen, L., et al. (2015) · Nature Genetics · doi:10.1038/ng.3434 · Cited by 1,004
Mapping long-range promoter contacts in human cells with high-resolution capture Hi-C
Mifsud, B., Tavares-Cadete, F., Young, A. N., Sugar, R., Schoenfelder, S., Ferreira, L., Wingett, S. W., Andrews, S., Grey, W., Ewels, P. A., et al. (2015) · Nature Genetics · doi:10.1038/ng.3286 · Cited by 990
Self-citationManning, A. K., Hivert, M., Scott, R. A., Grimsby, J., Bouatia‐Naji, N., Chen, H., Rybin, D. V., Liu, C.-T., Bielak, L. F., Prokopenko, I., et al. (2012) · Nature Genetics · doi:10.1038/ng.2274 · Cited by 821
HiCUP: pipeline for mapping and processing Hi-C data
Wingett, S., Ewels, P., Furlan-Magaril, M., Nagano, T., Schoenfelder, S., Fraser, P., & Andrews, S. (2015) · F1000Research · doi:10.12688/f1000research.7334.1 · Cited by 734
Self-citationLong-range chromatin regulatory interactions in vivo
Carter, D., Chakalova, L., Osborne, C. S., Dai, Y.-F., & Fraser, P. (2002) · Nature Genetics · doi:10.1038/ng1051 · Cited by 663
Self-citationGeneMANIA Cytoscape plugin: fast gene function predictions on the desktop
Montojo, J., Zuberi, K., Rodriguez, H., Kazi, F. I., Wright, G., Donaldson, S. L., Morris, Q., & Bader, G. D. (2010) · Bioinformatics · doi:10.1093/bioinformatics/btq562 · Cited by 633
Enhancer loops appear stable during development and are associated with paused polymerase
Ghavi-Helm, Y., Klein, F. A., Pakozdi, T., Ciglar, L., Noordermeer, D., Huber, W., & Furlong, E. E. M. (2014) · Nature · doi:10.1038/nature13417 · Cited by 536
Topology of mammalian developmental enhancers and their regulatory landscapes
de Laat, W., & Duboule, D. (2013) · Nature · doi:10.1038/nature12753 · Cited by 521
Phenotypic robustness conferred by apparently redundant transcriptional enhancers
Frankel, N., Davis, G. K., Vargas, D., Wang, S., Payre, F., & Stern, D. L. (2010) · Nature · doi:10.1038/nature09158 · Cited by 510
AutoClass: A Bayesian Classification System
Cheeseman, P. C., KELLY, J., SELF, M., Stutz, J., Taylor, W., & Freeman, D. (1988) · Elsevier eBooks · doi:10.1016/b978-0-934613-64-4.50011-6 · Cited by 506
Fairfax, B. P., Makino, S., Radhakrishnan, J., Plant, K., Leslie, S., Dilthey, A., Ellis, P., Langford, C., Vannberg, F. O., & Knight, J. C. (2012) · Nature Genetics · doi:10.1038/ng.2205 · Cited by 486
Bayesian refinement of association signals for 14 loci in 3 common diseases
Maller, J., McVean, G., Byrnes, J., Vukcevic, D., Palin, K., Su, Z., Howson, J. M. M., Auton, A., Myers, S., Morris, A. P., et al. (2012) · Nature Genetics · doi:10.1038/ng.2435 · Cited by 473
Self-citationThe pluripotent regulatory circuitry connecting promoters to their long-range interacting elements
Schoenfelder, S., Furlan-Magaril, M., Mifsud, B., Tavares-Cadete, F., Sugar, R., Javierre, B.-M., Nagano, T., Katsman, Y., Sakthidevi, M., Wingett, S. W., et al. (2015) · Genome Research · doi:10.1101/gr.185272.114 · Cited by 460
Self-citationReactivation of developmentally silenced globin genes by forced chromatin looping
Deng, W., Rupon, J. W., Krivega, I., Breda, L., Motta, I., Jahn, K. S., Reik, A., Gregory, P. D., Rivella, S., Dean, A., et al. (2014) · Cell · doi:10.1016/j.cell.2014.05.050 · Cited by 443
Zerbino, D. R., Wilder, S. P., Johnson, N., Juettemann, T., & Flicek, P. R. (2015) · Genome Biology · doi:10.1186/s13059-015-0621-5 · Cited by 429
Self-citationNoncoding Transcription at Enhancers: General Principles and Functional Models
Natoli, G., & Andrau, J. (2012) · Annual Review of Genetics · doi:10.1146/annurev-genet-110711-155459 · Cited by 418
CHiCAGO: robust detection of DNA looping interactions in Capture Hi-C data
Cairns, J., Freire-Pritchett, P., Wingett, S. W., Várnai, C., Dimond, A., Plagnol, V., Zerbino, D., Schoenfelder, S., Javierre, B.-M., Osborne, C., et al. (2016) · Genome Biology · doi:10.1186/s13059-016-0992-2 · Cited by 417
Self-citationNew gene functions in megakaryopoiesis and platelet formation
Gieger, C., Radhakrishnan, A., Cvejic, A., Tang, W., Porcu, E., Pistis, G., Serbanovic‐Canic, J., Elling, U., Goodall, A. H., Labrune, Y., et al. (2011) · Nature · doi:10.1038/nature10659 · Cited by 410
Bayes factors for genome‐wide association studies: comparison with P ‐values
Wakefield, J. (2008) · Genetic Epidemiology · doi:10.1002/gepi.20359 · Cited by 404
Okada, Y., Terao, C., Ikari, K., Kochi, Y., Ohmura, K., Suzuki, A., Kawaguchi, T., Stahl, E. A., Kurreeman, F. A. S., Nishida, N., et al. (2012) · Nature Genetics · doi:10.1038/ng.2231 · Cited by 335
Transcriptional diversity during lineage commitment of human blood progenitors
Chen, L., Kostadima, M. A., Martens, J. H. A., Canu, G., Garcia, S. P., Turro, E., Downes, K., Macaulay, I. C., Bielczyk-Maczyńska, E., Coe, S., et al. (2014) · Science · doi:10.1126/science.1251033 · Cited by 311
Self-citationSeventy-five genetic loci influencing the human red blood cell
van der Harst, P., Zhang, W., Leach, I. M., Rendon, A., Verweij, N., Sehmi, J., Paul, D. S., Elling, U., Allayee, H., Li, X., et al. (2012) · Nature · doi:10.1038/nature11677 · Cited by 306
Effect of natural genetic variation on enhancer selection and function
Heinz, S., Romanoski, C. E., Benner, C., Allison, K. A., Kaikkonen, M. U., Orozco, L. D., & Glass, C. K. (2013) · Nature · doi:10.1038/nature12615 · Cited by 298
Cordell, H. J., Han, Y., Mells, G. F., Li, Y., Hirschfield, G. M., Greene, C. S., Xie, G., Juran, B. D., Zhu, D., Qian, D. C., et al. (2015) · Nature Communications · doi:10.1038/ncomms9019 · Cited by 287
Importance of globin gene order for correct developmental expression.Preprint
Hanscombe, O., Whyatt, D., Fraser, P., Yannoutsos, N., Greaves, D. R., Dillon, N., & Grosveld, F. G. (1991) · Genes & Development · doi:10.1101/gad.5.8.1387 · Cited by 283
Self-citationHaplotype and isoform specific expression estimation using multi-mapping RNA-seq reads
Turro, E., Su, S.-Y., Gonçalves, Â., Coin, L. J., Richardson, S., & Lewin, A. (2011) · Genome Biology · doi:10.1186/gb-2011-12-2-r13 · Cited by 264
Unbiased analysis of potential targets of breast cancer susceptibility loci by Capture Hi-CPreprint
Dryden, N. H., Broome, L. R., Dudbridge, F., Johnson, N., Orr, N., Schoenfelder, S., Nagano, T., Andrews, S., Wingett, S., Kozarewa, I., et al. (2014) · Genome Research · doi:10.1101/gr.175034.114 · Cited by 261
Self-citationHigh-throughput mapping of regulatory DNA
Rajagopal, N., Srinivasan, S., Kooshesh, K., Guo, Y., Edwards, M. D., Banerjee, B., Syed, T., Emons, B. J. M., Gifford, D. K., & Sherwood, R. I. (2016) · Nature Biotechnology · doi:10.1038/nbt.3468 · Cited by 238
Population Variation and Genetic Control of Modular Chromatin Architecture in Humans
Waszak, S. M., Delaneau, O., Gschwind, A. R., Kilpinen, H., Raghav, S. K., Witwicki, R. M., Orioli, A., Wiederkehr, M., Panousis, N. I., Yurovsky, A., et al. (2015) · Cell · doi:10.1016/j.cell.2015.08.001 · Cited by 214 · cited 1×
“Using this approach, we observe that enhancers show generally additive effects on the expression of their target genes, which may explain why genes are often able to buffer the effects of mutations at individual enhancers (Frankel et al., 2010;Waszak et al., 2015).”
HBS1L-MYB intergenic variants modulate fetal hemoglobin via long-range MYB enhancers
Stadhouders, R., Aktuna, S., Thongjuea, S., Aghajanirefah, A., Pourfarzad, F., van IJcken, W. F. J., Lenhard, B., Rooks, H., Best, S., Menzel, S., et al. (2014) · Journal of Clinical Investigation · doi:10.1172/jci71520 · Cited by 214
Martin, P., McGovern, A., Orozco, G., Duffus, K., Yarwood, A., Schoenfelder, S., Cooper, N. J., Barton, A., Wallace, C., Fraser, P., et al. (2015) · Nature Communications · doi:10.1038/ncomms10069 · Cited by 213
Self-citationDeletion of a coordinate regulator of type 2 cytokine expression in mice
Mohrs, M., Blankespoor, C. M., Wang, Z., Loots, G. G., Afzal, V., Hadeiba, H., Shinkai, K., Rubin, E. M., & Locksley, R. M. (2001) · Nature Immunology · doi:10.1038/ni0901-842 · Cited by 198
Comparison of Hi-C results using in-solution versus in-nucleus ligation
Nagano, T., Várnai, C., Schoenfelder, S., Javierre, B.-M., Wingett, S. W., & Fraser, P. (2015) · Genome Biology · doi:10.1186/s13059-015-0753-7 · Cited by 166
Self-citationT-cell metabolism in autoimmune disease
Yang, Z., Matteson, E. L., Goronzy, J. J., & Weyand, C. M. (2015) · Arthritis Research & Therapy · doi:10.1186/s13075-015-0542-4 · Cited by 159
Genome-wide mapping of promoter-anchored interactions with close to single-enhancer resolution
Sahlén, P., Abdullayev, I., Ramsköld, D., Matskova, L. V., Rilakovic, N., Lötstedt, B., Albert, T. J., Lundeberg, J., & Sandberg, R. (2015) · Genome biology · doi:10.1186/s13059-015-0727-9 · Cited by 139
Guo, H., Fortune, M. D., Burren, O. S., Schofield, E. C., Todd, J. A., & Wallace, C. (2015) · Human Molecular Genetics · doi:10.1093/hmg/ddv077 · Cited by 139
Self-citationThe LifeLines Cohort Study: Prevalence and treatment of cardiovascular disease and risk factors
van der Ende, M. Y., Hartman, M. H. T., Hagemeijer, Y. P., Meems, L. M. G., de Vries, H. S., Stolk, R. P., de Boer, R. A., Sijtsma, A., van der Meer, P., Rienstra, M., et al. (2016) · International Journal of Cardiology · doi:10.1016/j.ijcard.2016.11.061 · Cited by 132
Trynka, G., Westra, H.-J., Slowikowski, K., Hu, X., Xu, H., Stranger, B. E., Klein, R. J., Han, B., & Raychaudhuri, S. (2015) · The American Journal of Human Genetics · doi:10.1016/j.ajhg.2015.05.016 · Cited by 109
Davison, L. J., Wallace, C., Cooper, J. D., Cope, N. F., Wilson, N. K., Smyth, D. J., Howson, J. M. M., Saleh, N. M., Aljeffery, A., Angus, K. L., et al. (2011) · Human Molecular Genetics · doi:10.1093/hmg/ddr468 · Cited by 107
Self-citationLIMIX: genetic analysis of multiple traitsPreprint
Lippert, C., Casale, F. P., Rakitsch, B., & Stegle, O. (2014) · bioRxiv (Cold Spring Harbor Laboratory) · doi:10.1101/003905 · Cited by 107
Self-citationPeters, J. E., Lyons, P., Lee, J. C., Richard, A. C., Fortune, M. D., Newcombe, P. J., Richardson, S. T., & Smith, K. G. C. (2016) · PLoS Genetics · doi:10.1371/journal.pgen.1005908 · Cited by 97
Zerbino, D. R., Johnson, N., Juettemann, T., Sheppard, D., Wilder, S. P., Lavidas, I., Nuhn, M., Perry, E. H., Raffaillac-Desfosses, Q., Sobral, D., et al. (2016) · Database · doi:10.1093/database/bav119 · Cited by 76
Self-citationGeneration and Culture of Blood Outgrowth Endothelial Cells from Human Peripheral Blood
Ormiston, M. L., Toshner, M. R., Kiskin, F. N., Huang, C., Groves, E., Morrell, N. W., & Rana, A. A. (2015) · Journal of Visualized Experiments · doi:10.3791/53384 · Cited by 74
Mapping of INS promoter interactions reveals its role in long-range regulation of SYT8 transcription
Xu, Z., Wei, G., Chepelev, I., Zhao, K., & Felsenfeld, G. (2011) · Nature Structural & Molecular Biology · doi:10.1038/nsmb.1993 · Cited by 67
Schofield, E. C., Carver, T., Achuthan, P., Freire-Pritchett, P., Spivakov, M., Todd, J. A., & Burren, O. S. (2016) · Bioinformatics · doi:10.1093/bioinformatics/btw173 · Cited by 65
Self-citationGeneration and Culture of Blood Outgrowth Endothelial Cells from Human Peripheral Blood
Ormiston, M. L., Toshner, M. R., Kiskin, F. N., Huang, C., Groves, E., Morrell, N. W., & Rana, A. A. (2015) · Journal of Visualized Experiments · doi:10.3791/53384-v · Cited by 41
Machine Learning Proceedings 1988
(1988) · Elsevier eBooks · doi:10.1016/c2009-0-27602-1 · Cited by 21
Jovanović, D., Boumsell, L., Bensussan, A., Chevalier, X., Mancini, A. D., & Battista, J. A. D. (2010) · The Journal of Rheumatology · doi:10.3899/jrheum.100676 · Cited by 19
Statistical tools for synthesizing lists of differentially expressed features in related experiments
Blangiardo, M., & Richardson, S. T. (2007) · Genome biology · doi:10.1186/gb-2007-8-4-r54 · Cited by 15
sdef: an R package to synthesize lists of significant features in related experiments
Blangiardo, M., Cassese, A., & Richardson, S. T. (2010) · BMC Bioinformatics · doi:10.1186/1471-2105-11-270 · Cited by 10
Discovering collectively informative descriptors from high-throughput experiments
Jeffries, C. D., Ward, W. O., Perkins, D. O., & Wright, F. A. (2009) · BMC Bioinformatics · doi:10.1186/1471-2105-10-431 · Cited by 4
Cited by
Sorted by citations
Functional mapping and annotation of genetic associations with FUMA
Watanabe, K., Taskesen, E., van Bochoven, A., & Posthuma, D. (2017) · Nature Communications · doi:10.1038/s41467-017-01261-5 · Cited by 4,083
Võsa, U., Claringbould, A., Westra, H.-J., Bonder, M. J., Deelen, P., Zeng, B., Kirsten, H., Saha, A., Kreuzhuber, R., Yazar, S., et al. (2021) · Nature Genetics · doi:10.1038/s41588-021-00913-z · Cited by 2,607
Self-citationGenomic atlas of the human plasma proteome
Sun, B. B., Maranville, J. C., Peters, J. E., Stacey, D., Staley, J. R., Blackshaw, J., Burgess, S., Jiang, T., Paige, E., Surendran, P., et al. (2018) · Nature · doi:10.1038/s41586-018-0175-2 · Cited by 2,268
Self-citationMultiscale 3D Genome Rewiring during Mouse Neural Development
Bonev, B., Mendelson Cohen, N., Szabo, Q., Fritsch, L., Papadopoulos, G. L., Lubling, Y., Xu, X., Lv, X., Hugnot, J.-P., Tanay, A., et al. (2017) · Cell · doi:10.1016/j.cell.2017.09.043 · Cited by 1,338
Complex genetic signatures in immune cells underlie autoimmunity and inform therapy
Orrù, V., Steri, M., Sidore, C., Marongiu, M., Serra, V., Olla, S., Sole, G., Lai, S., Dei, M., Mulas, A., et al. (2020) · Nature Genetics · doi:10.1038/s41588-020-0684-4 · Cited by 1,246
Metadata
- Authors
- Javierre, B. M., Burren, O. S., Wilder, S. P., Kreuzhuber, R., Hill, S. M., Sewitz, S., Cairns, J., Wingett, S. W., Várnai, C., Thiecke, M. J., Burden, F., Farrow, S., Cutler, A. J., Rehnström, K., Downes, K., Grassi, L., Kostadima, M., Freire-Pritchett, P., Wang, F., Martens, J. H., Kim, B., Sharifi, N., Janssen-Megens, E. M., Yaspo, M.-L., Linser, M., Kovacsovics, A., Clarke, L., Richardson, D., Datta, A., Flicek, P., Stunnenberg, H. G., Todd, J. A., Zerbino, D. R., Stegle, O., Ouwehand, W. H., Frontini, M., Wallace, C., Spivakov, M., & Fraser, P.
- Affiliations
- Babraham Institute (GB)
- University of Cambridge (GB)
- European Bioinformatics Institute (GB)
- National Health Service (GB)
- MRC Biostatistics Unit (GB)
- Radboud University Nijmegen (NL)
- Corresponding author
- Frontini, Mattia
- Wallace, Chris
- Spivakov, Mikhail
- Fraser, Peter
- ORCID
- Javierre, Biola M.
- Burren, Oliver S.
- Wilder, Steven P.
- Kreuzhuber, Roman
- Sewitz, Sven
- Cairns, Jonathan
- Wingett, Steven W.
- Várnai, Csilla
- Thiecke, Michiel J.
- Burden, Frances
- Cutler, Antony J.
- Downes, Kate
- Grassi, Luigi
- Kostadima, Myrto
- Freire-Pritchett, Paula
- Wang, Fan
- Martens, Joost H.
- Yaspo, Marie-Laure
- Clarke, Laura
- Richardson, David
- Datta, Avik
- Flicek, Paul
- Stunnenberg, Hendrik G.
- Zerbino, Daniel R.
- Stegle, Oliver
- Ouwehand, Willem H.
- Frontini, Mattia
- Wallace, Chris
- Spivakov, Mikhail
- Fraser, Peter
- Venue
- Cell
- Publisher
- Elsevier BV
- Published
- 2016-11
- Volume
- 167
- Issue
- 5
- Pages
- 1369-1384.e19
- ISSN
- 0092-8674 (ISSN-L)
- PMC
- PMC5123897
- OpenAlex
- W2553838260
- Cited by
- 1,046
- References
- 87
- Citations by year
- 2026: 59 · 2025: 84 · 2024: 102 · 2023: 113 · 2022: 116 · 2021: 135 · 2020: 126 · 2019: 130 · 2018: 117 · 2017: 59 · 2016: 4
- FWCI
- 53.72
- Type
- journal article
- Language
- en
- Open access
- hybrid
- doi.org
- Licence
- Locations
- Cell (publishedVersion, cc-by)
- PubMed Central (publishedVersion, cc-by)
- PubMed (publishedVersion)
- UCL Discovery (University College London) (submittedVersion)
- University of Birmingham Research Portal (University of Birmingham) (submittedVersion, cc-by)
- Radboud Repository (Radboud University) (submittedVersion)
- Apollo (University of Cambridge) (submittedVersion, cc-by)
- Radboud Repository (Radboud University) (submittedVersion, other-oa)
- Apollo (cc-by)
- Funders
- Biotechnology and Biological Sciences Research Council (BB/J004480/1)
- National Institute for Health Research (PG-0310-1002)
- Wellcome Trust (107212, 107881, 089989, 091157, 095908, 100140)
- Seventh Framework Programme (282510, 241447)
- European Research Council
- Medical Research Council (MC_UP_1302/3, MC_UP_1302/5, MC_UP_1302/1, MR/L007150/1)
- European Molecular Biology Laboratory
- British Heart Foundation (RG/09/12/28096)
- Juvenile Diabetes Research Foundation United States of America (5-SRA-2015-130, 9-2011-253)
- Topics
- Life Sciences › Biochemistry, Genetics and Molecular Biology › Molecular Biology › Genomics and Chromatin Dynamics
- Life Sciences › Biochemistry, Genetics and Molecular Biology › Genetics › Genetic Associations and Epidemiology
- Life Sciences › Biochemistry, Genetics and Molecular Biology › Cancer Research › Cancer-related molecular mechanisms research
- Keywords
- enhancer-promoter interactions, long-range chromatin interactions, promoter capture Hi-C, hematopoietic lineage, enhancers, transcriptional regulation
- MeSH terms
- Blood Cells, Cell Separation, Chromatin, Disease, Enhancer Elements, Genetic, Hematopoiesis, Humans, Promoter Regions, Genetic, Cell Lineage, Genetic Predisposition to Disease, Polymorphism, Single Nucleotide, Quantitative Trait Loci, Genome-Wide Association Study, Epigenomics
About these checks
Registry, retraction, Cites and statistics results are computed, not judged, with one exception: a printed reference that no index lists is read once by a model before it counts as a citation error. Claims are extracted by a model and kept only when their quote appears verbatim in the text; each cited source is then checked, with a model’s help, for whether it says what the claim relies on. Those verdicts can be wrong — read the claim’s quote and the cited source before relying on one.
Statistics and arithmetic are recomputed, not judged.
Confidence bands are shown only for fields calibrated on our annotated test set. None is calibrated yet, so no band is shown.
What counts as a claim ›How we measure confidence ›How we check this ›
Are you an author, or do you see a problem with this page? Request a review
