Cited by 533Protein Degradation and InhibitorsUbiquitin and proteasome pathwaysCRISPR and Genetic Engineering

The DOI matches its Crossref record; 63 of the 65 references it cites were found in a registry or an index.

A Method for the Acute and Rapid Degradation of Endogenous Proteins

Open access

Abstract

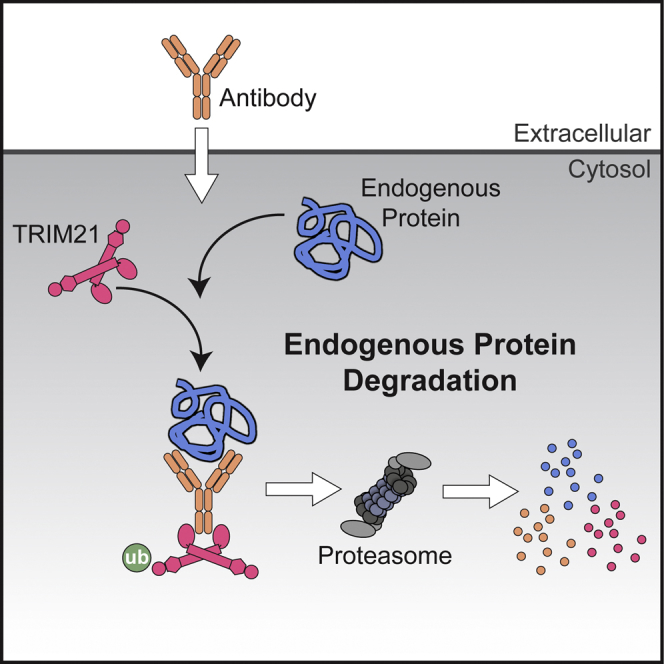
Methods for the targeted disruption of protein function have revolutionized science and greatly expedited the systematic characterization of genes. Two main approaches are currently used to disrupt protein function: DNA knockout and RNA interference, which act at the genome and mRNA level, respectively. A method that directly alters endogenous protein levels is currently not available. Here, we present Trim-Away, a technique to degrade endogenous proteins acutely in mammalian cells without prior modification of the genome or mRNA. Trim-Away harnesses the cellular protein degradation machinery to remove unmodified native proteins within minutes of application. This rapidity minimizes the risk that phenotypes are compensated and that secondary, non-specific defects accumulate over time. Because Trim-Away utilizes antibodies, it can be applied to a wide range of target proteins using off-the-shelf reagents. Trim-Away allows the study of protein function in diverse cell types, including non-dividing primary cells where genome- and RNA-targeting methods are limited.

Overview

The claims and statistics of this paper haven’t been checked yet.

Run the check — free, no account needed. It reads the open-access text and checks the sources it cites.

A few free checks a day · papers already verified open instantly · results are public

Integrity signals

Registry

Crossref · 10.1016/j.cell.2017.10.033

Cites

63 of 63 references verified0 citation errors · 0 not checkable

Statistics

Figures

Graphical abstract
Graphical abstract CC BY · PubMed Central
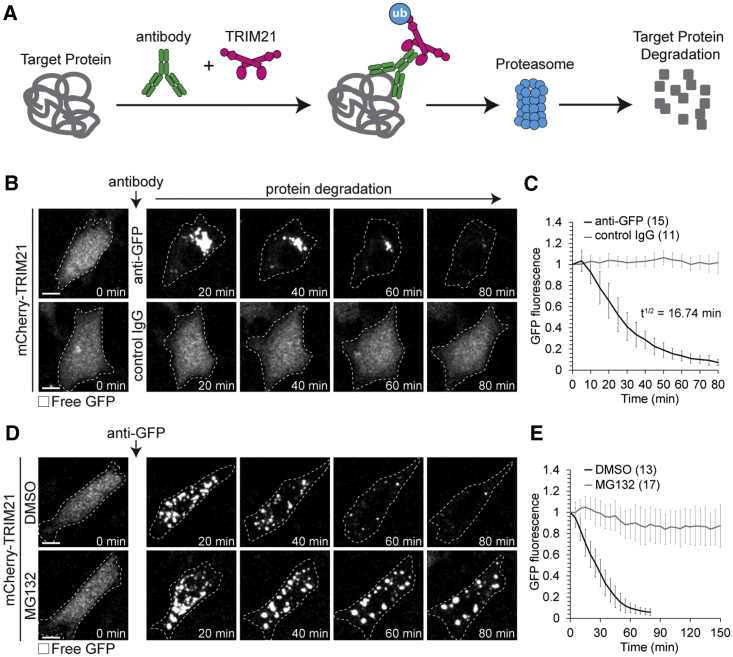
Figure 1 Acute Degradation of Proteins by Trim-Away (A) Schematic of Trim-Away approach. (B–E) NIH 3T3 cells overexpressing mCherry-TRIM21 (not shown) and free GFP (greys) were microinjected with anti-GFP antibody or control IgG (B and C) or treated with DMSO or MG132 and microinjected with anti-GFP antibody (D and E). Time shows minutes (min) from antibody microinjection; 0 min is just before antibody microinjection. Dashed line outlines cell. Scale bars, 10 μm. Error bars show SD. Number of cells is specified in brackets. Data from three (C and E) independent experiments. See also Figures S1 and Figure S3, Figure S4, Figure S5, Figure S6, Figure S7 and Movie S1.
Figure 1 Acute Degradation of Proteins by Trim-Away (A) Schematic of Trim-Away approach. (B–E) NIH 3T3 cells overexpressing mCherry-TRIM21 (not shown) and free GFP (greys) were microinjected with anti-GFP antibody or control IgG (B and C) or treated with DMSO or MG132 and microinjected with anti-GFP antibody (D and E). Time shows minutes (min) from antibody microinjection; 0 min is just before antibody microinjection. Dashed line outlines cell. Scale bars, 10 μm. Error bars show SD. Number of cells is specified in brackets. Data from three (C and E) independent experiments. See also Figures S1 and Figure S3, Figure S4, Figure S5, Figure S6, Figure S7 and Movie S1.CC BY · PubMed Central
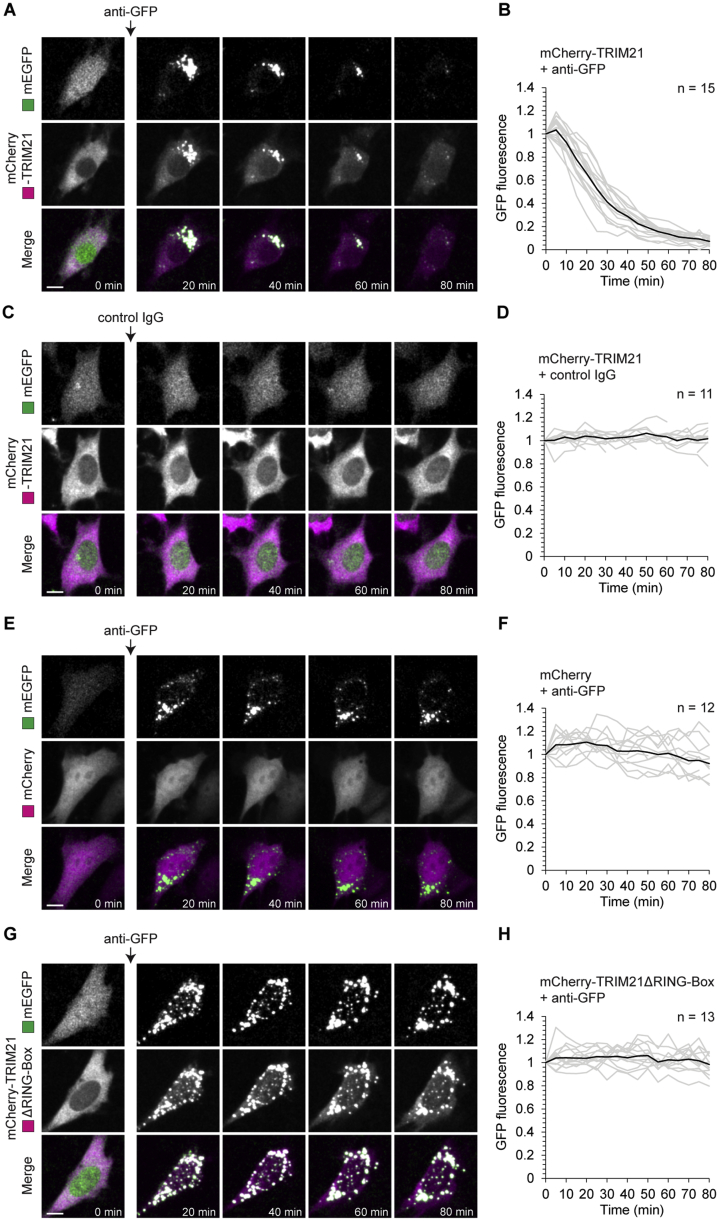
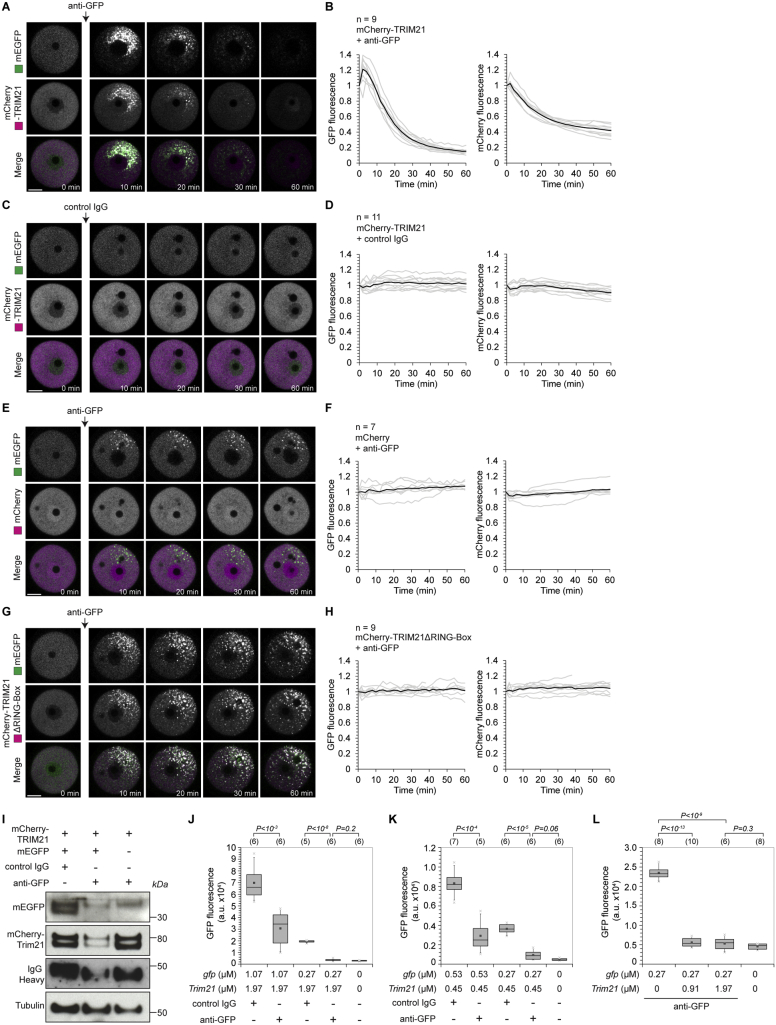
Figure S1 Trim-Away of GFP in NIH 3T3 Cells, Related to Figure 1 NIH 3T3 cells expressing free GFP (green) and either mCherry-TRIM21 (A-D), mCherry (E and F) or mCherry-TRIM21ΔRING-Box (G and H) (magenta) were microinjected with either anti-GFP antibody (A, B and E-H) or control IgG (C and D). Time shows minutes (min) from antibody microinjection; 0 min is just before antibody microinjection. Scale bars, 10 μm. Graphs show plots for individual cells (gray) and mean value (black). Data from three independent experiments (B, D, F and H). See also Movie S1.
Figure S1 Trim-Away of GFP in NIH 3T3 Cells, Related to Figure 1 NIH 3T3 cells expressing free GFP (green) and either mCherry-TRIM21 (A-D), mCherry (E and F) or mCherry-TRIM21ΔRING-Box (G and H) (magenta) were microinjected with either anti-GFP antibody (A, B and E-H) or control IgG (C and D). Time shows minutes (min) from antibody microinjection; 0 min is just before antibody microinjection. Scale bars, 10 μm. Graphs show plots for individual cells (gray) and mean value (black). Data from three independent experiments (B, D, F and H). See also Movie S1.CC BY · PubMed Central
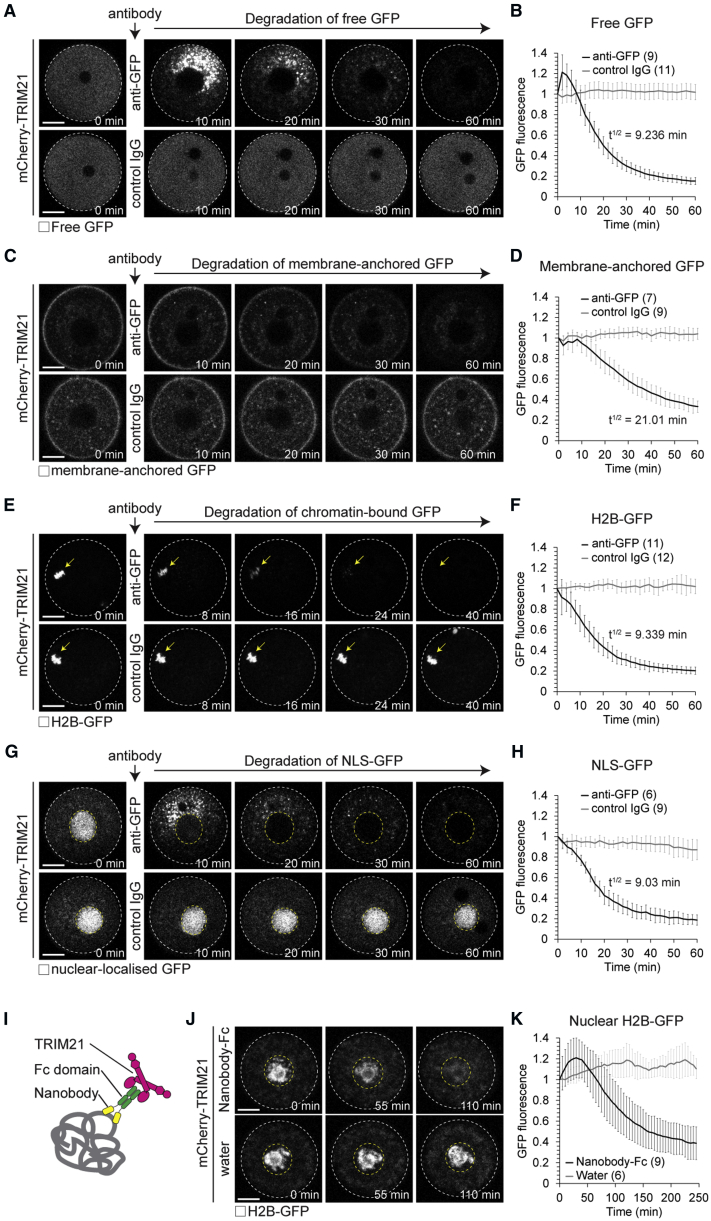
Figure 2 Trim-Away Degrades Diverse Cellular Substrates (A–H) Oocytes overexpressing mCherry-TRIM21 (not shown) and either free GFP (A and B), membrane-anchored GFP (C and D), H2B-GFP (E and F), or NLS-GFP (G and H) were microinjected with either anti-GFP antibody or control IgG. Time shows minutes (min) from antibody microinjection, 0 min is just before antibody microinjection. (I) Schematic of nanobody-Fc fusion approach. (J and K) Prophase-arrested oocytes expressing H2B-GFP were microinjected with either mRNA for mCherry-TRIM21 or mRNA for mCherry-TRIM21 and anti-GFP nanobody-Fc fusion protein. (J) Representative examples and (K) quantification. Time shows minutes (min) from start of imaging. White dashed line outlines oocyte. Yellow arrow shows H2B-GFP. Yellow dashed line outlines nucleus. Scale bars, 20 μm. Error bars show SD. Number of oocytes is specified in brackets. Data from three (B) or two (D, F, H, and K) independent experiments. See also Figure S2, Figure S3, Figure S4, Figure S5, Figure S6, Figure S7.
Figure 2 Trim-Away Degrades Diverse Cellular Substrates (A–H) Oocytes overexpressing mCherry-TRIM21 (not shown) and either free GFP (A and B), membrane-anchored GFP (C and D), H2B-GFP (E and F), or NLS-GFP (G and H) were microinjected with either anti-GFP antibody or control IgG. Time shows minutes (min) from antibody microinjection, 0 min is just before antibody microinjection. (I) Schematic of nanobody-Fc fusion approach. (J and K) Prophase-arrested oocytes expressing H2B-GFP were microinjected with either mRNA for mCherry-TRIM21 or mRNA for mCherry-TRIM21 and anti-GFP nanobody-Fc fusion protein. (J) Representative examples and (K) quantification. Time shows minutes (min) from start of imaging. White dashed line outlines oocyte. Yellow arrow shows H2B-GFP. Yellow dashed line outlines nucleus. Scale bars, 20 μm. Error bars show SD. Number of oocytes is specified in brackets. Data from three (B) or two (D, F, H, and K) independent experiments. See also Figure S2, Figure S3, Figure S4, Figure S5, Figure S6, Figure S7.CC BY · PubMed Central
Figure S2 Trim-Away of GFP in Mouse Oocytes, Related to Figure 2 (A–H) Oocytes expressing free GFP (green) and either mCherry-TRIM21 (A-D), mCherry (E and F) or mCherry-TRIM21ΔRING-Box (G and H) (magenta) were microinjected with either anti-GFP antibody (A, B and E-H) or control IgG (C and D). Time shows minutes (min) from antibody microinjection, 0 min is just before antibody microinjection. Scale bars, 20 μm. Graphs show plots for individual oocytes (gray) and mean value (black). Data from two independent experiments (B, D, F and H). (I) Oocytes expressing either mCherry-TRIM21 and free GFP, or mCherry-TRIM21 alone were microinjected with control IgG or anti-GFP antibodies and whole cell lysates harvested 1 hour later for immunoblotting. (J and K) Oocytes were microinjected with varying amounts of gfp or mCherry-Trim21 mRNA, incubated for 3-5 hours to allow GFP and mCherry-TRIM21 protein expression, microinjected with either PBS, control IgG or ant-GFP antibodies and GFP fluorescence determined 2 hours later by microscopy. Number of oocytes specified in brackets. P values were calculated with Student’s t test.
Figure S2 Trim-Away of GFP in Mouse Oocytes, Related to Figure 2 (A–H) Oocytes expressing free GFP (green) and either mCherry-TRIM21 (A-D), mCherry (E and F) or mCherry-TRIM21ΔRING-Box (G and H) (magenta) were microinjected with either anti-GFP antibody (A, B and E-H) or control IgG (C and D). Time shows minutes (min) from antibody microinjection, 0 min is just before antibody microinjection. Scale bars, 20 μm. Graphs show plots for individual oocytes (gray) and mean value (black). Data from two independent experiments (B, D, F and H). (I) Oocytes expressing either mCherry-TRIM21 and free GFP, or mCherry-TRIM21 alone were microinjected with control IgG or anti-GFP antibodies and whole cell lysates harvested 1 hour later for immunoblotting. (J and K) Oocytes were microinjected with varying amounts of gfp or mCherry-Trim21 mRNA, incubated for 3-5 hours to allow GFP and mCherry-TRIM21 protein expression, microinjected with either PBS, control IgG or ant-GFP antibodies and GFP fluorescence determined 2 hours later by microscopy. Number of oocytes specified in brackets. P values were calculated with Student’s t test.CC BY · PubMed Central
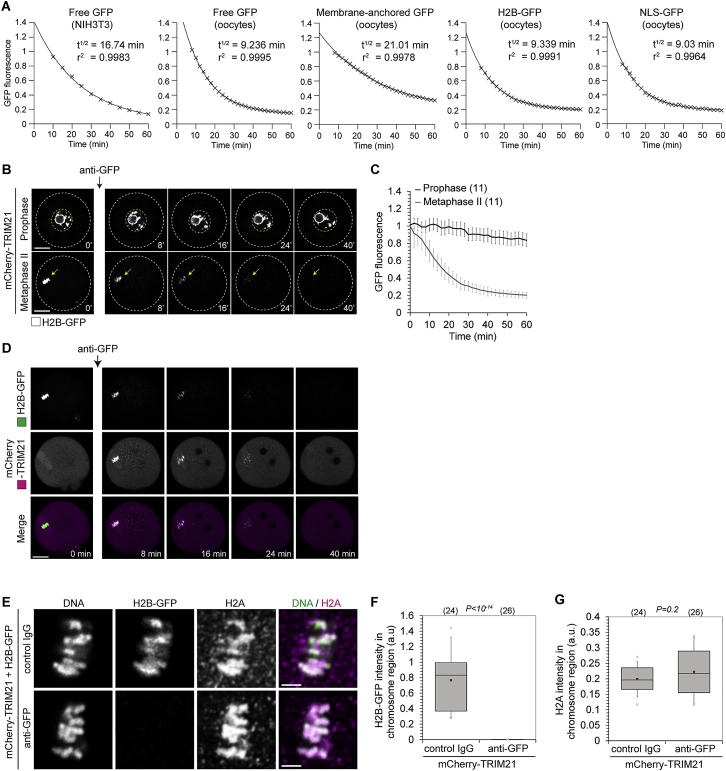
Figure S3 Trim-Away of Diverse Cellular Substrates, Related to Figures 1 and 2 (A) Prism (GraphPad) software was used to fit single phase decay curves to the mean values (black crosses) of GFP fluorescence taken from data shown in Figures 1C, 2B, 2D, 2F, and 2H. T1/2 indicates half-life in minutes (min). R2 indicates goodness of fit of single phase decay curve. (B and C) Oocytes overexpressing mCherry-TRIM21 (not shown) and H2B-GFP (greys) were arrested in prophase or metaphase of meiosis II and microinjected with anti-GFP antibody. Time shows minutes (min) from antibody microinjection. White dashed lines outline oocytes. Yellow arrows show H2B-GFP. Yellow dashed lines outline nucleus. Scale bars, 20 μm. Error bars show s.d. Number of oocytes in brackets. Data from two independent experiments. (D) Oocytes overexpressing mCherry-TRIM21 (magenta) and H2B-GFP (green) were microinjected with anti-GFP antibody. mCherry-TRIM21 recruitment and H2B-GFP degradation occurs in the chromosome region, suggesting that H2B-GFP is degraded while assembled in nucleosomes. Time minutes (min) from microinjection. Scale bar, 20 μm. (E) Oocytes overexpressing mCherry-TRIM21 and H2B-GFP were microinjected with either control IgG or anti-GFP antibody and fixed 1 hour later for immunofluorescence. DNA stained with Hoechst. Scale bar, 5 μm. (D–G) Trim-Away of H2B-GFP does not cause degradation of H2A. Immunofluorescence images show normal chromosome morphology and H2A localization following H2B-GFP degradation (E). Boxplots of H2B-GFP (F) and H2A (G) intensity in the chromosome region. Degradation of H2B-GFP did not affect the levels of histone H2A on chromosomes, implying that the remaining components of the histone complex were not co-degraded with H2B-GFP. Number of cells in brackets. Data from two independent experiments. P values were calculated with Student’s t test.
Figure S3 Trim-Away of Diverse Cellular Substrates, Related to Figures 1 and 2 (A) Prism (GraphPad) software was used to fit single phase decay curves to the mean values (black crosses) of GFP fluorescence taken from data shown in Figures 1C, 2B, 2D, 2F, and 2H. T1/2 indicates half-life in minutes (min). R2 indicates goodness of fit of single phase decay curve. (B and C) Oocytes overexpressing mCherry-TRIM21 (not shown) and H2B-GFP (greys) were arrested in prophase or metaphase of meiosis II and microinjected with anti-GFP antibody. Time shows minutes (min) from antibody microinjection. White dashed lines outline oocytes. Yellow arrows show H2B-GFP. Yellow dashed lines outline nucleus. Scale bars, 20 μm. Error bars show s.d. Number of oocytes in brackets. Data from two independent experiments. (D) Oocytes overexpressing mCherry-TRIM21 (magenta) and H2B-GFP (green) were microinjected with anti-GFP antibody. mCherry-TRIM21 recruitment and H2B-GFP degradation occurs in the chromosome region, suggesting that H2B-GFP is degraded while assembled in nucleosomes. Time minutes (min) from microinjection. Scale bar, 20 μm. (E) Oocytes overexpressing mCherry-TRIM21 and H2B-GFP were microinjected with either control IgG or anti-GFP antibody and fixed 1 hour later for immunofluorescence. DNA stained with Hoechst. Scale bar, 5 μm. (D–G) Trim-Away of H2B-GFP does not cause degradation of H2A. Immunofluorescence images show normal chromosome morphology and H2A localization following H2B-GFP degradation (E). Boxplots of H2B-GFP (F) and H2A (G) intensity in the chromosome region. Degradation of H2B-GFP did not affect the levels of histone H2A on chromosomes, implying that the remaining components of the histone complex were not co-degraded with H2B-GFP. Number of cells in brackets. Data from two independent experiments. P values were calculated with Student’s t test.CC BY · PubMed Central
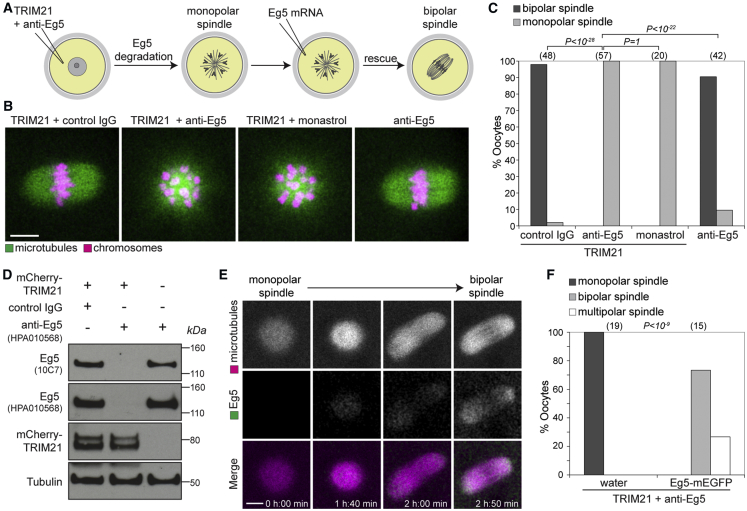
Figure 3 Trim-Away of Endogenous Eg5 Protein (A) Schematic of Eg5 Trim-Away and rescue experiments. (B and C) Oocytes overexpressing TRIM21 and microinjected with either control IgG, anti-Eg5 or treated with monastrol, or oocytes microinjected with anti-Eg5 alone were assessed for spindle morphology. (B) Representative examples and (C) quantification. Microtubules and chromosomes were labeled with mEGFP-Map4 and H2B-mCherry, respectively. (D) Whole oocyte lysates were immunoblotted for the indicated proteins. (E and F) Oocytes overexpressing TRIM21 and microinjected with anti-Eg5 antibody were allowed to form a monopolar spindle and then microinjected with either water or Eg5-mEGFP mRNA and scored for spindle morphology. (E) Representative examples and (F) quantification. Microtubules were labeled with mCherry-MAP4. Scale bars, 10 μm. Number of oocytes is specified in brackets. Data from two (D and F) or four (C) independent experiments. P values were calculated with Fisher’s exact test. See also Figures S4, S6, and S7 and Movie S2.
Figure 3 Trim-Away of Endogenous Eg5 Protein (A) Schematic of Eg5 Trim-Away and rescue experiments. (B and C) Oocytes overexpressing TRIM21 and microinjected with either control IgG, anti-Eg5 or treated with monastrol, or oocytes microinjected with anti-Eg5 alone were assessed for spindle morphology. (B) Representative examples and (C) quantification. Microtubules and chromosomes were labeled with mEGFP-Map4 and H2B-mCherry, respectively. (D) Whole oocyte lysates were immunoblotted for the indicated proteins. (E and F) Oocytes overexpressing TRIM21 and microinjected with anti-Eg5 antibody were allowed to form a monopolar spindle and then microinjected with either water or Eg5-mEGFP mRNA and scored for spindle morphology. (E) Representative examples and (F) quantification. Microtubules were labeled with mCherry-MAP4. Scale bars, 10 μm. Number of oocytes is specified in brackets. Data from two (D and F) or four (C) independent experiments. P values were calculated with Fisher’s exact test. See also Figures S4, S6, and S7 and Movie S2.CC BY · PubMed Central
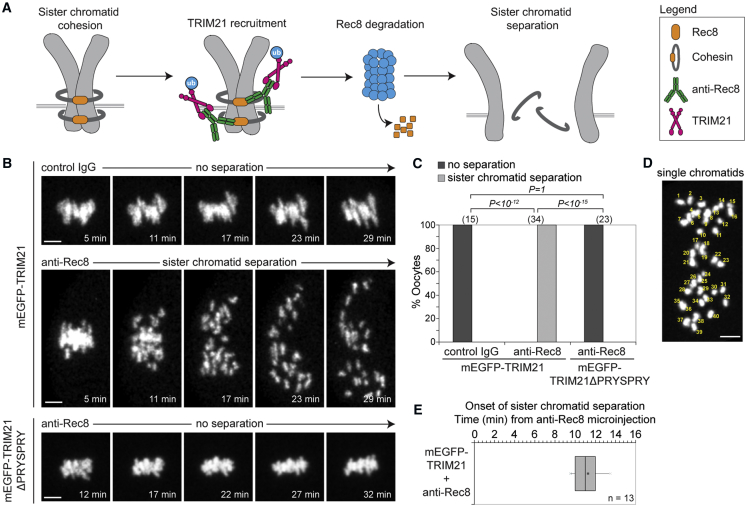
Figure 4 Trim-Away of Long-Lived Rec8 Protein (A) Schematic of Rec8 Trim-Away experiment. (B and C) Eggs overexpressing mEGFP-TRIM21 or mEGFP-TRIM21ΔPRYSPRY (not shown) were microinjected with either control IgG or anti-Rec8 antibody and chromosome morphology (H2B-mCherry; greys) followed by live imaging. (B) Representative examples and (C) quantification. (D and E) Single chromatid count (D) and boxplot of time of onset of sister chromatid separation (E) in eggs overexpressing mEGFP-TRIM21 following microinjection of anti-Rec8 antibody. Scale bars, 5 μm. Time shows minutes (min) from microinjection. Number of eggs in brackets. Data from three (C) or two (E) independent experiments. P values were calculated with Fisher’s exact test. See also Figures S4, S6, and S7 and Movie S3.
Figure 4 Trim-Away of Long-Lived Rec8 Protein (A) Schematic of Rec8 Trim-Away experiment. (B and C) Eggs overexpressing mEGFP-TRIM21 or mEGFP-TRIM21ΔPRYSPRY (not shown) were microinjected with either control IgG or anti-Rec8 antibody and chromosome morphology (H2B-mCherry; greys) followed by live imaging. (B) Representative examples and (C) quantification. (D and E) Single chromatid count (D) and boxplot of time of onset of sister chromatid separation (E) in eggs overexpressing mEGFP-TRIM21 following microinjection of anti-Rec8 antibody. Scale bars, 5 μm. Time shows minutes (min) from microinjection. Number of eggs in brackets. Data from three (C) or two (E) independent experiments. P values were calculated with Fisher’s exact test. See also Figures S4, S6, and S7 and Movie S3.CC BY · PubMed Central
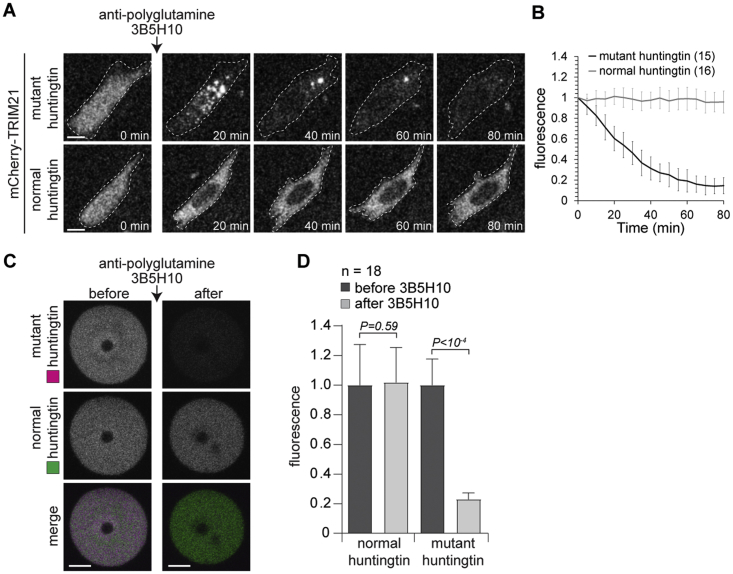
Figure S4 Selective Trim-Away of Mutant Huntingtin Protein, Related to Figure 1, Figure 2, Figure 3, Figure 4, Figure 5, Figure 6, Figure 7 (A and B) NIH 3T3 cells overexpressing mCherry-TRIM21 (not shown) and either EGFP-Htt74Q (mutant Huntingtin; greys) or EGFP-Htt23Q (normal huntingtin; greys) were microinjected with 3B5H10 antibody. Time shows minutes (min) from antibody microinjection; 0 min is just before antibody microinjection. Dashed line outlines cell. Scale bars, 10 μm. (C and D) Oocytes co-expressing TRIM21, EGFP-Htt74Q (mutant Huntingtin; magenta) and EGFP-Htt23Q (normal huntingtin; green) were imaged before and 2.5 hours after microinjection of 3B5H10 antibody. Scale bars, 20 μm. Error bars show s.d. Number of cells in brackets in (B); n refers to number of oocytes in (D). Data from two independent experiments. P values were calculated with Student’s t test.
Figure S4 Selective Trim-Away of Mutant Huntingtin Protein, Related to Figure 1, Figure 2, Figure 3, Figure 4, Figure 5, Figure 6, Figure 7 (A and B) NIH 3T3 cells overexpressing mCherry-TRIM21 (not shown) and either EGFP-Htt74Q (mutant Huntingtin; greys) or EGFP-Htt23Q (normal huntingtin; greys) were microinjected with 3B5H10 antibody. Time shows minutes (min) from antibody microinjection; 0 min is just before antibody microinjection. Dashed line outlines cell. Scale bars, 10 μm. (C and D) Oocytes co-expressing TRIM21, EGFP-Htt74Q (mutant Huntingtin; magenta) and EGFP-Htt23Q (normal huntingtin; green) were imaged before and 2.5 hours after microinjection of 3B5H10 antibody. Scale bars, 20 μm. Error bars show s.d. Number of cells in brackets in (B); n refers to number of oocytes in (D). Data from two independent experiments. P values were calculated with Student’s t test.CC BY · PubMed Central
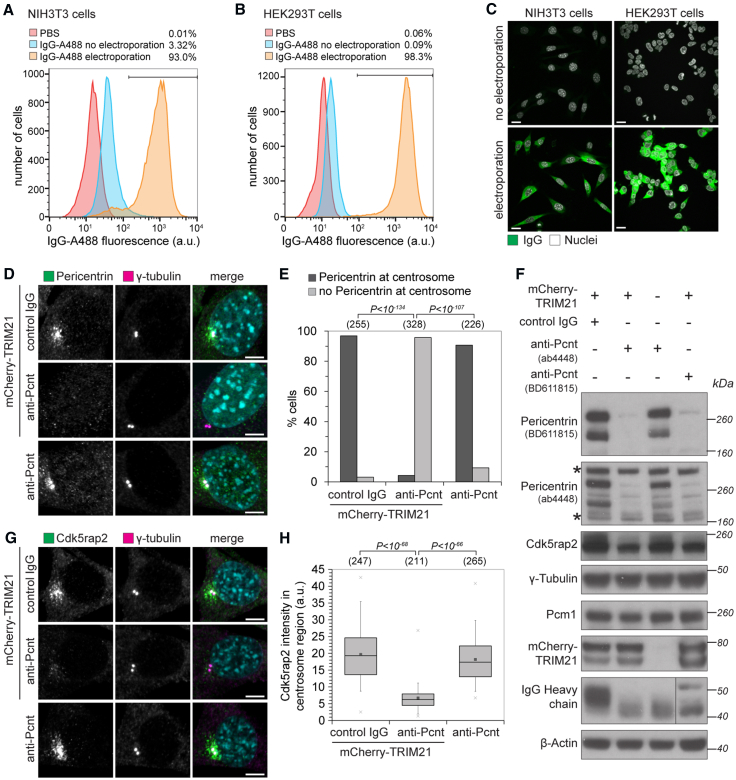
Figure 5 Trim-Away of Pericentrin by Antibody Electroporation (A–C) NIH 3T3 and HEK293T cells were electroporated with Alexa Fluor 488-labeled IgG and analyzed 3 hr later by flow cytometry (A and B) or fixed 16 hr later and analyzed by microscopy (C). At least 2,000 cells were counted for each condition. Percentages correspond to IgG-positive cells falling within the gate drawn. Scale bars, 10 μm. (D–H) NIH 3T3 and NIH 3T3-mCherry-TRIM21 cell lines were electroporated with control IgG or anti-pericentrin antibodies and analyzed 16 hr later for pericentrin (D and E) and Cdk5rap2 localization (G and H). Number of cells in brackets. Scale bars, 5 μm. DNA stained with Hoechst. (F) Cell lysates were immunoblotted for the indicated proteins. Asterisks show non-specific bands not degraded by Trim-Away. Data from two independent experiments (E and H). P values were calculated with Fisher’s exact (E) or Student’s t test (H). See also Figure S4, Figure S5, Figure S6, Figure S7.
Figure 5 Trim-Away of Pericentrin by Antibody Electroporation (A–C) NIH 3T3 and HEK293T cells were electroporated with Alexa Fluor 488-labeled IgG and analyzed 3 hr later by flow cytometry (A and B) or fixed 16 hr later and analyzed by microscopy (C). At least 2,000 cells were counted for each condition. Percentages correspond to IgG-positive cells falling within the gate drawn. Scale bars, 10 μm. (D–H) NIH 3T3 and NIH 3T3-mCherry-TRIM21 cell lines were electroporated with control IgG or anti-pericentrin antibodies and analyzed 16 hr later for pericentrin (D and E) and Cdk5rap2 localization (G and H). Number of cells in brackets. Scale bars, 5 μm. DNA stained with Hoechst. (F) Cell lysates were immunoblotted for the indicated proteins. Asterisks show non-specific bands not degraded by Trim-Away. Data from two independent experiments (E and H). P values were calculated with Fisher’s exact (E) or Student’s t test (H). See also Figure S4, Figure S5, Figure S6, Figure S7.CC BY · PubMed Central
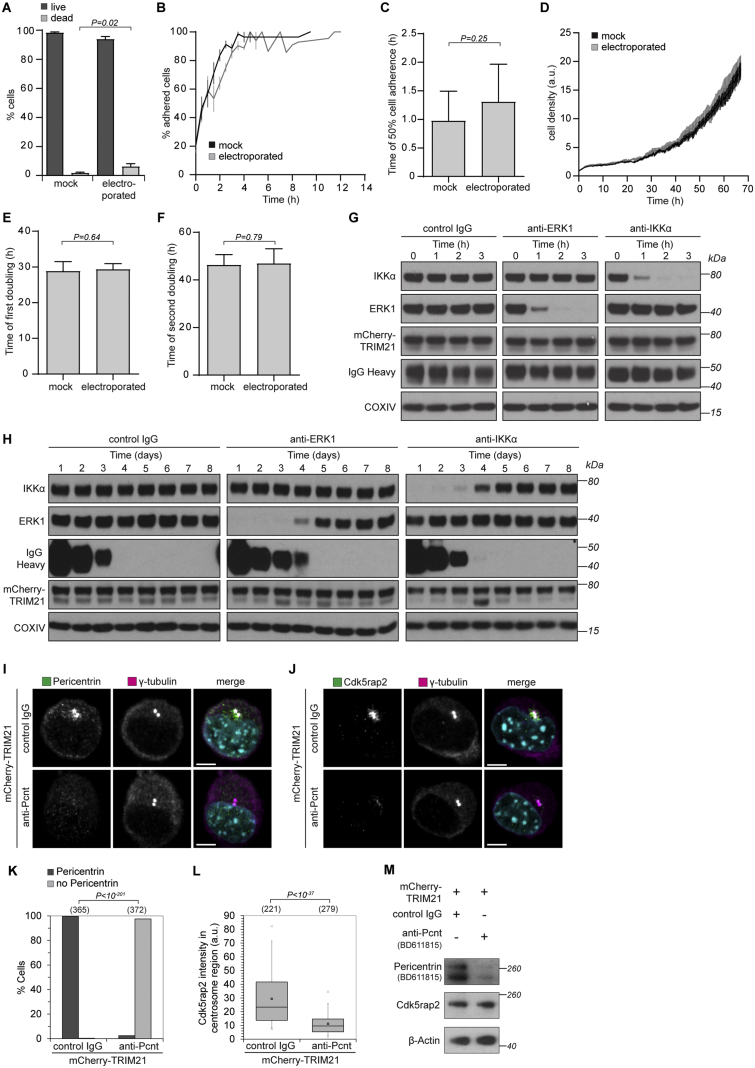
Figure S5 Time Frame for Protein Depletion by Trim-Away, Related to Figure 5 (A–F) NIH 3T3-mCherry-TRIM21 cells were taken up into the Neon Pipette Tip and either electroporated or not (mock). Percentage of dead cells was determined using the trypan blue exclusion assay (A). For long-term analysis of cellular behavior cells were imaged every 15 min for 70 h following electroporation (B-F). For the growth curves cell density was normalized to the initial density once cells had adhered (D). For adherence analysis the percentage of spread cells was quantified in each frame (B and C). Doubling times (E and F) were calculated taking the 5 h time point as reference, because cells were fully adhered then. Data from three independent experiments. Error bars show s.d. P values were calculated with Student’s t test. See also Movie S4. (G and H) HEK293T-mCherry-TRIM21 cells were electroporated with either control IgG, anti-ERK1 or anti-IKKα antibodies and whole cell lysates harvested at the indicated times after electroporation for immunoblotting. (I–M) NIH 3T3-mCherry-TRIM21 cells were electroporated with control IgG or anti-Pericentrin antibody (BD611815) and 3 hours later analyzed for Pericentrin (I and K) or Cdk5rap2 (J and L) localization or cell lysates were immunoblotted for the indicated proteins (M). Merge also shows DNA stained with Hoechst. Number of cells in brackets. Scale bars, 5 μm. Data from two independent experiments. P values were calculated with Fisher’s exact (K) or Student’s t test (L).
Figure S5 Time Frame for Protein Depletion by Trim-Away, Related to Figure 5 (A–F) NIH 3T3-mCherry-TRIM21 cells were taken up into the Neon Pipette Tip and either electroporated or not (mock). Percentage of dead cells was determined using the trypan blue exclusion assay (A). For long-term analysis of cellular behavior cells were imaged every 15 min for 70 h following electroporation (B-F). For the growth curves cell density was normalized to the initial density once cells had adhered (D). For adherence analysis the percentage of spread cells was quantified in each frame (B and C). Doubling times (E and F) were calculated taking the 5 h time point as reference, because cells were fully adhered then. Data from three independent experiments. Error bars show s.d. P values were calculated with Student’s t test. See also Movie S4. (G and H) HEK293T-mCherry-TRIM21 cells were electroporated with either control IgG, anti-ERK1 or anti-IKKα antibodies and whole cell lysates harvested at the indicated times after electroporation for immunoblotting. (I–M) NIH 3T3-mCherry-TRIM21 cells were electroporated with control IgG or anti-Pericentrin antibody (BD611815) and 3 hours later analyzed for Pericentrin (I and K) or Cdk5rap2 (J and L) localization or cell lysates were immunoblotted for the indicated proteins (M). Merge also shows DNA stained with Hoechst. Number of cells in brackets. Scale bars, 5 μm. Data from two independent experiments. P values were calculated with Fisher’s exact (K) or Student’s t test (L).CC BY · PubMed Central
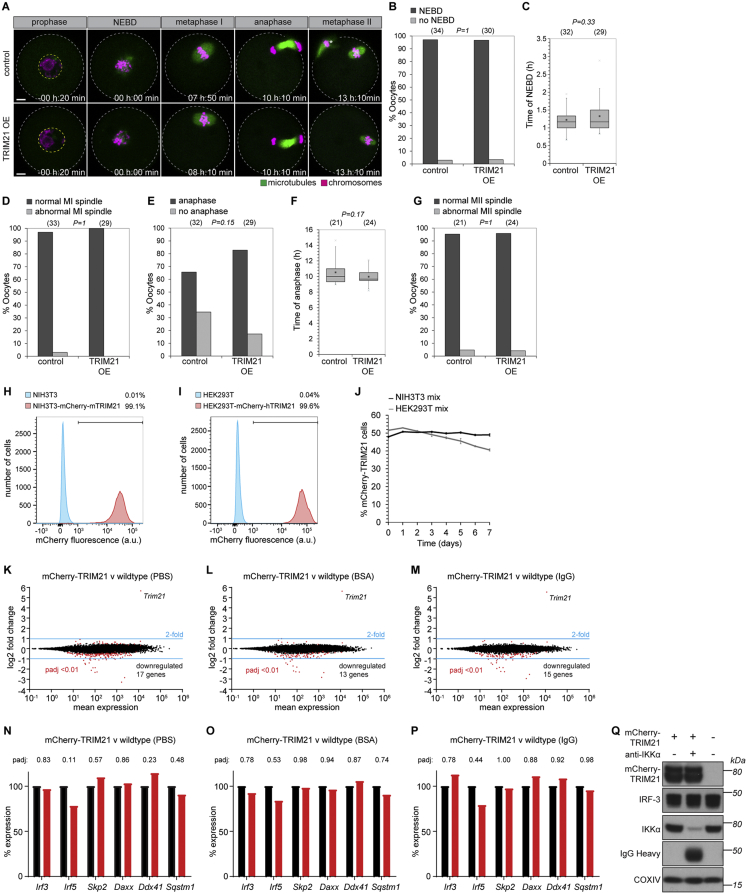
Figure S6 TRIM21 Overexpression Does Not Perturb Cells, Related to Figure 1, Figure 2, Figure 3, Figure 4, Figure 5, Figure 6, Figure 7 (A) Oocytes microinjected with either water (control) or Trim21 mRNA (TRIM21 OE) were imaged for sixteen hours following release from prophase arrest. Microtubules and chromosomes were labeled with mEGFP-Map4 and H2B-mCherry respectively. Time shows hours and minutes (h:min) from nuclear envelope breakdown (NEBD). Scale bars, 10 μm. White dashed line outlines oocyte. Yellow dashed line outlines nucleus. (B–G) Key events in meiosis were quantified. Number of oocytes is specified in brackets. P values were calculated with Fisher’s exact test (B, D, E and G) or Student’s t test (C and F). (H and I) NIH 3T3, NIH 3T3-mCherry-mTRIM21, HEK293T and HEK293T-mCherry-hTRIM21 cell lines were analyzed by flow cytometry. At least 2000 cells were counted for each condition. Percentages correspond to mCherry-positive cells falling within the gate drawn. (J) NIH 3T3 and NIH 3T3-mCherry-mTRIM21 cells (NIH 3T3 mix) or HEK293T and HEK293T-mCherry-hTRIM21 cells (HEK293T mix) were mixed 50:50 and percentage mCherry cells analyzed by flow cytometry every 24h for 7 days. At least 10,000 cells counted at each time point. Error bars show s.d. Data from 3 independent replicates. (K–M) Transcriptomes of NIH 3T3-mCherry-mTRIM21 cells were compared to wild-type NIH 3T3 cells by RNA-seq analysis (STAR Methods) following electroporation with PBS (K), BSA (L) or IgG (M). A total of only 8 protein-encoding transcripts were consistently downregulated more than 2-fold in the NIH 3T3-mCherry-mTRIM21 cells (Kdm5d, Ddx3y, Eif2s3y, Uty, Asb4, Fat4, Papss2 and Lama2), although we cannot rule out the possibility that this is an indirect consequence of lentivirus construct integration rather than a direct consequence of TRIM21 overexpression. (N–P) Relative expression levels of genes encoding proteins reported to be ligands of TRIM21. Taken from RNA sequencing data. Irf8 was not detected. See also Tables S1, S2, and S3. (Q) HEK293T and HEK293T-mCherry-hTRIM21 cells were electroporated with PBS or anti-IKKα antibody and whole cell lysates harvested 3 hours later for immunoblotting. IRF-3 protein levels are unaffected by TRIM21 overexpression or activation.
Figure S6 TRIM21 Overexpression Does Not Perturb Cells, Related to Figure 1, Figure 2, Figure 3, Figure 4, Figure 5, Figure 6, Figure 7 (A) Oocytes microinjected with either water (control) or Trim21 mRNA (TRIM21 OE) were imaged for sixteen hours following release from prophase arrest. Microtubules and chromosomes were labeled with mEGFP-Map4 and H2B-mCherry respectively. Time shows hours and minutes (h:min) from nuclear envelope breakdown (NEBD). Scale bars, 10 μm. White dashed line outlines oocyte. Yellow dashed line outlines nucleus. (B–G) Key events in meiosis were quantified. Number of oocytes is specified in brackets. P values were calculated with Fisher’s exact test (B, D, E and G) or Student’s t test (C and F). (H and I) NIH 3T3, NIH 3T3-mCherry-mTRIM21, HEK293T and HEK293T-mCherry-hTRIM21 cell lines were analyzed by flow cytometry. At least 2000 cells were counted for each condition. Percentages correspond to mCherry-positive cells falling within the gate drawn. (J) NIH 3T3 and NIH 3T3-mCherry-mTRIM21 cells (NIH 3T3 mix) or HEK293T and HEK293T-mCherry-hTRIM21 cells (HEK293T mix) were mixed 50:50 and percentage mCherry cells analyzed by flow cytometry every 24h for 7 days. At least 10,000 cells counted at each time point. Error bars show s.d. Data from 3 independent replicates. (K–M) Transcriptomes of NIH 3T3-mCherry-mTRIM21 cells were compared to wild-type NIH 3T3 cells by RNA-seq analysis (STAR Methods) following electroporation with PBS (K), BSA (L) or IgG (M). A total of only 8 protein-encoding transcripts were consistently downregulated more than 2-fold in the NIH 3T3-mCherry-mTRIM21 cells (Kdm5d, Ddx3y, Eif2s3y, Uty, Asb4, Fat4, Papss2 and Lama2), although we cannot rule out the possibility that this is an indirect consequence of lentivirus construct integration rather than a direct consequence of TRIM21 overexpression. (N–P) Relative expression levels of genes encoding proteins reported to be ligands of TRIM21. Taken from RNA sequencing data. Irf8 was not detected. See also Tables S1, S2, and S3. (Q) HEK293T and HEK293T-mCherry-hTRIM21 cells were electroporated with PBS or anti-IKKα antibody and whole cell lysates harvested 3 hours later for immunoblotting. IRF-3 protein levels are unaffected by TRIM21 overexpression or activation.CC BY · PubMed Central
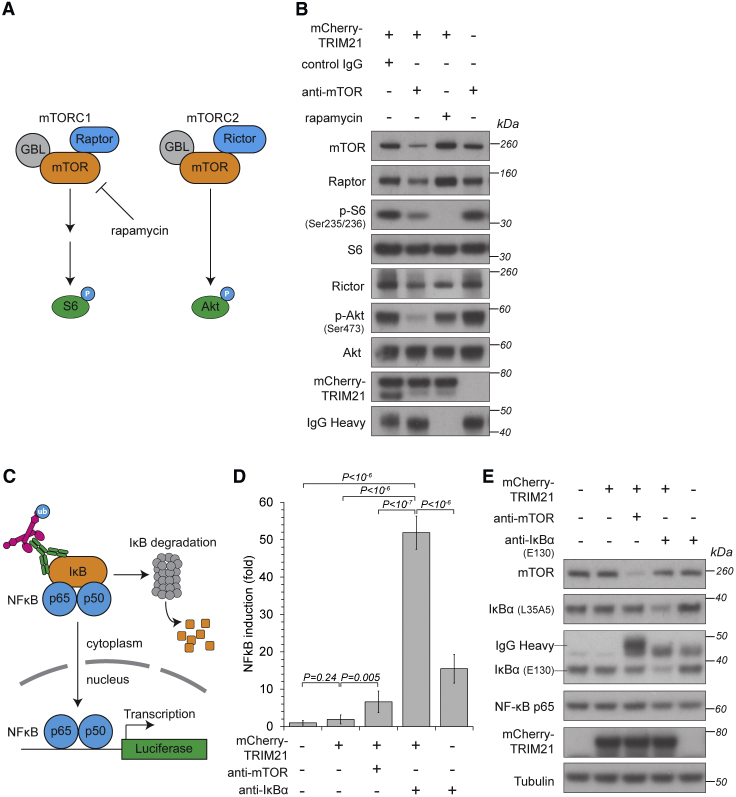
Figure 6 Selective Trim-Away of Signaling Pathway Components (A) Schematic of mTOR function. Rapamycin inhibits only mTORC1. (B) HEK293T and HEK293T-mCherry-TRIM21 cell lines were electroporated with control IgG, anti-mTOR antibody or treated with rapamycin, harvested 5 hr later, and cell lysates immunoblotted for the indicated proteins. (C) Schematic of IκBα Trim-Away experiment. (D and E) HEK293T and HEK293T-mCherry-TRIM21 cell lines transfected with NF-κB-luciferase reporter plasmid were electroporated with PBS, anti-mTOR, or anti-IκBα antibodies and 5 hr later analyzed for luciferase activity (D) or harvested and lysates blotted for the indicated proteins (E). Error bars show SD. Representative examples from two (B) or four (D and E) independent experiments. P values were calculated with Student’s t test. See also Figures S4, S6, and S7.
Figure 6 Selective Trim-Away of Signaling Pathway Components (A) Schematic of mTOR function. Rapamycin inhibits only mTORC1. (B) HEK293T and HEK293T-mCherry-TRIM21 cell lines were electroporated with control IgG, anti-mTOR antibody or treated with rapamycin, harvested 5 hr later, and cell lysates immunoblotted for the indicated proteins. (C) Schematic of IκBα Trim-Away experiment. (D and E) HEK293T and HEK293T-mCherry-TRIM21 cell lines transfected with NF-κB-luciferase reporter plasmid were electroporated with PBS, anti-mTOR, or anti-IκBα antibodies and 5 hr later analyzed for luciferase activity (D) or harvested and lysates blotted for the indicated proteins (E). Error bars show SD. Representative examples from two (B) or four (D and E) independent experiments. P values were calculated with Student’s t test. See also Figures S4, S6, and S7.CC BY · PubMed Central
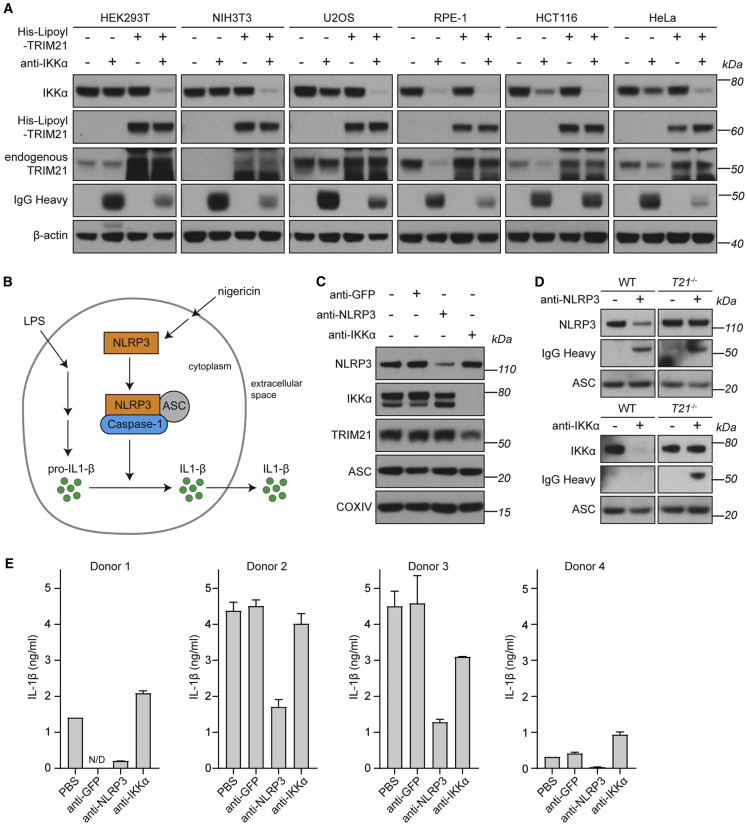
Figure 7 Trim-Away in Unmodified Cells and Primary Human Macrophages (A) The indicated cell lines were electroporated with PBS, anti-IKKα antibody, His-Lipoyl-TRIM21, or anti-IKKα + His-Lipoyl-TRIM21 and whole cell lysates harvested 3 hr later for immunoblotting. (B) Schematic of NLRP3 function. (C) HMDMs were electroporated with PBS, anti-GFP, ant-NLRP3, or anti-IKKα antibodies, then stimulated with 10 ng/mL LPS for 4 hr before collecting whole cell lysates for immunoblotting. (D) Bone marrow-derived macrophages (BMDMs) from wild-type (WT) or Trim21 knockout (T21−/−) mice were electroporated with PBS, ant-NLRP3, or anti-IKKα antibodies, then stimulated with 10 ng/mL LPS for 4 hr before collecting whole cell lysates for immunoblotting. (E) HMDMs from 4 different blood donors were electroporated with PBS, anti-GFP, ant-NLRP3, or anti-IKKα antibodies and assayed for inflammasome activation (STAR Methods). Mean IL-1β values taken from 2 replicates for each condition are shown for each donor. Error bars show SD. See also Figures S4, S6, and S7.
Figure 7 Trim-Away in Unmodified Cells and Primary Human Macrophages (A) The indicated cell lines were electroporated with PBS, anti-IKKα antibody, His-Lipoyl-TRIM21, or anti-IKKα + His-Lipoyl-TRIM21 and whole cell lysates harvested 3 hr later for immunoblotting. (B) Schematic of NLRP3 function. (C) HMDMs were electroporated with PBS, anti-GFP, ant-NLRP3, or anti-IKKα antibodies, then stimulated with 10 ng/mL LPS for 4 hr before collecting whole cell lysates for immunoblotting. (D) Bone marrow-derived macrophages (BMDMs) from wild-type (WT) or Trim21 knockout (T21−/−) mice were electroporated with PBS, ant-NLRP3, or anti-IKKα antibodies, then stimulated with 10 ng/mL LPS for 4 hr before collecting whole cell lysates for immunoblotting. (E) HMDMs from 4 different blood donors were electroporated with PBS, anti-GFP, ant-NLRP3, or anti-IKKα antibodies and assayed for inflammasome activation (STAR Methods). Mean IL-1β values taken from 2 replicates for each condition are shown for each donor. Error bars show SD. See also Figures S4, S6, and S7.CC BY · PubMed Central
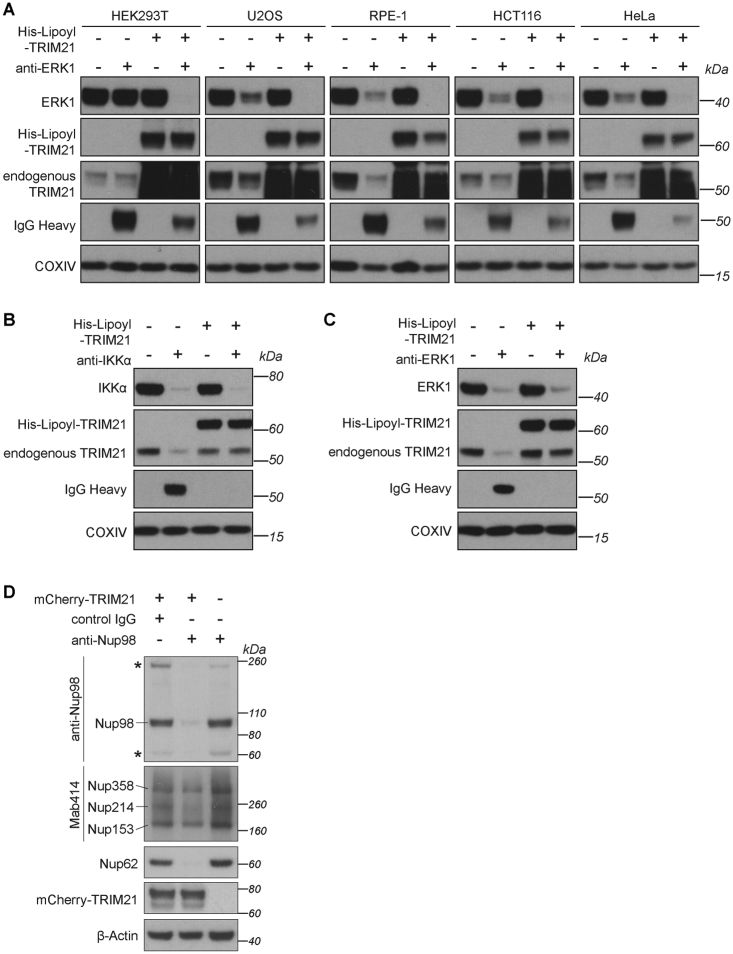
Figure S7 Requirements for Trim-Away Efficiency and Specificity, Related to Figure 1, Figure 2, Figure 3, Figure 4, Figure 5, Figure 6, Figure 7 (A) The indicated cell lines were electroporated with PBS, anti-ERK1 antibody, His-Lipoyl-TRIM21, or anti-ERK1 + His-Lipoyl-TRIM21 and whole cell lysates harvested 3 hours later for immunoblotting. (B and C) Normal human lung fibroblasts (NHLFs) were electroporated with the indicated proteins/antibodies and whole cell lysates harvested 3 hours later for immunoblotting. (D) HEK293T and HEK293T-mCherry-TRIM21 cell lines were electroporated with control IgG or an antibody directed against the Nucleoporin Nup98 (anti-Nup98), harvested 3 hours later and lysates immunoblotted for the indicated proteins. The Nup98 antibody was raised against the Nup98 N terminus, which is rich in phenylalanine-glycine (FG) repeats. The FG-repeats are shared by several other nucleoporins collectively known as the FG Nups (Brohawn et al., 2009). Asterisks show additional bands recognized by the anti-Nup98 antibody which are the same size as Nup214 and Nup62 recognized by the Mab414 and anti-Nup62 antibodies respectively. Consistent with non-specific binding, Trim-Away using the anti-Nup98 N-terminal antibody also triggered degradation of Nup62 and Nup214. Other nucleoporins Nup358 and Nup153 were not degraded, suggesting that co-depletion was not the result of degradation of the entire nuclear pore complex.
Figure S7 Requirements for Trim-Away Efficiency and Specificity, Related to Figure 1, Figure 2, Figure 3, Figure 4, Figure 5, Figure 6, Figure 7 (A) The indicated cell lines were electroporated with PBS, anti-ERK1 antibody, His-Lipoyl-TRIM21, or anti-ERK1 + His-Lipoyl-TRIM21 and whole cell lysates harvested 3 hours later for immunoblotting. (B and C) Normal human lung fibroblasts (NHLFs) were electroporated with the indicated proteins/antibodies and whole cell lysates harvested 3 hours later for immunoblotting. (D) HEK293T and HEK293T-mCherry-TRIM21 cell lines were electroporated with control IgG or an antibody directed against the Nucleoporin Nup98 (anti-Nup98), harvested 3 hours later and lysates immunoblotted for the indicated proteins. The Nup98 antibody was raised against the Nup98 N terminus, which is rich in phenylalanine-glycine (FG) repeats. The FG-repeats are shared by several other nucleoporins collectively known as the FG Nups (Brohawn et al., 2009). Asterisks show additional bands recognized by the anti-Nup98 antibody which are the same size as Nup214 and Nup62 recognized by the Mab414 and anti-Nup62 antibodies respectively. Consistent with non-specific binding, Trim-Away using the anti-Nup98 N-terminal antibody also triggered degradation of Nup62 and Nup214. Other nucleoporins Nup358 and Nup153 were not degraded, suggesting that co-depletion was not the result of degradation of the entire nuclear pore complex.CC BY · PubMed Central

Verification

Claims the paper makes

The claims and statistics of this paper haven’t been checked yet.

Run the check — free, no account needed. It reads the open-access text and checks the sources it cites.

A few free checks a day · papers already verified open instantly · results are public

Claims other papers make about this one

Each is checked against this paper’s own text: does it say what the citing paper says it does?

Self-check

Percentages, sums and reported differences re-computed from the paper’s own numbers.

The self-check needs the paper’s full text.

Citations

Cites

Show all 65 references

Cited by

Sorted by citations

See all 533

Metadata

Authors
Clift, D., McEwan, W. A., Labzin, L. I., Konieczny, V., Mogessie, B., James, L. C., & Schuh, M.
Affiliations
  • MRC Laboratory of Molecular Biology (GB)
  • Max Planck Institute for Biophysical Chemistry (DE)
Corresponding author
  • Clift, Dean
  • James, Leo C.
  • Schuh, Melina
Venue
Cell
Publisher
Elsevier BV
Published
2017-12
Volume
171
Issue
7
Pages
1692-1706.e18
ISSN
0092-8674 (ISSN-L)
OpenAlex
W2769995426
Cited by
531
References
65
Citations by year
2026: 65 · 2025: 85 · 2024: 59 · 2023: 72 · 2022: 52 · 2021: 62 · 2020: 58 · 2019: 45 · 2018: 30 · 2017: 2
FWCI
15.00
Type
journal article
Language
en
Open access
Locations
  • Cell (publishedVersion, cc-by)
  • Europe PMC (PubMed Central) (publishedVersion, cc-by)
  • PubMed Central (publishedVersion, cc-by)
  • PubMed (publishedVersion)
  • Explore Bristol Research (publishedVersion, cc-by)
  • GRO (submittedVersion)
  • MPG.PuRe (Max Planck Society) (submittedVersion, other-oa)
  • Bristol Research (University of Bristol) (submittedVersion, cc-by)
  • Apollo (University of Cambridge) (submittedVersion, cc-by)
  • Apollo (cc-by)
Funders
  • Medical Research Council (MC_U105192711, MC_U105181010)
  • European Community’s Seventh Framework Programme (241548)
  • European Research Council (ERC (337415)
  • Wellcome Trust Investigator Award (200594/Z/16/Z)
Topics
  • Life Sciences › Biochemistry, Genetics and Molecular Biology › Molecular Biology › Protein Degradation and Inhibitors
  • Life Sciences › Biochemistry, Genetics and Molecular Biology › Molecular Biology › Ubiquitin and proteasome pathways
  • Life Sciences › Biochemistry, Genetics and Molecular Biology › Molecular Biology › CRISPR and Genetic Engineering
Keywords
mammalian cells, gene function analysis
MeSH terms
Animals, Antibodies, Biochemistry, Protein Transport, Proteolysis

About these checks

Registry, retraction, Cites and statistics results are computed, not judged, with one exception: a printed reference that no index lists is read once by a model before it counts as a citation error. Claims are extracted by a model and kept only when their quote appears verbatim in the text; each cited source is then checked, with a model’s help, for whether it says what the claim relies on. Those verdicts can be wrong — read the claim’s quote and the cited source before relying on one.

Statistics and arithmetic are recomputed, not judged.

Confidence bands are shown only for fields calibrated on our annotated test set. None is calibrated yet, so no band is shown.

What counts as a claim ›How we measure confidence ›How we check this ›

Are you an author, or do you see a problem with this page? Request a review