Cited by 322SARS-CoV-2 and COVID-19 ResearchImmune responses and vaccinationsVaccine Coverage and Hesitancy

The DOI matches its Crossref record; 46 of the 47 references it cites were found in a registry or an index.

Immunogenicity of standard and extended dosing intervals of BNT162b2 mRNA vaccine

Open access
Payne, Rebecca P., Longet, Stephanie, Austin, James A., Skelly, Donal T., Dejnirattisai, Wanwisa, Adele, Sandra, Meardon, Naomi, Faustini, Sian, Al-Taei, Saly, Moore, Shona C., Tipton, Tom, Hering, Luisa M., Angyal, Adrienn, Brown, Rebecca, Nicols, Alexander R., Gillson, Natalie, Dobson, Susan L., Amini, Ali, Supasa, Piyada, Cross, Andrew, Bridges-Webb, Alice, Reyes, Laura Silva, Linder, Aline, Sandhar, Gurjinder, Kilby, Jonathan A., Tyerman, Jessica K., Altmann, Thomas, Hornsby, Hailey, Whitham, Rachel, Phillips, Eloise, Malone, Tom, Hargreaves, Alexander, Shields, Adrian, Saei, Ayoub, Foulkes, Sarah, Stafford, Lizzie, Johnson, Sile, Wootton, Daniel G., Conlon, Christopher P., Jeffery, Katie, Matthews, Philippa C., Frater, John, Deeks, Alexandra S., Pollard, Andrew J., Brown, Anthony, Rowland-Jones, Sarah L., Mongkolsapaya, Juthathip, Barnes, Eleanor, Hopkins, Susan, Hall, Victoria, Dold, Christina, Duncan, Christopher J.A., Richter, Alex, Carroll, Miles, Screaton, Gavin, de Silva, Thushan I., Turtle, Lance, Klenerman, Paul, Dunachie, Susanna, Abuelgasim, Hibatullah, Adland, Emily, Adlou, Syed, Akther, Hossain Delowar, Alhussni, Ahmed, Ali, Mohammad, Ansari, M. Azim, Arancibia-Cárcamo, Carolina V., Bayley, Martin, Brown, Helen, Chalk, Jeremy, Chand, Meera, Chawla, Anu, Chinnakannan, Senthil, Cutteridge, Joseph, de Lara, Catherine, Denly, Lucy, Diffey, Ben, Dimitriadis, Stavros, Drake, Thomas M., Donnison, Timothy, Dupont, Maeva, Eyre, David, Fairman, Alex, Gardiner, Siobhan, Gilbert-Jarmillo, Javier, Goulder, Philip, Hackstein, Carl-Philipp, Hambleton, Sophie, Haniffa, Muzlifah, Haworth, Jenny, Holmes, Jennifer, Horner, Emily, Jämsén, Anni, Johnson, Sile, Jones, Chris, Kasanyinga, Mwila, Kelly, Sinead, Kirk, Rosemary, Knight, Michael L., Lawrie, Allan, Lee, Lian, Lett, Lauren, Lillie, Katy, Lim, Nicholas, Mehta, Hema, Mentzer, Alexander J., O’Donnell, Denise, Ogbe, Ane, Pace, Matthew, Payne, Brendan A.I., Platt, Gareth, Poolan, Sonia, Provine, Nicholas, Ramamurthy, Narayan, Robinson, Nichola, Romaniuk, Leigh, Rongkard, Patpong, Sampson, Oliver L., Simmons, Beatrice, Spegarova, Jarmila S., Stephenson, Emily, Subramaniam, Kris, Thaventhiran, James, Thomas, Sarah, Travis, Simon, Tucker, Stephanie, Turton, Helena, Watson, Adam, Watson, Lisa, Weeks, Esme, Wilson, Robert, Wood, Steven, Wright, Rachel, Xiao, Huiyuan, Zawia, Amira A.T.·2021·Cell

Abstract

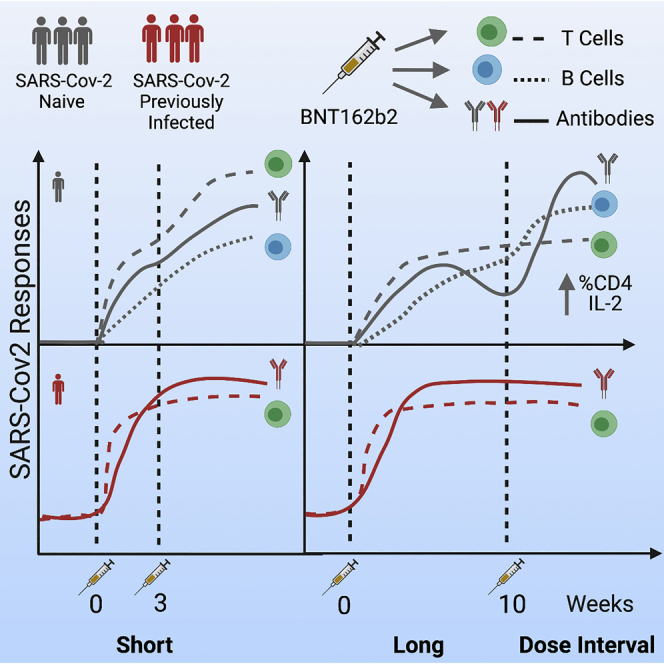
Extension of the interval between vaccine doses for the BNT162b2 mRNA vaccine was introduced in the United Kingdom to accelerate population coverage with a single dose. At this time, trial data were lacking, and we addressed this in a study of United Kingdom healthcare workers. The first vaccine dose induced protection from infection from the circulating alpha (B.1.1.7) variant over several weeks. In a substudy of 589 individuals, we show that this single dose induces severe acute respiratory syndrome coronavirus 2 (SARS-CoV-2) neutralizing antibody (NAb) responses and a sustained B and T cell response to the spike protein. NAb levels were higher after the extended dosing interval (6–14 weeks) compared with the conventional 3- to 4-week regimen, accompanied by enrichment of CD4 + T cells expressing interleukin-2 (IL-2). Prior SARS-CoV-2 infection amplified and accelerated the response. These data on dynamic cellular and humoral responses indicate that extension of the dosing interval is an effective immunogenic protocol.

Overview

The claims and statistics of this paper haven’t been checked yet.

Run the check — free, no account needed. It reads the open-access text and checks the sources it cites.

A few free checks a day · papers already verified open instantly · results are public

Integrity signals

Registry

Crossref · 10.1016/j.cell.2021.10.011

Cites

46 of 46 references verified0 citation errors · 0 not checkable

Statistics

Figures

Graphical abstract
Graphical abstract CC BY · PubMed Central
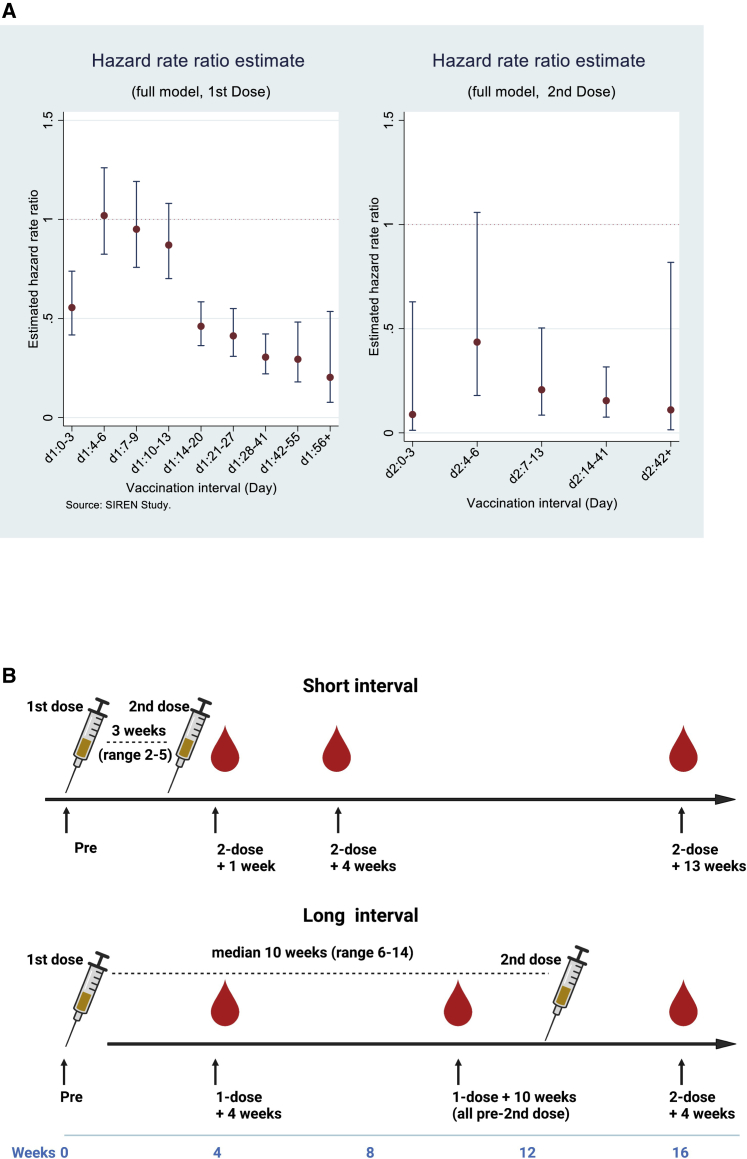
Figure 1 Vaccine efficacy and study design (A) Adjusted hazard ratios with 95% confidence intervals for PCR confirmed cases by interval after first and second doses of vaccination (source: SIREN study). HCWs underwent regular asymptomatic PCR screening (n = 25,066; negative cohort, 16,423; positive cohort, 8,643) with follow-up to 95 days after the first dose of the BNT162b2 vaccine. The hazard ratios are adjusted (including for age, ethnicity, comorbidities, and region), with full methodology described (Hall et al., 2021). (B) Schematic showing the dosing strategies of short and long vaccine intervals and phlebotomy time points.
Figure 1 Vaccine efficacy and study design (A) Adjusted hazard ratios with 95% confidence intervals for PCR confirmed cases by interval after first and second doses of vaccination (source: SIREN study). HCWs underwent regular asymptomatic PCR screening (n = 25,066; negative cohort, 16,423; positive cohort, 8,643) with follow-up to 95 days after the first dose of the BNT162b2 vaccine. The hazard ratios are adjusted (including for age, ethnicity, comorbidities, and region), with full methodology described (Hall et al., 2021). (B) Schematic showing the dosing strategies of short and long vaccine intervals and phlebotomy time points.CC BY · PubMed Central
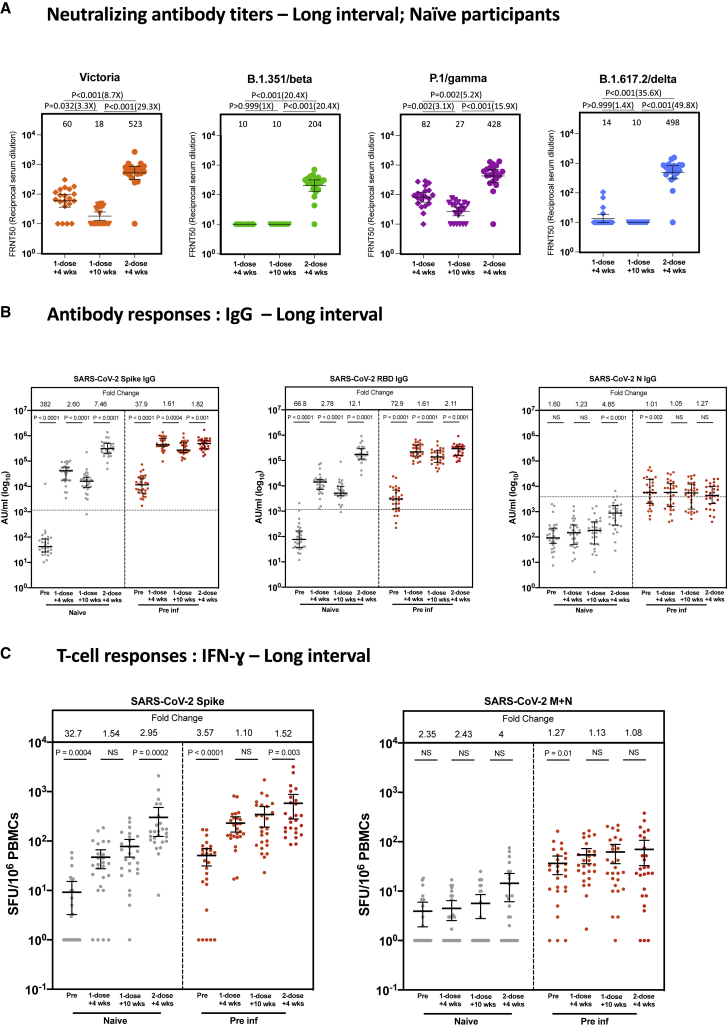
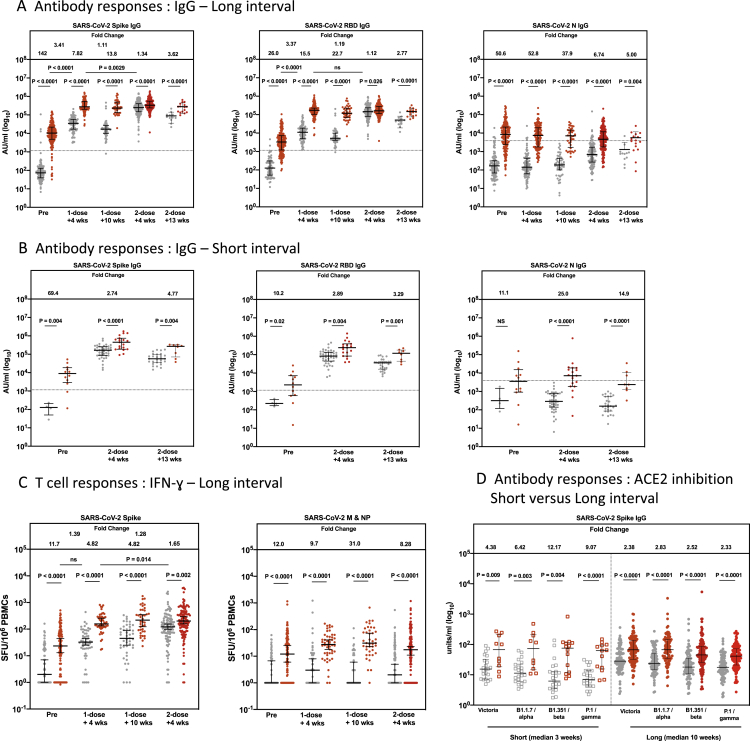
Figure 2 The long dosing interval with the BNT162b2 (Pfizer-BioNTech) vaccine elicits distinct NAb titer profiles against SARS-CoV-2 variants of concern and maintains T cell responses (A) NAbs against the Victoria isolate, B.1.351 (beta), P.1 (gamma), and B.1.617.2 (delta) taken from naive participants 4 (n = 20) and 10 weeks (n = 20) after the first vaccine dose and 4 weeks (n = 20) after the second vaccine dose in the long interval cohort. x axis, weeks since dose. Geometric mean neutralizing titers are shown immediately above each column and marked by a horizontal line on each column with 95% confience intervals. FRNT, focus reduction neutralization assay; FRNT50, the reciprocal dilution of the concentration of serum required to produce a 50% reduction in infectious focus-forming units of virus in Vero cells (ATCC, CCL-81). (B) SARS-CoV-2 spike (S)-, receptor binding domain (RBD)-, and nucleocapsid (N)-specific IgG time course using multiplexed MSD immunoassays in 29 naive and 29 pre-infected individuals vaccinated with a long interval between the doses. Data are shown in arbitrary units (AU)/mL. Horizontal dotted lines represent the cutoff of each assay based on pre-pandemic sera. (C) Comparison of IFNγ ELISpot responses to S (Victoria) from cryopreserved peripheral blood mononuclear cells (PBMCs) in 26 naive individuals and 26 previously infected individuals with a long interval between doses. Data are shown in spot-forming units per million PBMCs (SFU/106). Gray circles, naive individuals; red circles, previously infected individuals. Pre, before vaccine; 1-dose + 4 weeks, 4 weeks after the first dose; 1-dose + 10 weeks, 8–12 weeks after the first dose; 2-dose + 4 weeks, 4 weeks after the second dose. Bars for (B) and (C) represent the median with interquartile range. Time points for (A) were compared with Kruskal-Wallis nonparametric test and Dunn’s multiple comparisons tests, with p values shown above linking lines and fold changes in brackets. Paired comparisons were performed for (B) and (C) using the Wilcoxon matched pairs signed rank test, with fold change values referring to the p value comparisons directly below. Data in (B) from 51 of the pre-vaccine and 51 of the 1-dose + 4 weeks responses as well as data from (C) from 51 of the pre-vaccine and 51 of the 1-dose + 4 weeks responses have been published previously (Angyal et al., 2021).
Figure 2 The long dosing interval with the BNT162b2 (Pfizer-BioNTech) vaccine elicits distinct NAb titer profiles against SARS-CoV-2 variants of concern and maintains T cell responses (A) NAbs against the Victoria isolate, B.1.351 (beta), P.1 (gamma), and B.1.617.2 (delta) taken from naive participants 4 (n = 20) and 10 weeks (n = 20) after the first vaccine dose and 4 weeks (n = 20) after the second vaccine dose in the long interval cohort. x axis, weeks since dose. Geometric mean neutralizing titers are shown immediately above each column and marked by a horizontal line on each column with 95% confience intervals. FRNT, focus reduction neutralization assay; FRNT50, the reciprocal dilution of the concentration of serum required to produce a 50% reduction in infectious focus-forming units of virus in Vero cells (ATCC, CCL-81). (B) SARS-CoV-2 spike (S)-, receptor binding domain (RBD)-, and nucleocapsid (N)-specific IgG time course using multiplexed MSD immunoassays in 29 naive and 29 pre-infected individuals vaccinated with a long interval between the doses. Data are shown in arbitrary units (AU)/mL. Horizontal dotted lines represent the cutoff of each assay based on pre-pandemic sera. (C) Comparison of IFNγ ELISpot responses to S (Victoria) from cryopreserved peripheral blood mononuclear cells (PBMCs) in 26 naive individuals and 26 previously infected individuals with a long interval between doses. Data are shown in spot-forming units per million PBMCs (SFU/106). Gray circles, naive individuals; red circles, previously infected individuals. Pre, before vaccine; 1-dose + 4 weeks, 4 weeks after the first dose; 1-dose + 10 weeks, 8–12 weeks after the first dose; 2-dose + 4 weeks, 4 weeks after the second dose. Bars for (B) and (C) represent the median with interquartile range. Time points for (A) were compared with Kruskal-Wallis nonparametric test and Dunn’s multiple comparisons tests, with p values shown above linking lines and fold changes in brackets. Paired comparisons were performed for (B) and (C) using the Wilcoxon matched pairs signed rank test, with fold change values referring to the p value comparisons directly below. Data in (B) from 51 of the pre-vaccine and 51 of the 1-dose + 4 weeks responses as well as data from (C) from 51 of the pre-vaccine and 51 of the 1-dose + 4 weeks responses have been published previously (Angyal et al., 2021).CC BY · PubMed Central
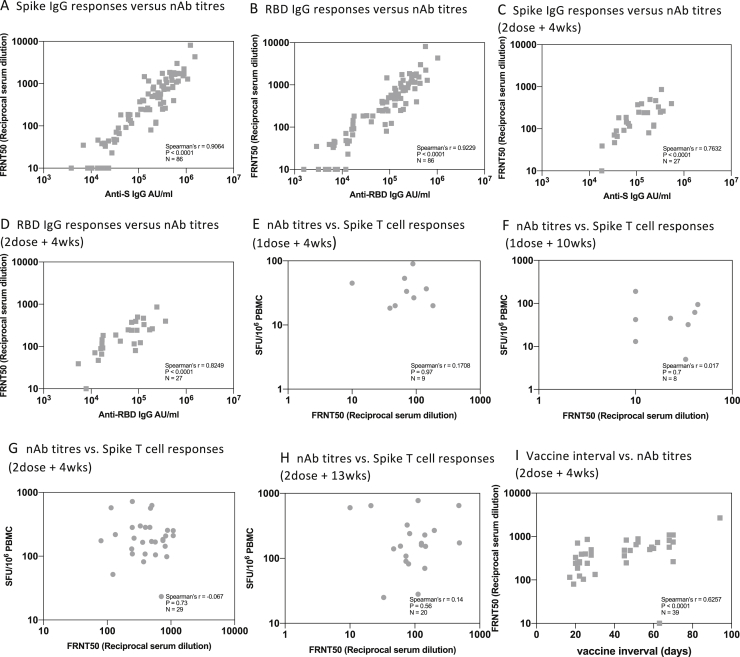
Figure S1 Correlation of NAb titers with T cell and IgG responses and vaccine interval, related to Figures 2 and 3A A. Relationship between IgG response to Spike (MSD) and neutralizing antibody (nAB) response to Victoria from all time points and vaccine dosing intervals . B. Relationship between IgG response to Receptor binding domain (MSD) and nAB response to Victoria from all time points and vaccine dosing intervals. C. Relationship between IgG response to spike (MSD) and nAB response to Victoria at dose-2 plus 4 weeks in short (3 weeks) and long (10 weeks) vaccine dosing intervals. D. Relationship between IgG response to Receptor binding domain (MSD) and nAB response to Victoria at dose-2 plus 4 weeks weeks in short (3 weeks) and long (10 weeks) vaccine dosing intervals. E. Relationship between Nab to Victoria and T cell responses to Spike at dose-1 plus 4 weeks. F. Relationship between Nab to Victoria and T cell responses to Spike at dose-1 plus 10 weeks. G. Relationship between Nab to Victoria and T cell responses to Spike at dose-2 plus 4 weeks weeks in short (3 weeks) and long (10 weeks) vaccine dosing intervals. H. Relationship between Nab to Victoria and T cell responses to Spike at dose-2 plus 13 weeks in short (3 weeks) and long (10 weeks) vaccine dosing intervals I. Correlation between vaccine dosing interval and neutralizing antibodies at 2nd dose plus 4 weeks. Spearman’s correlation was performed. Grey symbols indicate naive participants.
Figure S1 Correlation of NAb titers with T cell and IgG responses and vaccine interval, related to Figures 2 and 3A A. Relationship between IgG response to Spike (MSD) and neutralizing antibody (nAB) response to Victoria from all time points and vaccine dosing intervals . B. Relationship between IgG response to Receptor binding domain (MSD) and nAB response to Victoria from all time points and vaccine dosing intervals. C. Relationship between IgG response to spike (MSD) and nAB response to Victoria at dose-2 plus 4 weeks in short (3 weeks) and long (10 weeks) vaccine dosing intervals. D. Relationship between IgG response to Receptor binding domain (MSD) and nAB response to Victoria at dose-2 plus 4 weeks weeks in short (3 weeks) and long (10 weeks) vaccine dosing intervals. E. Relationship between Nab to Victoria and T cell responses to Spike at dose-1 plus 4 weeks. F. Relationship between Nab to Victoria and T cell responses to Spike at dose-1 plus 10 weeks. G. Relationship between Nab to Victoria and T cell responses to Spike at dose-2 plus 4 weeks weeks in short (3 weeks) and long (10 weeks) vaccine dosing intervals. H. Relationship between Nab to Victoria and T cell responses to Spike at dose-2 plus 13 weeks in short (3 weeks) and long (10 weeks) vaccine dosing intervals I. Correlation between vaccine dosing interval and neutralizing antibodies at 2nd dose plus 4 weeks. Spearman’s correlation was performed. Grey symbols indicate naive participants.CC BY · PubMed Central
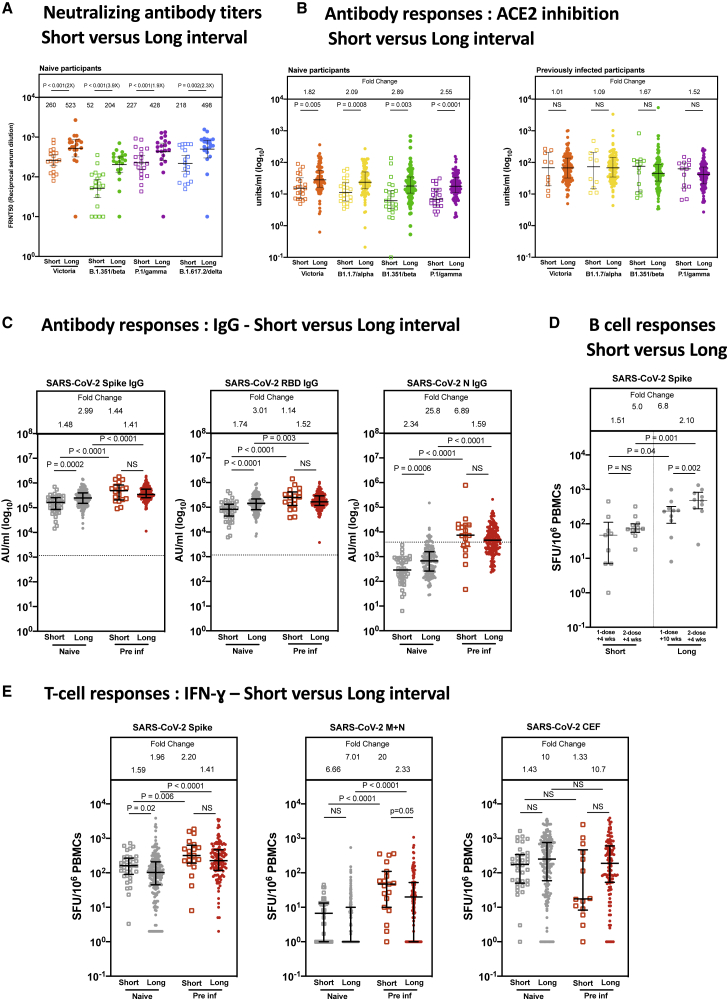
Figure 3 Comparison of IgG responses and T cell responses 4 weeks after the second dose of vaccine (A) Comparison of NAbs against the Victoria isolate, B.1.351 (beta), P.1 (gamma), and B.1.617.2 (delta) 4 weeks after the second dose with short (n = 19) and long (n = 20) interval in naive participants. There is a median of 3.3 weeks (range, 2.4–4.3) between doses in the short interval cohort and 8.4 weeks (range 6.4-10) in the long interval cohort. Geometric mean neutralizing titers with 95% confidence intervals are shown. FRNT, focus reduction neutralization assay; FRNT50, the reciprocal dilution of the concentration of serum required to produce a 50% reduction in infectious focus-forming units of virus in Vero cells (ATCC, CCL-81). (B) Effect of a short and a long vaccine dosing interval on the ability of sera to inhibit ACE2 binding to SARS-CoV-2 S (Victoria, B.1.1.7 [alpha], B.1.351 [beta], or P.1 [gamma]) 4 weeks after the second dose. ACE2 inhibition was analyzed using a multiplexed MSD assay. Data are shown in units/mL. Bars represent the median with 95% confidence intervals. Naive, short: n = 23; naive, long: n = 94; previously infected (pre inf), short: n = 14; pre inf, long: n = 119. (C) Effect of a short or a long vaccine dosing interval on SARS-CoV-2 S-, RBD-, and N-specific IgG responses in naive (gray circles) and pre individuals (red circles). IgG responses were measured in serum 4 weeks after the second dose using multiplexed MSD immunoassays and are shown in arbitrary units (AU)/mL. Naive, short: n = 41; naive, long: n = 151; pre inf, short: n = 19; pre inf, long: n = 169. Horizontal dotted lines represent the cutoff of each assay based on pre-pandemic sera. (D) IgG B ELISpot responses from cryopreserved peripheral blood mononuclear cells (PBMCs) 4 weeks after the first dose in naive short (n = 9), 2 weeks after the second dose in naive short (n = 12), 10 weeks after the first dose in naive long (n = 10), and 2 weeks after the second dose in naive long (n = 10). Values are expressed as spot-forming units per million PBMCs (SFU/106) representing anti-S IgG-secreting cells. (E) IFNγ ELISpot responses from cryopreserved PBMCs 4 weeks after the second dose in naive short (n = 37), naive long (n = 188), pre inf short (n = 20), and pre inf long (n = 124) individuals. Values are expressed as SFU/106. Displayed are responses to peptide pools representing S1 and S2 subunits of S (Victoria), peptide pools representing membrane (M) and N proteins (N) and cytomegalovirus, Epstein-Barr virus, influenza, and tetanus antigens (CEF). Bars represent the median with interquartile range for (B), (C), (D), and (E). Time points were compared with two-tailed Mann-Whitney tests, with p values shown above linking lines and fold changes in brackets for (A) and fold change values referring to the p value comparisons directly below for (B)–(E).
Figure 3 Comparison of IgG responses and T cell responses 4 weeks after the second dose of vaccine (A) Comparison of NAbs against the Victoria isolate, B.1.351 (beta), P.1 (gamma), and B.1.617.2 (delta) 4 weeks after the second dose with short (n = 19) and long (n = 20) interval in naive participants. There is a median of 3.3 weeks (range, 2.4–4.3) between doses in the short interval cohort and 8.4 weeks (range 6.4-10) in the long interval cohort. Geometric mean neutralizing titers with 95% confidence intervals are shown. FRNT, focus reduction neutralization assay; FRNT50, the reciprocal dilution of the concentration of serum required to produce a 50% reduction in infectious focus-forming units of virus in Vero cells (ATCC, CCL-81). (B) Effect of a short and a long vaccine dosing interval on the ability of sera to inhibit ACE2 binding to SARS-CoV-2 S (Victoria, B.1.1.7 [alpha], B.1.351 [beta], or P.1 [gamma]) 4 weeks after the second dose. ACE2 inhibition was analyzed using a multiplexed MSD assay. Data are shown in units/mL. Bars represent the median with 95% confidence intervals. Naive, short: n = 23; naive, long: n = 94; previously infected (pre inf), short: n = 14; pre inf, long: n = 119. (C) Effect of a short or a long vaccine dosing interval on SARS-CoV-2 S-, RBD-, and N-specific IgG responses in naive (gray circles) and pre individuals (red circles). IgG responses were measured in serum 4 weeks after the second dose using multiplexed MSD immunoassays and are shown in arbitrary units (AU)/mL. Naive, short: n = 41; naive, long: n = 151; pre inf, short: n = 19; pre inf, long: n = 169. Horizontal dotted lines represent the cutoff of each assay based on pre-pandemic sera. (D) IgG B ELISpot responses from cryopreserved peripheral blood mononuclear cells (PBMCs) 4 weeks after the first dose in naive short (n = 9), 2 weeks after the second dose in naive short (n = 12), 10 weeks after the first dose in naive long (n = 10), and 2 weeks after the second dose in naive long (n = 10). Values are expressed as spot-forming units per million PBMCs (SFU/106) representing anti-S IgG-secreting cells. (E) IFNγ ELISpot responses from cryopreserved PBMCs 4 weeks after the second dose in naive short (n = 37), naive long (n = 188), pre inf short (n = 20), and pre inf long (n = 124) individuals. Values are expressed as SFU/106. Displayed are responses to peptide pools representing S1 and S2 subunits of S (Victoria), peptide pools representing membrane (M) and N proteins (N) and cytomegalovirus, Epstein-Barr virus, influenza, and tetanus antigens (CEF). Bars represent the median with interquartile range for (B), (C), (D), and (E). Time points were compared with two-tailed Mann-Whitney tests, with p values shown above linking lines and fold changes in brackets for (A) and fold change values referring to the p value comparisons directly below for (B)–(E).CC BY · PubMed Central
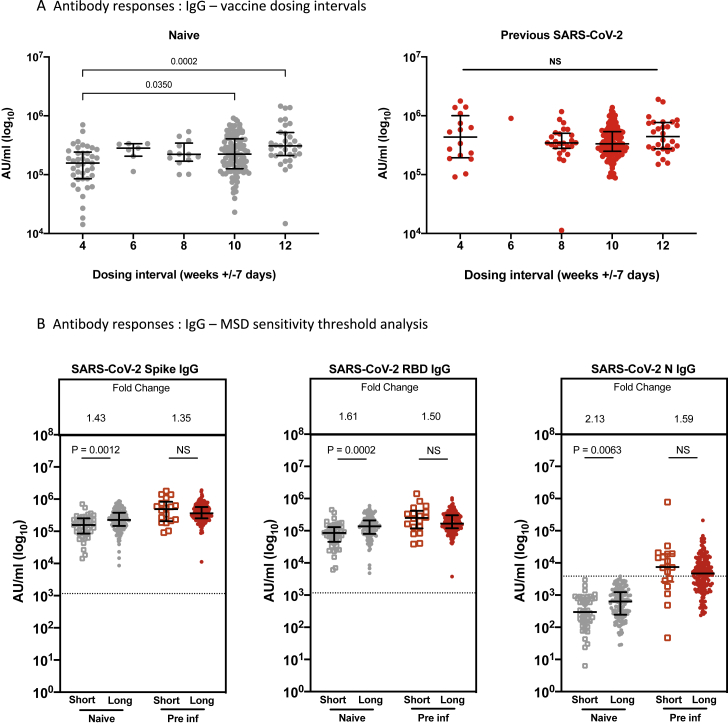
Figure S2 Effect of vaccine dosing interval and MSD sensitivity threshold on IgG responses, related to Figures 2B and 3C A. Effect of a dosing interval grouped 4 weekly on SARS-CoV-2 S-specific IgG responses in naive (gray symbols) and pre-infected individuals (red symbols). IgG responses were measured in serum 4weeks after the second dose using multiplexed MSD immunoassays and are shown in Arbitrary Units/ml (AU/ml). Bars represent the median with interquartile range. Unpaired comparisons between the groups were performed using a Mann-Whitney test. B. Effect of a short or a long vaccine dosing interval on SARS-CoV-2 S-, RBD- and N-specific IgG responses in naive (gray symbols) and pre-infected individuals (red symbols) after removing participants with IgG N responses above the sensitivity threshold (3,874 AU/ml). IgG responses were measured in serum 4 weeks following the second dose using multiplexed MSD immunoassays and are shown in Arbitrary Units/ml (AU/ml). Bars represent the median with interquartile range. Unpaired comparisons between the groups were performed using a Mann-Whitney test. Horizontal dotted lines represent the sensitivity threshold of each assay based on pre-pandemic sera.
Figure S2 Effect of vaccine dosing interval and MSD sensitivity threshold on IgG responses, related to Figures 2B and 3C A. Effect of a dosing interval grouped 4 weekly on SARS-CoV-2 S-specific IgG responses in naive (gray symbols) and pre-infected individuals (red symbols). IgG responses were measured in serum 4weeks after the second dose using multiplexed MSD immunoassays and are shown in Arbitrary Units/ml (AU/ml). Bars represent the median with interquartile range. Unpaired comparisons between the groups were performed using a Mann-Whitney test. B. Effect of a short or a long vaccine dosing interval on SARS-CoV-2 S-, RBD- and N-specific IgG responses in naive (gray symbols) and pre-infected individuals (red symbols) after removing participants with IgG N responses above the sensitivity threshold (3,874 AU/ml). IgG responses were measured in serum 4 weeks following the second dose using multiplexed MSD immunoassays and are shown in Arbitrary Units/ml (AU/ml). Bars represent the median with interquartile range. Unpaired comparisons between the groups were performed using a Mann-Whitney test. Horizontal dotted lines represent the sensitivity threshold of each assay based on pre-pandemic sera.CC BY · PubMed Central
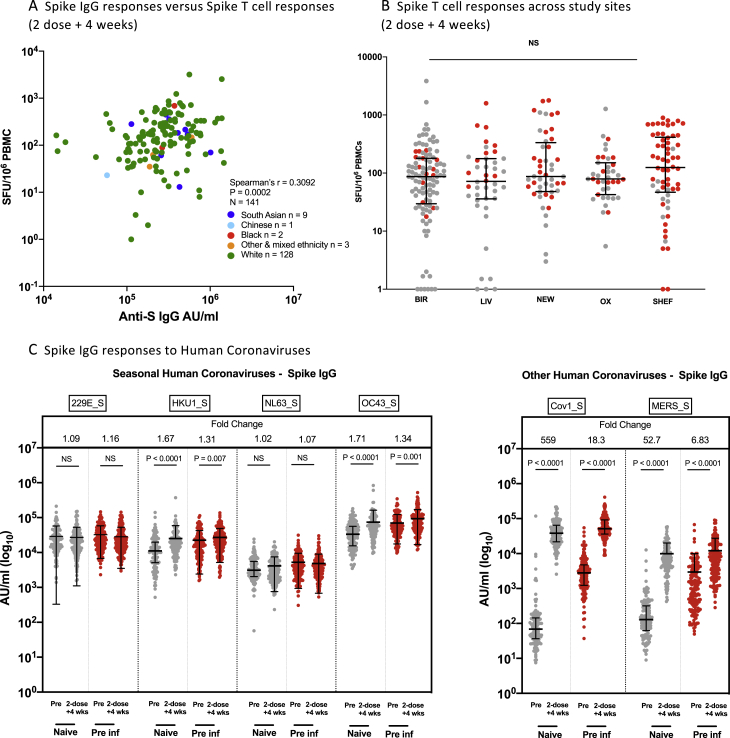
Figure S3 Effect of ethnicity and study site on IgG and T cells responses and comparison of IgG responses with alphacoronavirses and betacoronaviruses 4 weeks after the second dose of vaccine, related to Table 2 and Figure 3 A. Correlation of IFN-y ELISpot responses to Spike B and anti-spike IgG response, in participants 4 weeks after the second dose in naive, and previously infected individuals who received either the long or short interval dose. Data points are colored by ethnic group. Spearman’s correlation was performed. B. Comparison of of IFN-y ELISpot responses to Spike B, from cryo-preserved PBMCs 4 weeks after second dose in naive, and previously infected individuals who received the long interval dose, across the 5 centers (BIR: Birmingham, LIV: Liverpool, NEW: Newcastle, OX: Oxford, SHEF: Sheffield). Data are shown as spot-forming units per million peripheral blood mononuclear cells (SFU/106 PBMCs). Unpaired comparisons across two groups were performed using the Mann Whitney test. Grey symbols represent naive individuals, Red symbols represent previously infected individuals. C. Alpha coronavirus and beta coronavirus spike-specific IgG responses in naive (gray circles, n = 151) and pre-infected individuals (red circles, n = 169) vaccinated with a long interval between the doses. IgG responses were measured in unpaired sera before vaccination (pre) and4 weeks after the second dose (1-dose +4 wks) using multiplexed MSD immunoassays. Data are shown in Arbitrary Units/ml (AU/ml). Bars represent the median with interquartile range. Unpaired comparisons between the groups were performed using a Mann-Whitney test. Fold change values each refer to the P value comparisons directly below.
Figure S3 Effect of ethnicity and study site on IgG and T cells responses and comparison of IgG responses with alphacoronavirses and betacoronaviruses 4 weeks after the second dose of vaccine, related to Table 2 and Figure 3 A. Correlation of IFN-y ELISpot responses to Spike B and anti-spike IgG response, in participants 4 weeks after the second dose in naive, and previously infected individuals who received either the long or short interval dose. Data points are colored by ethnic group. Spearman’s correlation was performed. B. Comparison of of IFN-y ELISpot responses to Spike B, from cryo-preserved PBMCs 4 weeks after second dose in naive, and previously infected individuals who received the long interval dose, across the 5 centers (BIR: Birmingham, LIV: Liverpool, NEW: Newcastle, OX: Oxford, SHEF: Sheffield). Data are shown as spot-forming units per million peripheral blood mononuclear cells (SFU/106 PBMCs). Unpaired comparisons across two groups were performed using the Mann Whitney test. Grey symbols represent naive individuals, Red symbols represent previously infected individuals. C. Alpha coronavirus and beta coronavirus spike-specific IgG responses in naive (gray circles, n = 151) and pre-infected individuals (red circles, n = 169) vaccinated with a long interval between the doses. IgG responses were measured in unpaired sera before vaccination (pre) and4 weeks after the second dose (1-dose +4 wks) using multiplexed MSD immunoassays. Data are shown in Arbitrary Units/ml (AU/ml). Bars represent the median with interquartile range. Unpaired comparisons between the groups were performed using a Mann-Whitney test. Fold change values each refer to the P value comparisons directly below.CC BY · PubMed Central
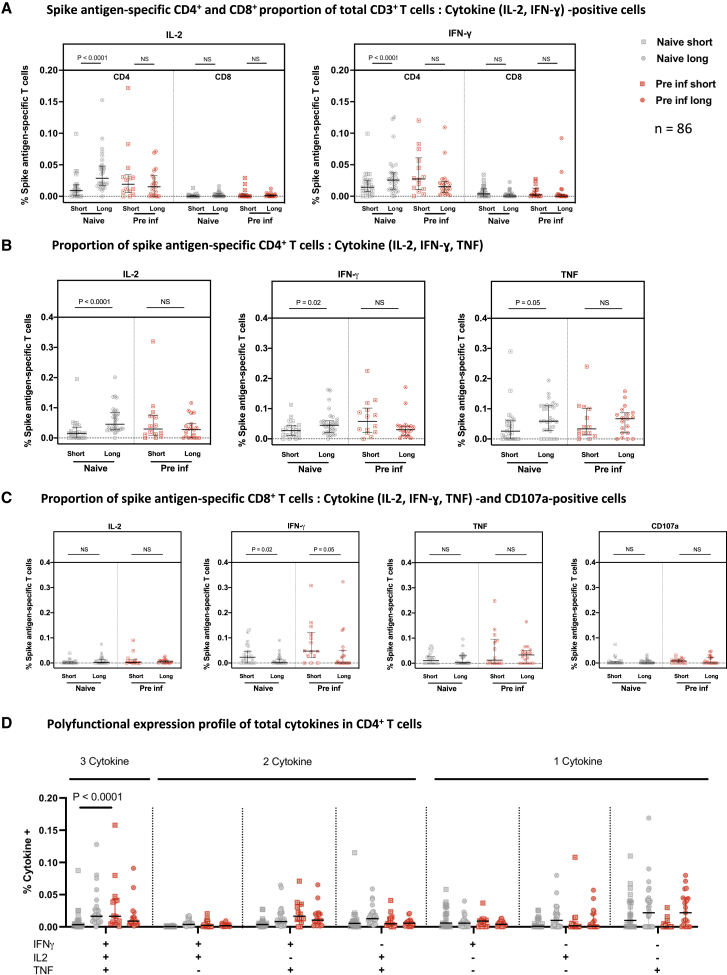
Figure 4 Analysis of S-specific T cell responses by flow cytometry Cryopreserved PBMCs from 86 participants who received the short or long vaccine dosing interval, with S antigen-specific ELISpot responses over 40 SFU/million PBMCs 4 weeks after the second dose, were analyzed by ICS and flow cytometry. (A) The T cell populations responsible for IFNγ or IL-2 expression were assessed by reporting the ratio of IFNγ- or IL-2-expressing cells among CD4+ or CD8+ cells, expressed as a proportion of their CD3+ live population. (B and C) The individual cytokine expression levels of total IFNγ, IL-2, or TNF are reported as a proportion of the (B) CD4+ T cell population or (C) CD8+ T cells with addition of CD107a (a marker of cytotoxicity). (D) Polyfunctionality was evaluated by expression of one or more cytokines in CD4+ cells, showing the number of cytokines released in each group and against each IFNγ, IL-2, and/or TNF gated combination shown as a proportion of total CD4+ T cells. Naive short, n = 23; naive long, n = 30; pre inf short, n = 14; pre inf long, n = 19. Bars represent the median with interquartile range. Unpaired comparisons across two groups were performed using Mann-Whitney test, and paired comparisons were performed using Wilcoxon matched pairs signed rank test. Grey circles, naive individuals; red circles, pre inf individuals.
Figure 4 Analysis of S-specific T cell responses by flow cytometry Cryopreserved PBMCs from 86 participants who received the short or long vaccine dosing interval, with S antigen-specific ELISpot responses over 40 SFU/million PBMCs 4 weeks after the second dose, were analyzed by ICS and flow cytometry. (A) The T cell populations responsible for IFNγ or IL-2 expression were assessed by reporting the ratio of IFNγ- or IL-2-expressing cells among CD4+ or CD8+ cells, expressed as a proportion of their CD3+ live population. (B and C) The individual cytokine expression levels of total IFNγ, IL-2, or TNF are reported as a proportion of the (B) CD4+ T cell population or (C) CD8+ T cells with addition of CD107a (a marker of cytotoxicity). (D) Polyfunctionality was evaluated by expression of one or more cytokines in CD4+ cells, showing the number of cytokines released in each group and against each IFNγ, IL-2, and/or TNF gated combination shown as a proportion of total CD4+ T cells. Naive short, n = 23; naive long, n = 30; pre inf short, n = 14; pre inf long, n = 19. Bars represent the median with interquartile range. Unpaired comparisons across two groups were performed using Mann-Whitney test, and paired comparisons were performed using Wilcoxon matched pairs signed rank test. Grey circles, naive individuals; red circles, pre inf individuals.CC BY · PubMed Central
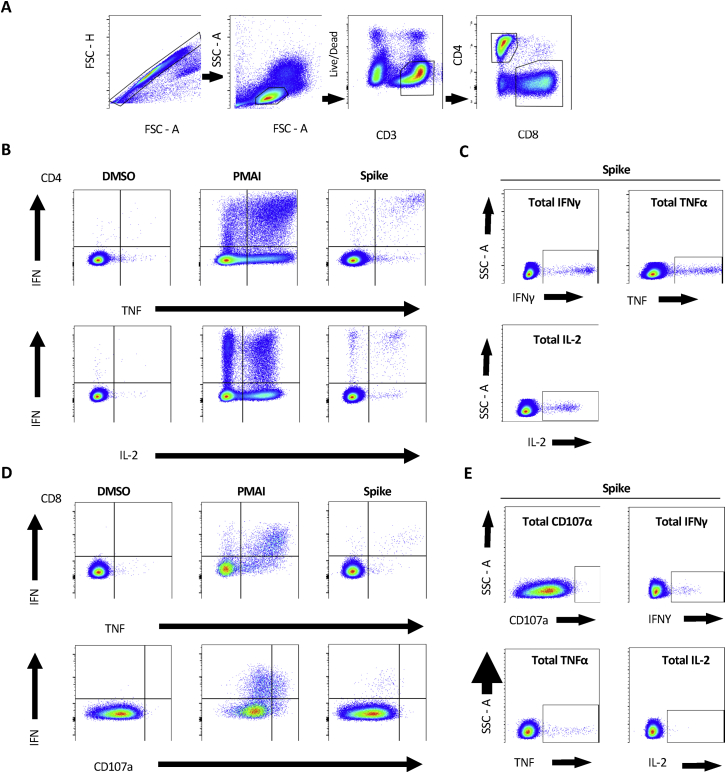
Figure S4 Representative gating strategy for ICS analysis, related to Figure 4 (A) Description of gates left-to-right showing sequential gates used in the initial analysis of each subject. Cell doublets were removed using forward scatter (FSC) parameters. Lymphocytes were selected by FSC and side scatter (SSC), CD3 positive but non-Live-dead stained living populations were carried forward to isolate CD4+ and CD8+ T Cells. (B) The gates used to define differences between different cytokine expression and (C) total individual cytokine expression in CD4+ and (D,E) CD8+ respectively. DMSO and PMAI represent negative and positive control conditions to demonstrate the contrast in cytokine expression. These were also used in setting the gate boundaries in each subject for the analysis of SARSCoV2 Spike protein responses.
Figure S4 Representative gating strategy for ICS analysis, related to Figure 4 (A) Description of gates left-to-right showing sequential gates used in the initial analysis of each subject. Cell doublets were removed using forward scatter (FSC) parameters. Lymphocytes were selected by FSC and side scatter (SSC), CD3 positive but non-Live-dead stained living populations were carried forward to isolate CD4+ and CD8+ T Cells. (B) The gates used to define differences between different cytokine expression and (C) total individual cytokine expression in CD4+ and (D,E) CD8+ respectively. DMSO and PMAI represent negative and positive control conditions to demonstrate the contrast in cytokine expression. These were also used in setting the gate boundaries in each subject for the analysis of SARSCoV2 Spike protein responses.CC BY · PubMed Central
Figure S5 Effect of previous SARS-CoV-2 infection on magnitude of IgG and T cell responses, related to Figure 2 A-B. SARS-CoV-2 spike(S)-, receptor-binding domain (RBD)- and nucleocapsid(N)-specific IgG time course in naive (gray circles, n = 234) and pre-infected individuals vaccinated (red circles, n = 228) with a long (A) or short (B) interval between the doses. IgG responses were measured in unpaired sera before vaccination (pre), 4 weeks after the first dose (1-dose +4 wks), 8-12 weeks after 1st dose (1-dose + 10 wks), 4 weeks after the second dose (2-dose + 4wks), and 13 weeks after the second dose (2-dose +13 wks) using multiplexed MSD immunoassays. Data are shown in Arbitrary Units/ml (AU/ml). C. Comparison of IFN-y ELISpot responses to Spike (Victoria) from cryo-preserved peripheral blood mononuclear cells (PBMCs) in 276 naive individuals and 165 previously-infected individuals unmatched for pre-vaccine (pre), 4 weeks after 1st dose (1-dose +4 wks), 8-12 weeks after 1st dose (1-dose +10 wks) and 4 weeks after 2nd dose (2-dose +4 wks). Data are shown as spot-forming units per million PBMCs (SFU/106 PBMCs). D. Impact of a short and a long vaccine dosing interval on the ability of sera to inhibit ACE2 binding to SARS-CoV-2 spike (Victoria, B.1.1.7 (alpha), B.1.351 (beta) or P.1 (gamma)) 28 days after the second dose. ACE2 inhibition was analyzed using a multiplexed MSD assay. Data are shown in units/ml. Naive, short: n = 23; Naive, long: n = 94; Pre inf, short: n = 14; Pre inf, long: n = 119. Bars represent the median with interquartile range. Unaired comparisons between the groups were performed using a Mann-Whitney test. Fold change values each refer to the P value comparisons directly below. Horizontal dotted lines represent the cut-offs of each assay based on pre-pandemic sera. Data from 51 of the pre-vaccine, and 51 of the 1-dose +4 wks responses were previously published (Angyal et al., 2021).
Figure S5 Effect of previous SARS-CoV-2 infection on magnitude of IgG and T cell responses, related to Figure 2 A-B. SARS-CoV-2 spike(S)-, receptor-binding domain (RBD)- and nucleocapsid(N)-specific IgG time course in naive (gray circles, n = 234) and pre-infected individuals vaccinated (red circles, n = 228) with a long (A) or short (B) interval between the doses. IgG responses were measured in unpaired sera before vaccination (pre), 4 weeks after the first dose (1-dose +4 wks), 8-12 weeks after 1st dose (1-dose + 10 wks), 4 weeks after the second dose (2-dose + 4wks), and 13 weeks after the second dose (2-dose +13 wks) using multiplexed MSD immunoassays. Data are shown in Arbitrary Units/ml (AU/ml). C. Comparison of IFN-y ELISpot responses to Spike (Victoria) from cryo-preserved peripheral blood mononuclear cells (PBMCs) in 276 naive individuals and 165 previously-infected individuals unmatched for pre-vaccine (pre), 4 weeks after 1st dose (1-dose +4 wks), 8-12 weeks after 1st dose (1-dose +10 wks) and 4 weeks after 2nd dose (2-dose +4 wks). Data are shown as spot-forming units per million PBMCs (SFU/106 PBMCs). D. Impact of a short and a long vaccine dosing interval on the ability of sera to inhibit ACE2 binding to SARS-CoV-2 spike (Victoria, B.1.1.7 (alpha), B.1.351 (beta) or P.1 (gamma)) 28 days after the second dose. ACE2 inhibition was analyzed using a multiplexed MSD assay. Data are shown in units/ml. Naive, short: n = 23; Naive, long: n = 94; Pre inf, short: n = 14; Pre inf, long: n = 119. Bars represent the median with interquartile range. Unaired comparisons between the groups were performed using a Mann-Whitney test. Fold change values each refer to the P value comparisons directly below. Horizontal dotted lines represent the cut-offs of each assay based on pre-pandemic sera. Data from 51 of the pre-vaccine, and 51 of the 1-dose +4 wks responses were previously published (Angyal et al., 2021).CC BY · PubMed Central
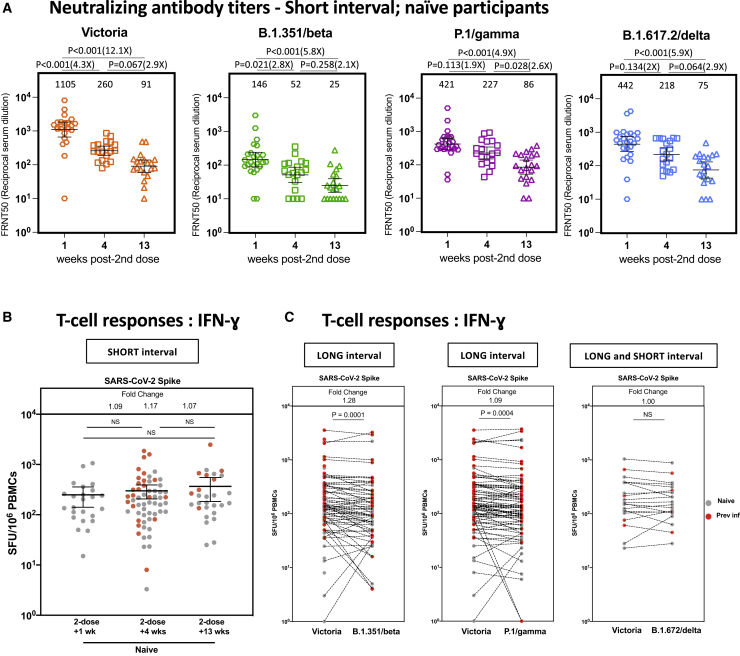
Figure 5 Short dosing interval with the BNT162b2 (Pfizer-BioNTech) vaccine elicits distinct NAb titer profiles against SARS-CoV-2 variants of concern that decline over time, whereas T cell responses are maintained (A) NAb titers, measured by FRNT, against the early pandemic Victoria isolate, B.1.351 (beta), P.1 (gamma), and B.1.617.2 (delta) from naive participants in weeks 1 (n = 25), 4 (n = 19), and 13 (n = 20) after the second vaccine in the short interval dose cohort (median dose interval, 3.3 weeks; range, 2.4–4.3). The x axis indicates weeks since dose. Geometric mean neutralizing titers with 95% confidence intervals are shown. Neutralization titers from dose 2 + 1 week (Victoria, B.1.351, P.1, and B.1.617.2) and dose 1 + 4 weeks and 10 weeks (Victoria and B.1.617.2) have been reported previously (Dejnirattisai et al., 2021; Liu et al., 2021; Supasa et al., 2021; Zhou et al., 2021). (B) Comparison of IFNγ ELISpot responses to S Victoria from cryopreserved PBMCs in 43 naive individuals and 26 pre inf individuals who received the short interval dose 1, 4, and 13 weeks after the second dose. (C) Comparison of IFNγ ELISpot responses from cryopreserved peripheral blood mononucelar cells (PBMCs) in 40 naive individuals and 42 pre inf individuals matched for responses to S Victoria, spike B.1.35/beta, and S P.1/gamma. Individuals received the long interval dosing regimen, and samples were taken 4 weeks after the second dose. Data are shown as spot forming units (SFU) per million PBMCs. Time points for (A) were compared with Kruskal-Wallis non-parametric test and Dunn’s multiple comparisons tests. The p values are illustrated above linking lines and fold changes in brackets. Bars represent the median with interquartile range for (B) and (C). Time points were compared with two-tailed Mann-Whitney tests for (A) and (B), and paired comparisons were performed using Wilcoxon matched pairs signed rank test for (C), with fold change values referring to the p value comparisons directly below. Gray circles, naive individuals; red circles, pre inf individuals.
Figure 5 Short dosing interval with the BNT162b2 (Pfizer-BioNTech) vaccine elicits distinct NAb titer profiles against SARS-CoV-2 variants of concern that decline over time, whereas T cell responses are maintained (A) NAb titers, measured by FRNT, against the early pandemic Victoria isolate, B.1.351 (beta), P.1 (gamma), and B.1.617.2 (delta) from naive participants in weeks 1 (n = 25), 4 (n = 19), and 13 (n = 20) after the second vaccine in the short interval dose cohort (median dose interval, 3.3 weeks; range, 2.4–4.3). The x axis indicates weeks since dose. Geometric mean neutralizing titers with 95% confidence intervals are shown. Neutralization titers from dose 2 + 1 week (Victoria, B.1.351, P.1, and B.1.617.2) and dose 1 + 4 weeks and 10 weeks (Victoria and B.1.617.2) have been reported previously (Dejnirattisai et al., 2021; Liu et al., 2021; Supasa et al., 2021; Zhou et al., 2021). (B) Comparison of IFNγ ELISpot responses to S Victoria from cryopreserved PBMCs in 43 naive individuals and 26 pre inf individuals who received the short interval dose 1, 4, and 13 weeks after the second dose. (C) Comparison of IFNγ ELISpot responses from cryopreserved peripheral blood mononucelar cells (PBMCs) in 40 naive individuals and 42 pre inf individuals matched for responses to S Victoria, spike B.1.35/beta, and S P.1/gamma. Individuals received the long interval dosing regimen, and samples were taken 4 weeks after the second dose. Data are shown as spot forming units (SFU) per million PBMCs. Time points for (A) were compared with Kruskal-Wallis non-parametric test and Dunn’s multiple comparisons tests. The p values are illustrated above linking lines and fold changes in brackets. Bars represent the median with interquartile range for (B) and (C). Time points were compared with two-tailed Mann-Whitney tests for (A) and (B), and paired comparisons were performed using Wilcoxon matched pairs signed rank test for (C), with fold change values referring to the p value comparisons directly below. Gray circles, naive individuals; red circles, pre inf individuals.CC BY · PubMed Central

Verification

Claims the paper makes

The claims and statistics of this paper haven’t been checked yet.

Run the check — free, no account needed. It reads the open-access text and checks the sources it cites.

A few free checks a day · papers already verified open instantly · results are public

Claims other papers make about this one

Each is checked against this paper’s own text: does it say what the citing paper says it does?

Self-check

Percentages, sums and reported differences re-computed from the paper’s own numbers.

The self-check needs the paper’s full text.

Citations

Cites

Show all 47 references

Cited by

Sorted by citations

See all 322

Metadata

Authors
Payne, R. P., Longet, S., Austin, J. A., Skelly, D. T., Dejnirattisai, W., Adele, S., Meardon, N., Faustini, S., Al-Taei, S., Moore, S. C., Tipton, T., Hering, L. M., Angyal, A., Brown, R., Nicols, A. R., Gillson, N., Dobson, S. L., Amini, A., Supasa, P., Cross, A., Bridges-Webb, A., Reyes, L. S., Linder, A., Sandhar, G., Kilby, J. A., Tyerman, J. K., Altmann, T., Hornsby, H., Whitham, R., Phillips, E., Malone, T., Hargreaves, A., Shields, A., Saei, A., Foulkes, S., Stafford, L., Johnson, S., Wootton, D. G., Conlon, C. P., Jeffery, K., Matthews, P. C., Frater, J., Deeks, A. S., Pollard, A. J., Brown, A., Rowland-Jones, S. L., Mongkolsapaya, J., Barnes, E., Hopkins, S., Hall, V., Dold, C., Duncan, C. J. A., Richter, A., Carroll, M., Screaton, G., de Silva, T. I., Turtle, L., Klenerman, P., Dunachie, S., Abuelgasim, H., Adland, E., Adlou, S., Akther, H. D., Alhussni, A., Ali, M., Ansari, M. A., Arancibia-Cárcamo, C. V., Bayley, M., Brown, H., Chalk, J., Chand, M., Chawla, A., Chinnakannan, S., Cutteridge, J., de Lara, C., Denly, L., Diffey, B., Dimitriadis, S., Drake, T. M., Donnison, T., Dupont, M., Eyre, D., Fairman, A., Gardiner, S., Gilbert-Jarmillo, J., Goulder, P., Hackstein, C.-P., Hambleton, S., Haniffa, M., Haworth, J., Holmes, J., Horner, E., Jämsén, A., Johnson, S., Jones, C., Kasanyinga, M., Kelly, S., Kirk, R., Knight, M. L., Lawrie, A., Lee, L., Lett, L., Lillie, K., Lim, N., Mehta, H., Mentzer, A. J., O’Donnell, D., Ogbe, A., Pace, M., Payne, B. A. I., Platt, G., Poolan, S., Provine, N., Ramamurthy, N., Robinson, N., Romaniuk, L., Rongkard, P., Sampson, O. L., Simmons, B., Spegarova, J. S., Stephenson, E., Subramaniam, K., Thaventhiran, J., Thomas, S., Travis, S., Tucker, S., Turton, H., Watson, A., Watson, L., Weeks, E., Wilson, R., Wood, S., Wright, R., Xiao, H., & Zawia, A. A. T.
Affiliations
  • Newcastle University (GB)
  • University of Liverpool (GB)
  • University of Oxford (GB)
  • Centre for Human Genetics (GB)
  • Sheffield Teaching Hospitals NHS Foundation Trust (GB)
  • University of Birmingham (GB)
  • University of Sheffield (GB)
  • Public Health England (GB)
  • Liverpool University Hospitals NHS Foundation Trust (GB)
  • Great North Children's Hospital (GB)
  • University Hospitals Birmingham NHS Foundation Trust (GB)
  • Oxford University Hospitals NHS Trust (GB)
  • Siriraj Hospital (TH)
  • Newcastle upon Tyne Hospitals NHS Foundation Trust (GB)
Corresponding author
  • Payne, Rebecca P.
  • Klenerman, Paul
Venue
Cell
Publisher
Elsevier BV
Published
2021-11
Volume
184
Issue
23
Pages
5699-5714.e11
ISSN
0092-8674 (ISSN-L)
OpenAlex
W3206717788
Cited by
322
References
47
Citations by year
2026: 14 · 2025: 33 · 2024: 34 · 2023: 87 · 2022: 135 · 2021: 18
FWCI
21.70
Type
journal article
Language
en
Open access
Locations
  • Cell (publishedVersion, cc-by)
  • PubMed Central (publishedVersion, cc-by)
  • PubMed (publishedVersion)
  • White Rose Research Online (University of Leeds, The University of Sheffield, University of York) (acceptedVersion)
  • University of Birmingham Research Portal (University of Birmingham) (submittedVersion, cc-by)
  • Greater South Information System
Funders
  • University of Liverpool
  • Oxford University
  • UK Research and Innovation
  • Wellcome Trust (NIHR300791, 216417/Z/19/Z, 204721/Z/16/Z, 110058/Z/15/Z)
  • U.S. Food and Drug Administration
  • National Institute for Health Research
  • Utah Department of Health
  • Sheffield Teaching Hospitals NHS Foundation Trust
  • Department of Health and Social Care
  • University of Birmingham
  • British Heart Foundation (FS/18/52/33808, PG/11/116/29288)
  • Public Health England
Topics
  • Health Sciences › Medicine › Infectious Diseases › SARS-CoV-2 and COVID-19 Research
  • Life Sciences › Immunology and Microbiology › Immunology › Immune responses and vaccinations
  • Social Sciences › Health › Vaccine Coverage and Hesitancy
Keywords
BNT162b2 mRNA vaccine, extended dosing interval, single-dose vaccination, immunogenicity, neutralizing antibodies, spike protein, CD4+ T cells, interleukin-2, SARS-CoV-2, prior SARS-CoV-2 infection, healthcare workers
MeSH terms
COVID-19, SARS-CoV-2, COVID-19 Vaccines, mRNA Vaccines, BNT162 Vaccine, Adult, Aged, Antibodies, Viral, Dose-Response Relationship, Immunologic, Ethnicity, Female, Humans, Immunoglobulin G, Immunity, Male, Middle Aged, Reference Standards, T-Lymphocytes, Vaccines, Synthetic, Linear Models, Treatment Outcome, Cross-Priming, Young Adult, Antibodies, Neutralizing

About these checks

Registry, retraction, Cites and statistics results are computed, not judged, with one exception: a printed reference that no index lists is read once by a model before it counts as a citation error. Claims are extracted by a model and kept only when their quote appears verbatim in the text; each cited source is then checked, with a model’s help, for whether it says what the claim relies on. Those verdicts can be wrong — read the claim’s quote and the cited source before relying on one.

Statistics and arithmetic are recomputed, not judged.

Confidence bands are shown only for fields calibrated on our annotated test set. None is calibrated yet, so no band is shown.

What counts as a claim ›How we measure confidence ›How we check this ›

Are you an author, or do you see a problem with this page? Request a review