

The DOI matches its Crossref record; 12 of the 12 references it cites were found in a registry or an index.
Proliferation Drives Aging-Related Functional Decline in a Subpopulation of the Hematopoietic Stem Cell Compartment
Overview
The claims and statistics of this paper haven’t been checked yet.
Run the check — free, no account needed. It reads the open-access text and checks the sources it cites.
Integrity signals
Registry
Cites
Statistics
Figures
Verification
Claims the paper makes
The claims and statistics of this paper haven’t been checked yet.
Run the check — free, no account needed. It reads the open-access text and checks the sources it cites.
Claims other papers make about this one
Each is checked against this paper’s own text: does it say what the citing paper says it does?
In the citing paper
“Further, we identified a strong enrichment of the transcriptional signature specific to old HSCs25 and AP-1 members (Jun, Jund, Fos, Fosb) which are downstream of IL1β and other pro-inflammatory signaling at steady state48 and were exaggerated by IL1β stimulation in Tet2-KO HSCs relative to WT, suggesting Tet2-KO cells are primed to respond to pro-inflammatory stimulation.”
From Clonal hematopoiesis related TET2 loss-of-function impedes IL1β-mediated epigenetic reprogramming in hematopoietic stem and progenitor cells (2023) · cites this paper as [25]
Self-check
Percentages, sums and reported differences re-computed from the paper’s own numbers.
The self-check needs the paper’s full text.
Citations
Cites
Subramanian, A., Tamayo, P., Mootha, V. K., Mukherjee, S., Ebert, B. L., Gillette, M. A., Paulovich, A., Pomeroy, S. L., Golub, T. R., Lander, E. S., et al. (2005) · Proceedings of the National Academy of Sciences · doi:10.1073/pnas.0506580102 · Cited by 53,625
Oncogenic ras provokes premature cell senescence associated with accumulation of p53 and p16INK4a
Serrano, M., Lin, A. W., McCurrach, M. E., Beach, D., & Lowe, S. W. (1997) · Cell · doi:10.1016/s0092-8674(00)81902-9 · Cited by 5,218 · cited 2×
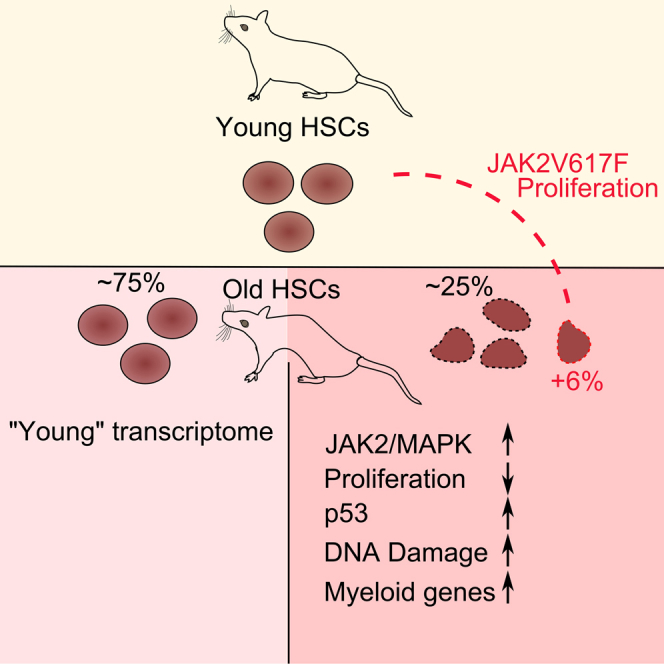
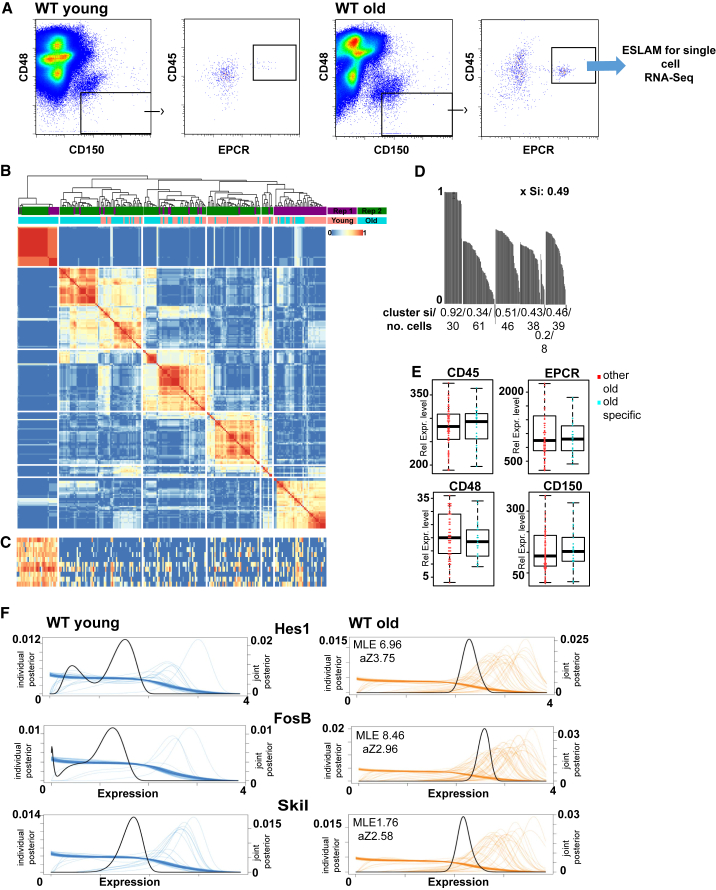
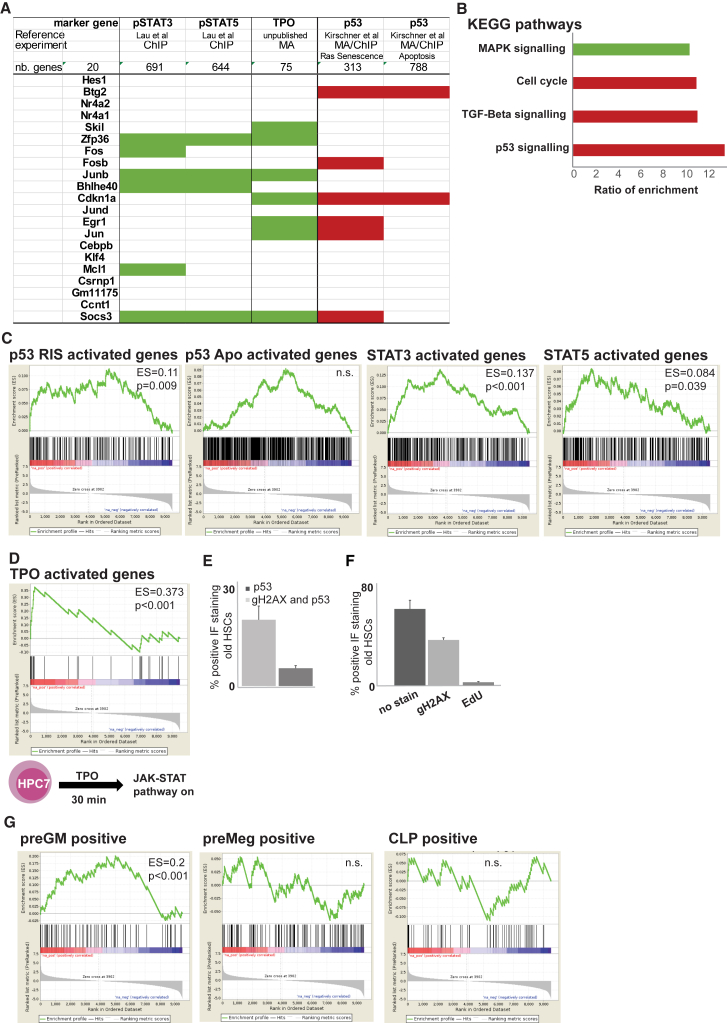
“Further transcriptional description of the subcluster shows myeloid bias as well as JAK/STAT- and MAPK (mitogen-activated protein kinase)-driven pro-proliferative gene signatures, reminiscent of the proliferation-driven cell-cycle arrest in cellular senescence (Serrano et al., 1997).”
BackgroundSmart-seq2 for sensitive full-length transcriptome profiling in single cells
Picelli, S., Björklund, Å. K., Faridani, O. R., Sagasser, S., Winberg, G., & Sandberg, R. (2013) · Nature Methods · doi:10.1038/nmeth.2639 · Cited by 2,358 · cited 2×
“cDNA from single cells was obtained as described (Picelli et al., 2013).”
Methodp53 mutant mice that display early ageing-associated phenotypes
Tyner, S. D., Venkatachalam, S., Choi, J., Jones, S., Ghebranious, N., Igelmann, H., Lu, X., Soron, G., Cooper, B., Brayton, C., et al. (2002) · Nature · doi:10.1038/415045a · Cited by 1,459 · cited 2×
“Observations from studies in progeroid and hyperactivated p53mousemodels suggest amore generalized role for p53, possibly extending the relevance of our findings to nonhematopoietic tissues (Varela et al., 2005; Tyner et al., 2002).”
BackgroundReversal of human cellular senescence: roles of the p53 and p16 pathways
Beauséjour, C. M., Krtolica, A., Galimi, F., Narita, M., Lowe, S. W., Yaswen, P., & Campisi, J. (2003) · The EMBO Journal · doi:10.1093/emboj/cdg417 · Cited by 1,457
Cell intrinsic alterations underlie hematopoietic stem cell aging
Rossi, D. J., Bryder, D., Zahn, J. M., Ahlenius, H., Sonu, R., Wagers, A. J., & Weissman, I. L. (2005) · Proceedings of the National Academy of Sciences · doi:10.1073/pnas.0503280102 · Cited by 1,152 · cited 2×
“Myeloid bias is well documented in the literature (Rossi et al., 2005), but molecular mechanisms are, thus far, elusive.”
BackgroundDeficiencies in DNA damage repair limit the function of haematopoietic stem cells with age
Rossi, D. J., Bryder, D., Seita, J., Nussenzweig, A., Hoeijmakers, J., & Weissman, I. L. (2007) · Nature · doi:10.1038/nature05862 · Cited by 1,115
A single-cell resolution map of mouse hematopoietic stem and progenitor cell differentiation
Nestorowa, S., Hamey, F. K., Pijuan Sala, B., Diamanti, E., Shepherd, M., Laurenti, E., Wilson, N. K., Kent, D. G., & Göttgens, B. (2016) · Blood · doi:10.1182/blood-2016-05-716480 · Cited by 768
Self-citationPronk, C. J. H., Rossi, D. J., Månsson, R., Attema, J. L., Norddahl, G. L., Chan, C. K. F., Sigvardsson, M., Weissman, I. L., & Bryder, D. (2007) · Cell Stem Cell · doi:10.1016/j.stem.2007.07.005 · Cited by 671
Transcriptional Regulation by P53
Beckerman, R., & Prives, C. (2010) · Cold Spring Harbor Perspectives in Biology · doi:10.1101/cshperspect.a000935 · Cited by 569
Clonal analysis reveals multiple functional defects of aged murine hematopoietic stem cells
Dykstra, B., Olthof, S., Schreuder, J., Ritsema, M., & de Haan, G. (2011) · Journal of Experimental Medicine · doi:10.1084/jem.20111490 · Cited by 494 · cited 1×
“In addition to the lineage skew, aging of the hematopoietic system also results in reduced performance in blood reconstitution and engraftment, regardless of lineage output (Dykstra et al., 2011).”
BackgroundAccelerated ageing in mice deficient in Zmpste24 protease is linked to p53 signalling activation
Varela, I., Cadiñanos, J., Pendás, A. M., Gutiérrez-Fernández, A., Folgueras, A. R., Sánchez, L. M., Zhou, Z., Rodríguez, F. J., Stewart, C. L., Vega, J. A., et al. (2005) · Nature · doi:10.1038/nature04019 · Cited by 466
Research works printed but not linked: 22
- Baxter, 2005, Acquired mutation of the tyrosine kinase JAK2 in human myeloproliferative disorders, Lancet, 365, 1054, 10.1016/S0140-6736(05)71142-9 · DOI · Paper page
- Beerman, 2010, Stem cells and the aging hematopoietic system, Curr. Opin. Immunol., 22, 500, 10.1016/j.coi.2010.06.007 · DOI
- Bernitz, 2016, Hematopoietic stem cells count and remember self-renewal divisions, Cell, 167, 1296, 10.1016/j.cell.2016.10.022 · DOI · Paper page
- Chen, 2014, JAK2V617F promotes replication fork stalling with disease-restricted impairment of the intra-S checkpoint response, Proc. Natl. Acad. Sci. USA, 111, 15190, 10.1073/pnas.1401873111 · DOI
- Cheng, 2000, Hematopoietic stem cell quiescence maintained by p21cip1/waf1, Science, 287, 1804, 10.1126/science.287.5459.1804 · DOI · Paper page
- Dumble, 2007, The impact of altered p53 dosage on hematopoietic stem cell dynamics during aging, Blood, 109, 1736, 10.1182/blood-2006-03-010413 · DOI
- Geiger, 2013, The ageing haematopoietic stem cell compartment, Nat. Rev. Immunol., 13, 376, 10.1038/nri3433 · DOI · Paper page
- Grover, 2016, Single-cell RNA sequencing reveals molecular and functional platelet bias of aged haematopoietic stem cells, Nat. Commun., 7, 11075, 10.1038/ncomms11075 · DOI
- Kanehisa, 2012, KEGG for integration and interpretation of large-scale molecular data sets, Nucleic Acids Res., 40, D109, 10.1093/nar/gkr988 · DOI · Paper page
- Kent, 2013, Self-renewal of single mouse hematopoietic stem cells is reduced by JAK2V617F without compromising progenitor cell expansion, PLoS Biol., 11, e1001576, 10.1371/journal.pbio.1001576 · DOI
- Kenzelmann Broz, 2013, Global genomic profiling reveals an extensive p53-regulated autophagy program contributing to key p53 responses, Genes Dev., 27, 1016, 10.1101/gad.212282.112 · DOI · Paper page
- Kharchenko, 2014, Bayesian approach to single-cell differential expression analysis, Nat. Methods, 11, 740, 10.1038/nmeth.2967 · DOI · Paper page
- Kirschner, 2015, Phenotype specific analyses reveal distinct regulatory mechanism for chronically activated p53, PLoS Genet., 11, e1005053, 10.1371/journal.pgen.1005053 · DOI
- Kiselev, 2017, SC3: consensus clustering of single-cell RNA-seq data, Nat. Methods, 14, 483, 10.1038/nmeth.4236 · DOI · Paper page
- Kowalczyk, 2015, Single-cell RNA-seq reveals changes in cell cycle and differentiation programs upon aging of hematopoietic stem cells, Genome Res., 25, 1860, 10.1101/gr.192237.115 · DOI · Paper page
- Land, 2015, The orphan nuclear receptor NR4A1 specifies a distinct subpopulation of quiescent myeloid-biased long-term HSCs, Stem Cells, 33, 278, 10.1002/stem.1852 · DOI · Paper page
- Lau, 2015, The JAK-STAT signaling pathway is differentially activated in CALR-positive compared with JAK2V617F-positive ET patients, Blood, 125, 1679, 10.1182/blood-2014-12-618074 · DOI
- Li, 2010, JAK2 V617F impairs hematopoietic stem cell function in a conditional knock-in mouse model of JAK2 V617F-positive essential thrombocythemia, Blood, 116, 1528, 10.1182/blood-2009-12-259747 · DOI
- Li, 2014, JAK2V617F homozygosity drives a phenotypic switch in myeloproliferative neoplasms, but is insufficient to sustain disease, Blood, 123, 3139, 10.1182/blood-2013-06-510222 · DOI
- Park, 2016, Cytokine-induced megakaryocytic differentiation is regulated by genome-wide loss of a uSTAT transcriptional program, EMBO J., 35, 580, 10.15252/embj.201592383 · DOI
- Rawlings, 2004, The JAK/STAT signaling pathway, J. Cell Sci., 117, 1281, 10.1242/jcs.00963 · DOI · Paper page
- Vainchenker, 2013, JAK/STAT signaling in hematological malignancies, Oncogene, 32, 2601, 10.1038/onc.2012.347 · DOI · Paper page
Cited by
cGAS surveillance of micronuclei links genome instability to innate immunity
Mackenzie, K. J., Carroll, P., Martin, C.-A., Murina, O., Fluteau, A., Simpson, D. J., Olova, N., Sutcliffe, H., Rainger, J. K., Leitch, A., et al. (2017) · Nature · doi:10.1038/nature23449 · Cited by 1,752
Self-citationCellular and epigenetic drivers of stem cell ageing
Ermolaeva, M., Neri, F., Ori, A., & Rudolph, K. L. (2018) · Nature Reviews Molecular Cell Biology · doi:10.1038/s41580-018-0020-3 · Cited by 272
Murine single-cell RNA-seq reveals cell-identity- and tissue-specific trajectories of aging
Kimmel, J. C., Penland, L., Rubinstein, N. D., Hendrickson, D. G., Kelley, D. R., & Rosenthal, A. Z. (2019) · Genome Research · doi:10.1101/gr.253880.119 · Cited by 184
“Previous studies have reported the emergence of novel cell states with age in the hematopoietic system (Kirschner et al. 2017), and senescence phenotypes may be considered novel cell states from this”
BackgroundNotch Signaling Mediates Secondary Senescence
Teo, Y. V., Rattanavirotkul, N., Olova, N., Salzano, A., Quintanilla, A., Tarrats, N., Kiourtis, C., Müller, M., Green, A. R., Adams, P. D., et al. (2019) · Cell Reports · doi:10.1016/j.celrep.2019.03.104 · Cited by 149
Self-citationA comprehensive transcriptome signature of murine hematopoietic stem cell aging
Flohr Svendsen, A., Yang, D., Kim, K., Lazare, S., Skinder, N., Zwart, E., Mura-Meszaros, A., Ausema, A., von Eyss, B., de Haan, G., et al. (2021) · Blood · doi:10.1182/blood.2020009729 · Cited by 138
Metadata
- Authors
- Kirschner, K., Chandra, T., Kiselev, V., Flores-Santa Cruz, D., Macaulay, I. C., Park, H. J., Li, J., Kent, D. G., Kumar, R., Pask, D. C., Hamilton, T. L., Hemberg, M., Reik, W., & Green, A. R.
- Venue
- Cell Reports
- Publisher
- Elsevier BV
- Published
- 2017-05
- Volume
- 19
- Issue
- 8
- Pages
- 1503-1511
- ISSN
- 2211-1247
- PMC
- PMC5457484
- Cited by
- 100
- References
- 12
- Language
- en
- Licence
- Funders
- NIHR Cambridge Biomedical Research Centre
- Wellcome Trust (095645/Z/11/Z)
- Medical Research Council
- Biotechnology and Biological Sciences Research Council (BB/K010867/1)
- Kay Kendall Leukaemia Fund
- European Commission (104710/Z/14/Z, 13003)
About these checks
Registry, retraction, Cites and statistics results are computed, not judged, with one exception: a printed reference that no index lists is read once by a model before it counts as a citation error. Claims are extracted by a model and kept only when their quote appears verbatim in the text; each cited source is then checked, with a model’s help, for whether it says what the claim relies on. Those verdicts can be wrong — read the claim’s quote and the cited source before relying on one.
Statistics and arithmetic are recomputed, not judged.
Confidence bands are shown only for fields calibrated on our annotated test set. None is calibrated yet, so no band is shown.
What counts as a claim ›How we measure confidence ›How we check this ›
Are you an author, or do you see a problem with this page? Request a review
