Cited by 23

The DOI matches its Crossref record; 2 of the 2 references it cites were found in a registry or an index.

Rinf Regulates Pluripotency Network Genes and Tet Enzymes in Embryonic Stem Cells

Ravichandran, Mirunalini, Lei, Run, Tang, Qin, Zhao, Yilin, Lee, Joun, Ma, Liyang, Chrysanthou, Stephanie, Lorton, Benjamin M., Cvekl, Ales, Shechter, David, Zheng, Deyou, Dawlaty, Meelad M.·2019·Cell Reports

Overview

The claims and statistics of this paper haven’t been checked yet.

Run the check — free, no account needed. It reads the open-access text and checks the sources it cites.

A few free checks a day · papers already verified open instantly · results are public

Integrity signals

Registry

Crossref · 10.1016/j.celrep.2019.07.080

Cites

2 of 2 references verified0 citation errors · 0 not checkable

Statistics

Figures

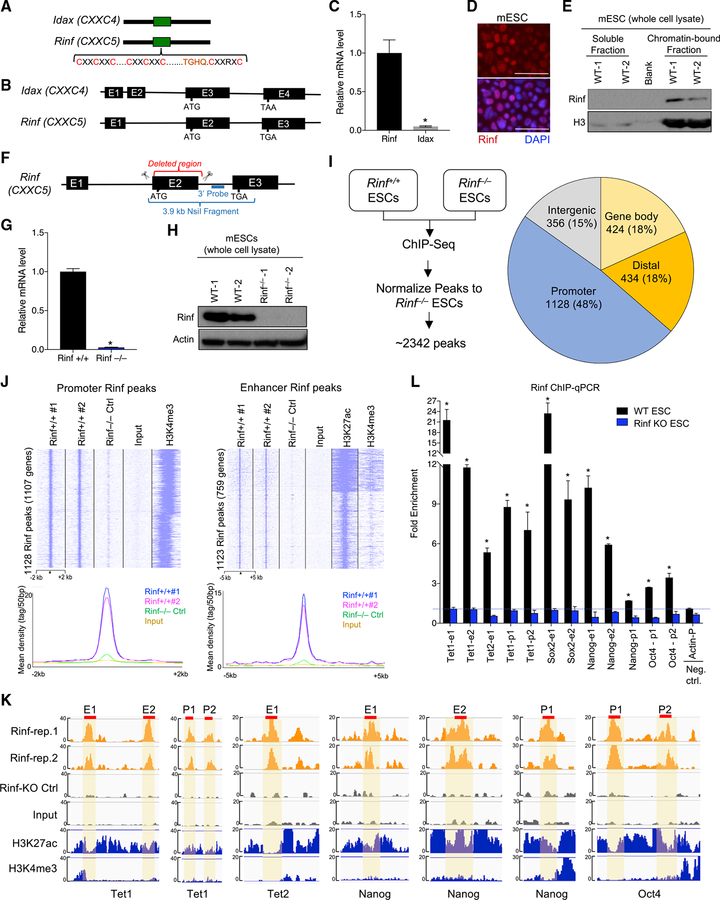
Figure 1. Expression and Chromatin Enrichment of Rinf in Mouse ESCs (A) Schematic of protein domains of Rinf and Idax. (B) Schematic of exon and intron structures of Rinf and Idax. (C) Rinf and Idax mRNA levels quantified by qRT-PCR in ESCs. Data normalized to glyceraldehyde 3-phosphate dehydrogenase (Gapdh). (D) Expression of Rinf in mouse ESCs detected by immunofluorescence. (E) Rinf protein level in soluble and chromatin-bound fractions of ESC lysate. (F) Schematic of gene targeting strategy for generating Rinf knockout ESCs.. (G) Rinf mRNA level quantified by qRT-PCR in targeted ESC clones. Data normalized to Gapdh. (H) Quantification of Rinf protein by western blot in targeted ESC clones. (I) Schematic of ChIP-seq strategy (left), and distribution of Rinf peaks in the genome (right). (J) ChIP-seq read densities at Rinf peaks presented as heatmaps (top) and line graphs (bottom). All rows are peaks and centers are the summits of Rinf peaks. The H3K4me3 and H3K27ac data were obtained from a previous study (see STAR Methods). (K) Enrichment of Rinf ChIP-seq signals at regulatory regions of selected pluripotency and Tet genes. H3K27ac and H3K4me3 tracks are used to depict enhancers and promoters (±2 kb of TSS). Selected regions of these peaks (red line) are validated by ChIP-qPCR in (L). (L) Quantification of enrichment of Rinf at regulatory elements of indicated genes by ChIP-qPCR in ESCs (data normalized to immunoglobulin G [IgG]). Rinf KO ESCs are used as control for antibody specificity. Actin is used as a negative control. For all panels, data are presented as mean ± SD. *Statistically significant (p < 0.05). E, enhancer; p, promoter. Scale bars, 50 mm (see also Figure S1).
Figure 1. Expression and Chromatin Enrichment of Rinf in Mouse ESCs (A) Schematic of protein domains of Rinf and Idax. (B) Schematic of exon and intron structures of Rinf and Idax. (C) Rinf and Idax mRNA levels quantified by qRT-PCR in ESCs. Data normalized to glyceraldehyde 3-phosphate dehydrogenase (Gapdh). (D) Expression of Rinf in mouse ESCs detected by immunofluorescence. (E) Rinf protein level in soluble and chromatin-bound fractions of ESC lysate. (F) Schematic of gene targeting strategy for generating Rinf knockout ESCs.. (G) Rinf mRNA level quantified by qRT-PCR in targeted ESC clones. Data normalized to Gapdh. (H) Quantification of Rinf protein by western blot in targeted ESC clones. (I) Schematic of ChIP-seq strategy (left), and distribution of Rinf peaks in the genome (right). (J) ChIP-seq read densities at Rinf peaks presented as heatmaps (top) and line graphs (bottom). All rows are peaks and centers are the summits of Rinf peaks. The H3K4me3 and H3K27ac data were obtained from a previous study (see STAR Methods). (K) Enrichment of Rinf ChIP-seq signals at regulatory regions of selected pluripotency and Tet genes. H3K27ac and H3K4me3 tracks are used to depict enhancers and promoters (±2 kb of TSS). Selected regions of these peaks (red line) are validated by ChIP-qPCR in (L). (L) Quantification of enrichment of Rinf at regulatory elements of indicated genes by ChIP-qPCR in ESCs (data normalized to immunoglobulin G [IgG]). Rinf KO ESCs are used as control for antibody specificity. Actin is used as a negative control. For all panels, data are presented as mean ± SD. *Statistically significant (p < 0.05). E, enhancer; p, promoter. Scale bars, 50 mm (see also Figure S1).CC BY-NC-ND · PubMed Central
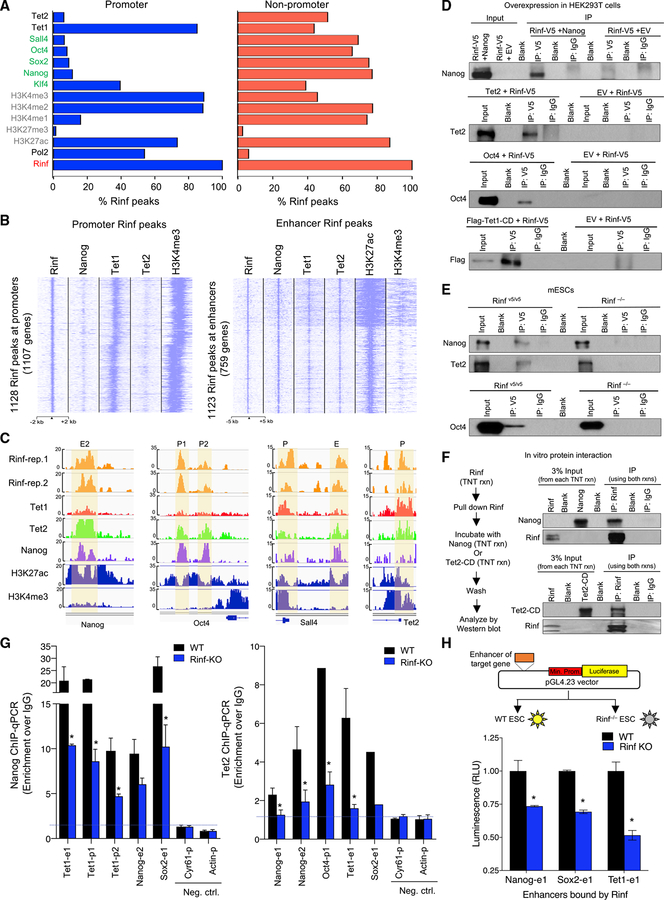
Figure 2. Co-occupancy of Rinf with Pluripotency Factors and Tet Enzymes at Gene Regulatory Regions (A) Overlapping analysis of Rinf peaks (from this study) with those of pluripotency factors, Tet enzymes, and activating/repressive histone marks (from previous studies, see STAR Methods). Data presented as % of Rinf peaks overlapping with each of the factors. (B) Enrichment of Rinf peaks at ChIP-seq signals of Nanog, Tet1, and Tet2 at promoters (±2 kb of TSS and H3K4me3 positive, left) and enhancers (H3K27ac positive and H3K4me3 low, right). (C) Enrichment of ChIP-seq signals showing co-occupancy of Rinf, pluripotency factors, and Tet enzymes at selected pluripotency and Tet genes. H3K27ac and H3K4me3 tracks are used as reference to depict enhancers and promoters (±2 kb of TSS). (D) Co-immunoprecipitation of exogenously expressed V5-tagged Rinf with Nanog, Oct4, Tet1 catalytic domain (Tet1-CD), and Tet2 in HEK293T cells using anti-V5 antibody. (E) Co-immunoprecipitation of endogenous Rinf with Nanog, Oct4, and Tet2 in mouse ESCs using anti-V5 antibody. Rinf−/− ESCs are used as negative control. (F) Co-immunoprecipitation of in vitro transcribed and translated Rinf, Nanog, and Tet2 catalytic domain (Tet2-CD) from rabbit reticulocyte lysate. (G) Enrichment of Nanog and Tet2 at regulatory elements of indicated genes quantified by ChIP-qPCR in wild-type and Rinf−/− ESCs (data normalized to IgG). Actin and Cyr61 are used as negative controls. (H) Schematic of dual luciferase reporter assay applied to test enhancers targeted by Rinf (top). Transcriptional activity is presented as relative luminescence unit (RLU), which is normalized to the luminescence from cells that express the empty vector only (bottom). Data presented as mean ± SEM. *Statistically significant (p < 0.05). E, enhancer; p, promoter (see also Figure S2).
Figure 2. Co-occupancy of Rinf with Pluripotency Factors and Tet Enzymes at Gene Regulatory Regions (A) Overlapping analysis of Rinf peaks (from this study) with those of pluripotency factors, Tet enzymes, and activating/repressive histone marks (from previous studies, see STAR Methods). Data presented as % of Rinf peaks overlapping with each of the factors. (B) Enrichment of Rinf peaks at ChIP-seq signals of Nanog, Tet1, and Tet2 at promoters (±2 kb of TSS and H3K4me3 positive, left) and enhancers (H3K27ac positive and H3K4me3 low, right). (C) Enrichment of ChIP-seq signals showing co-occupancy of Rinf, pluripotency factors, and Tet enzymes at selected pluripotency and Tet genes. H3K27ac and H3K4me3 tracks are used as reference to depict enhancers and promoters (±2 kb of TSS). (D) Co-immunoprecipitation of exogenously expressed V5-tagged Rinf with Nanog, Oct4, Tet1 catalytic domain (Tet1-CD), and Tet2 in HEK293T cells using anti-V5 antibody. (E) Co-immunoprecipitation of endogenous Rinf with Nanog, Oct4, and Tet2 in mouse ESCs using anti-V5 antibody. Rinf−/− ESCs are used as negative control. (F) Co-immunoprecipitation of in vitro transcribed and translated Rinf, Nanog, and Tet2 catalytic domain (Tet2-CD) from rabbit reticulocyte lysate. (G) Enrichment of Nanog and Tet2 at regulatory elements of indicated genes quantified by ChIP-qPCR in wild-type and Rinf−/− ESCs (data normalized to IgG). Actin and Cyr61 are used as negative controls. (H) Schematic of dual luciferase reporter assay applied to test enhancers targeted by Rinf (top). Transcriptional activity is presented as relative luminescence unit (RLU), which is normalized to the luminescence from cells that express the empty vector only (bottom). Data presented as mean ± SEM. *Statistically significant (p < 0.05). E, enhancer; p, promoter (see also Figure S2).CC BY-NC-ND · PubMed Central
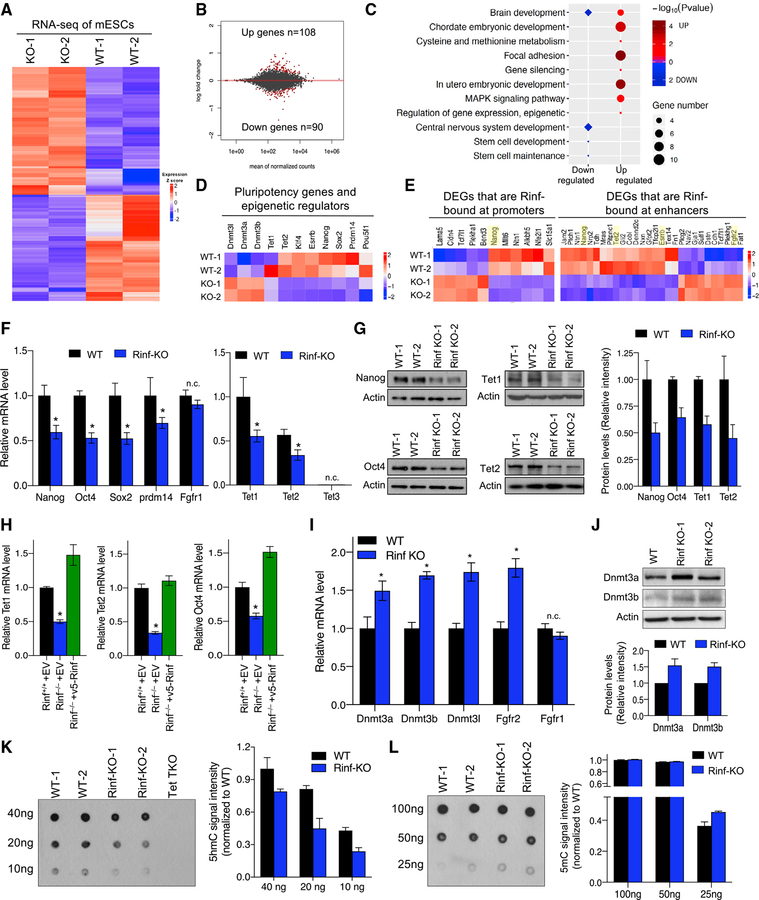
Figure 3. Loss of Rinf Reduces the Expression of Pluripotency Factors and Tet Enzymes in ESCs and Perturbs Gene Expression Programs (A) Heatmap of differentially expressed genes identified. Colors indicating relative expression. (B) MA plot of the average gene expression level and change, with DEGs in red. (C) GO enrichment and Kyoto Encyclopedia of Genes and Genomes (KEGG) pathway analysis of the differentially expressed genes. (D) Expression patterns of deregulated pluripotency genes, Tets, and Dnmts. (E) Expression patterns of differentially expressed genes that are bound by Rinf. (F) mRNA levels of pluripotency and Tet genes quantified by qRT-PCR. Three ESC lines of each genotype are used. Fgfr1 is used as a negative control (unchanged gene in RNA-seq). Expression of Tet enzymes in the left plot is normalized to the wild-type levels of Tet1. (G) Protein levels of indicated genes quantified by western blot. Quantification of signal intensity of bands by ImageJ is plotted on the right. (H) Restoration of the expression of pluripotency and Tet genes in Rinf−/− ESCs upon expression of exogenous Rinf. Data represent mRNA levels quantified by qRT-PCR. (I) mRNA levels of indicated genes quantified by qRT-PCR. Three independent ESC lines of each genotype are used. Fgfr1 is used as a negative control (unchanged gene in RNA-seq). (J) Protein levels of Dnmt3a and Dnmt3b quantified by western blot in ESCs. Quantification of signal intensity of bands by ImageJ is plotted on the right. (K) Global 5hmC levels in ESC DNA quantified by dot blot. Tet1/2/3 triple knockout (TKO) ESC DNA is used as negative control. Average 5hmC signal intensity was plotted. (L) Global 5mC levels in ESC DNA quantified by dot blot. Average 5mC signal intensity was plotted. Data presented as mean ± SD. *Statistically significant (p < 0.05). n.c., no change (see also Figure S3).
Figure 3. Loss of Rinf Reduces the Expression of Pluripotency Factors and Tet Enzymes in ESCs and Perturbs Gene Expression Programs (A) Heatmap of differentially expressed genes identified. Colors indicating relative expression. (B) MA plot of the average gene expression level and change, with DEGs in red. (C) GO enrichment and Kyoto Encyclopedia of Genes and Genomes (KEGG) pathway analysis of the differentially expressed genes. (D) Expression patterns of deregulated pluripotency genes, Tets, and Dnmts. (E) Expression patterns of differentially expressed genes that are bound by Rinf. (F) mRNA levels of pluripotency and Tet genes quantified by qRT-PCR. Three ESC lines of each genotype are used. Fgfr1 is used as a negative control (unchanged gene in RNA-seq). Expression of Tet enzymes in the left plot is normalized to the wild-type levels of Tet1. (G) Protein levels of indicated genes quantified by western blot. Quantification of signal intensity of bands by ImageJ is plotted on the right. (H) Restoration of the expression of pluripotency and Tet genes in Rinf−/− ESCs upon expression of exogenous Rinf. Data represent mRNA levels quantified by qRT-PCR. (I) mRNA levels of indicated genes quantified by qRT-PCR. Three independent ESC lines of each genotype are used. Fgfr1 is used as a negative control (unchanged gene in RNA-seq). (J) Protein levels of Dnmt3a and Dnmt3b quantified by western blot in ESCs. Quantification of signal intensity of bands by ImageJ is plotted on the right. (K) Global 5hmC levels in ESC DNA quantified by dot blot. Tet1/2/3 triple knockout (TKO) ESC DNA is used as negative control. Average 5hmC signal intensity was plotted. (L) Global 5mC levels in ESC DNA quantified by dot blot. Average 5mC signal intensity was plotted. Data presented as mean ± SD. *Statistically significant (p < 0.05). n.c., no change (see also Figure S3).CC BY-NC-ND · PubMed Central
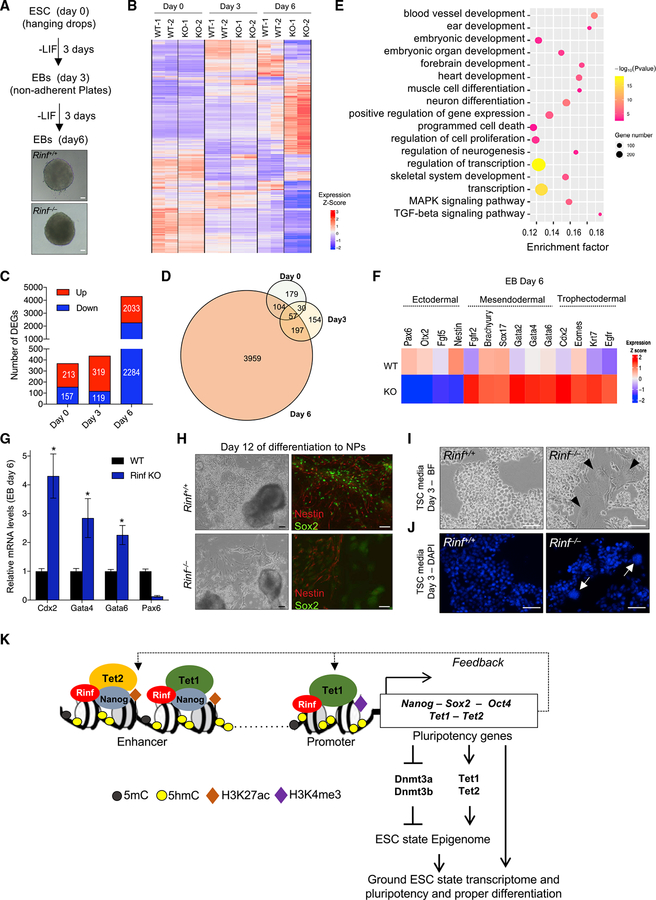
Figure 4. Rinf-Deficient ESCs Have Compromised Differentiation (A) Schematic of differentiation of ESCs to EBs over 6 days and bright-field images of EBs. (B) Heatmap of DEGs identified at the indicated time points during differentiation to EBs. Colors represent relative expression. Two independent ESC lines were used in the analysis. (C) Number of DEGs between wild-type and Rinf−/− EBs plotted for the indicated time points during differentiation. (D) Venn diagram illustrating overlap of DEGs between wild-type and Rinf−/− EBs for each time point during differentiation. (E) GO enrichment and KEGG pathway analysis of the DEGs at day 6 of differentiation to EBs. (F) Expression patterns of deregulated lineage marker genes at day 6 of differentiation. (G) Quantification of mRNA levels of indicated lineage markers by qRT-PCR in day 6 EBs. Three independent ESC lines of each genotype were used. (H) Bright-field images of culture of ESCs at day 12 of differentiation to neural progenitors (NPs) (left). Immunofluorescence images of NPs derived from ESCs and stained for Nestin and Sox2 at day 12 of differentiation (right). (I) Bright-field images of ESCs cultured in TSC media for 3 days. Arrowheads indicate trophoblast giant cells. (J) 4′,6-Diamidino-2-phenylindole (DAPI) staining of ESCs cultured in TSC media for 3 days. Arrowheads indicate large nuclei of trophoblast giant cells. (K) Model for the role of Rinf in transcriptional regulation of pluripotency and Tet genes in ESCs. Data presented as mean ± SD. *Statistically significant (p < 0.05). All scale bars, 50 mm (see also Figure S4).
Figure 4. Rinf-Deficient ESCs Have Compromised Differentiation (A) Schematic of differentiation of ESCs to EBs over 6 days and bright-field images of EBs. (B) Heatmap of DEGs identified at the indicated time points during differentiation to EBs. Colors represent relative expression. Two independent ESC lines were used in the analysis. (C) Number of DEGs between wild-type and Rinf−/− EBs plotted for the indicated time points during differentiation. (D) Venn diagram illustrating overlap of DEGs between wild-type and Rinf−/− EBs for each time point during differentiation. (E) GO enrichment and KEGG pathway analysis of the DEGs at day 6 of differentiation to EBs. (F) Expression patterns of deregulated lineage marker genes at day 6 of differentiation. (G) Quantification of mRNA levels of indicated lineage markers by qRT-PCR in day 6 EBs. Three independent ESC lines of each genotype were used. (H) Bright-field images of culture of ESCs at day 12 of differentiation to neural progenitors (NPs) (left). Immunofluorescence images of NPs derived from ESCs and stained for Nestin and Sox2 at day 12 of differentiation (right). (I) Bright-field images of ESCs cultured in TSC media for 3 days. Arrowheads indicate trophoblast giant cells. (J) 4′,6-Diamidino-2-phenylindole (DAPI) staining of ESCs cultured in TSC media for 3 days. Arrowheads indicate large nuclei of trophoblast giant cells. (K) Model for the role of Rinf in transcriptional regulation of pluripotency and Tet genes in ESCs. Data presented as mean ± SD. *Statistically significant (p < 0.05). All scale bars, 50 mm (see also Figure S4).CC BY-NC-ND · PubMed Central

Verification

Claims the paper makes

The claims and statistics of this paper haven’t been checked yet.

Run the check — free, no account needed. It reads the open-access text and checks the sources it cites.

A few free checks a day · papers already verified open instantly · results are public

Claims other papers make about this one

Each is checked against this paper’s own text: does it say what the citing paper says it does?

Self-check

Percentages, sums and reported differences re-computed from the paper’s own numbers.

The self-check needs the paper’s full text.

Citations

Cites

Show all 2 references

Research works printed but not linked: 42

  1. Anders, 2015, HTSeq—a Python framework to work with high-throughput sequencing data, Bioinformatics, 31, 166, 10.1093/bioinformatics/btu638 · DOI · Paper page
  2. Astori, 2013, CXXC5 (retinoid-inducible nuclear factor, RINF) is a potential therapeutic target in high-risk human acute myeloid leukemia, Oncotarget, 4, 1438, 10.18632/oncotarget.1195 · DOI
  3. Chrysanthou, 2018, A Critical Role of TET1/2 Proteins in Cell-Cycle Progression of Trophoblast Stem Cells, Stem Cell Reports, 10, 1355, 10.1016/j.stemcr.2018.02.014 · DOI
  4. Dawlaty, 2013, Combined deficiency of Tet1 and Tet2 causes epigenetic abnormalities but is compatible with postnatal development, Dev. Cell, 24, 310, 10.1016/j.devcel.2012.12.015 · DOI
  5. Grabole, 2013, Prdm14 promotes germline fate and naive pluripotency by repressing FGF signalling and DNA methylation, EMBO Rep., 14, 629, 10.1038/embor.2013.67 · DOI
  6. Hackett, 2012, Parallel mechanisms of epigenetic reprogramming in the germline, Trends Genet., 28, 164, 10.1016/j.tig.2012.01.005 · DOI
  7. Hanna, 2010, Pluripotency and cellular reprogramming: facts, hypotheses, unresolved issues, Cell, 143, 508, 10.1016/j.cell.2010.10.008 · DOI
  8. Hayashi, 2007, Germ cell specification in mice, Science, 316, 394, 10.1126/science.1137545 · DOI
  9. Heinz, 2010, Simple combinations of lineage-determining transcription factors prime cis-regulatory elements required for macrophage and B cell identities, Mol. Cell, 38, 576, 10.1016/j.molcel.2010.05.004 · DOI · Paper page
  10. Jaenisch, 2008, Stem cells, the molecular circuitry of pluripotency and nuclear reprogramming, Cell, 132, 567, 10.1016/j.cell.2008.01.015 · DOI
  11. Jiao, 2012, DAVID-WS: a stateful web service to facilitate gene/protein list analysis, Bioinformatics, 28, 1805, 10.1093/bioinformatics/bts251 · DOI
  12. Johnson, 2007, Genome-wide mapping of in vivo protein-DNA interactions, Science, 316, 1497, 10.1126/science.1141319 · DOI · Paper page
  13. Kim, 2010, A novel Wilms tumor 1 (WT1) target gene negatively regulates the WNT signaling pathway, J. Biol. Chem., 285, 14585, 10.1074/jbc.M109.094334 · DOI
  14. Kim, 2013, TopHat2: accurate alignment of transcriptomes in the presence of insertions, deletions and gene fusions, Genome Biol., 14, R36, 10.1186/gb-2013-14-4-r36 · DOI · Paper page
  15. Kim, 2014, CXXC5 is a transcriptional activator of Flk-1 and mediates bone morphogenic protein-induced endothelial cell differentiation and vessel formation, FASEB J., 28, 615, 10.1096/fj.13-236216 · DOI
  16. Kim, 2016, CXXC5 plays a role as a transcription activator for myelin genes on oligodendrocyte differentiation, Glia, 64, 350, 10.1002/glia.22932 · DOI
  17. Knappskog, 2011, RINF (CXXC5) is overexpressed in solid tumors and is an unfavorable prognostic factor in breast cancer, Ann. Oncol., 22, 2208, 10.1093/annonc/mdq737 · DOI
  18. Ko, 2013, Modulation of TET2 expression and 5-methylcytosine oxidation by the CXXC domain protein IDAX, Nature, 497, 122, 10.1038/nature12052 · DOI · Paper page
  19. Koh, 2011, Tet1 and Tet2 regulate 5-hydroxymethylcytosine production and cell lineage specification in mouse embryonic stem cells, Cell Stem Cell, 8, 200, 10.1016/j.stem.2011.01.008 · DOI · Paper page
  20. Kojima, 2009, Decreased expression of CXXC4 promotes a malignant phenotype in renal cell carcinoma by activating Wnt signaling, Oncogene, 28, 297, 10.1038/onc.2008.391 · DOI
  21. Langmead, 2012, Fast gapped-read alignment with Bowtie 2, Nat. Methods, 9, 357, 10.1038/nmeth.1923 · DOI · Paper page
  22. Lee, 2015, The Dishevelled-binding protein CXXC5 negatively regulates cutaneous wound healing, J. Exp. Med., 212, 1061, 10.1084/jem.20141601 · DOI
  23. Li, 2014, CXXC5 regulates differentiation of C2C12 myoblasts into myocytes, J. Muscle Res. Cell Motil., 35, 259, 10.1007/s10974-014-9400-2 · DOI
  24. Liu, 2013, Intrinsic and extrinsic connections of Tet3 dioxygenase with CXXC zinc finger modules, PLoS One, 8, e62755, 10.1371/journal.pone.0062755 · DOI
  25. Love, 2014, Moderated estimation of fold change and dispersion for RNA-seq data with DESeq2, Genome Biol., 15, 550, 10.1186/s13059-014-0550-8 · DOI · Paper page
  26. Ma, 2011, Sequence-specific regulator Prdm14 safeguards mouse ESCs from entering extraembryonic endoderm fates, Nat. Struct. Mol. Biol., 18, 120, 10.1038/nsmb.2000 · DOI
  27. Ma, 2017, Epigenetic regulator CXXC5 recruits DNA demethylase Tet2 to regulate TLR7/9-elicited IFN response in pDCs, J. Exp. Med., 163, 1471, 10.1084/jem.20161149 · DOI · Paper page
  28. Mitsui, 2003, The homeoprotein Nanog is required for maintenance of pluripotency in mouse epiblast and ES cells, Cell, 113, 631, 10.1016/S0092-8674(03)00393-3 · DOI
  29. Pendino, 2009, Functional involvement of RINF, retinoid-inducible nuclear factor (CXXC5), in normal and tumoral human myelopoiesis, Blood, 113, 3172, 10.1182/blood-2008-07-170035 · DOI
  30. Rockowitz, 2015, Significant expansion of the REST/NRSF cistrome in human versus mouse embryonic stem cells: potential implications for neural development, Nucleic Acids Res., 43, 5730, 10.1093/nar/gkv514 · DOI
  31. Schneider, 2012, NIH Image to ImageJ: 25 years of image analysis, Nat. Methods, 9, 671, 10.1038/nmeth.2089 · DOI · Paper page
  32. Smith, 2013, DNA methylation: roles in mammalian development, Nat. Rev. Genet., 14, 204, 10.1038/nrg3354 · DOI · Paper page
  33. Trapnell, 2010, Transcript assembly and quantification by RNA-Seq reveals unannotated transcripts and isoform switching during cell differentiation, Nat. Biotechnol., 28, 511, 10.1038/nbt.1621 · DOI · Paper page
  34. Wang, 2013, One-step generation of mice carrying mutations in multiple genes by CRISPR/Cas-mediated genome engineering, Cell, 153, 910, 10.1016/j.cell.2013.04.025 · DOI · Paper page
  35. Whyte, 2013, Master transcription factors and mediator establish super-enhancers at key cell identity genes, Cell, 153, 307, 10.1016/j.cell.2013.03.035 · DOI · Paper page
  36. Wu, 2010, Active DNA demethylation: many roads lead to Rome, Nat. Rev. Mol. Cell Biol., 11, 607, 10.1038/nrm2950 · DOI
  37. Wu, 2011, Dual functions of Tet1 in transcriptional regulation in mouse embryonic stem cells, Nature, 473, 389, 10.1038/nature09934 · DOI · Paper page
  38. Xiong, 2016, Cooperative Action between SALL4A and TET Proteins in Stepwise Oxidation of 5-Methylcytosine, Mol. Cell, 64, 913, 10.1016/j.molcel.2016.10.013 · DOI
  39. Yamaji, 2013, PRDM14 ensures naive pluripotency through dual regulation of signaling and epigenetic pathways in mouse embryonic stem cells, Cell Stem Cell, 12, 368, 10.1016/j.stem.2012.12.012 · DOI
  40. Ye, 2011, seqMINER: an integrated ChIP-seq data interpretation platform, Nucleic Acids Res., 39, e35, 10.1093/nar/gkq1287 · DOI
  41. Zhang, 2008, Model-based analysis of ChIP-Seq (MACS), Genome Biol., 9, R137, 10.1186/gb-2008-9-9-r137 · DOI · Paper page
  42. Zhang, 2016, Isoform Switch of TET1 Regulates DNA Demethylation and Mouse Development, Mol. Cell, 64, 1062, 10.1016/j.molcel.2016.10.030 · DOI

Cited by

Metadata

Authors
Ravichandran, M., Lei, R., Tang, Q., Zhao, Y., Lee, J., Ma, L., Chrysanthou, S., Lorton, B. M., Cvekl, A., Shechter, D., Zheng, D., & Dawlaty, M. M.
Venue
Cell Reports
Publisher
Elsevier BV
Published
2019-08
Volume
28
Issue
8
Pages
1993-2003.e5
ISSN
2211-1247
Cited by
23
References
2
Language
en
Funders
  • Albert Einstein College of Medicine, Yeshiva University
  • New York State Department of Health
  • National Institutes of Health

About these checks

Registry, retraction, Cites and statistics results are computed, not judged, with one exception: a printed reference that no index lists is read once by a model before it counts as a citation error. Claims are extracted by a model and kept only when their quote appears verbatim in the text; each cited source is then checked, with a model’s help, for whether it says what the claim relies on. Those verdicts can be wrong — read the claim’s quote and the cited source before relying on one.

Statistics and arithmetic are recomputed, not judged.

Confidence bands are shown only for fields calibrated on our annotated test set. None is calibrated yet, so no band is shown.

What counts as a claim ›How we measure confidence ›How we check this ›

Are you an author, or do you see a problem with this page? Request a review