

The DOI matches its Crossref record; 109 of the 109 references it cites were found in a registry or an index.
Tau oligomer induced HMGB1 release contributes to cellular senescence and neuropathology linked to Alzheimer’s disease and frontotemporal dementia
Open accessAbstract
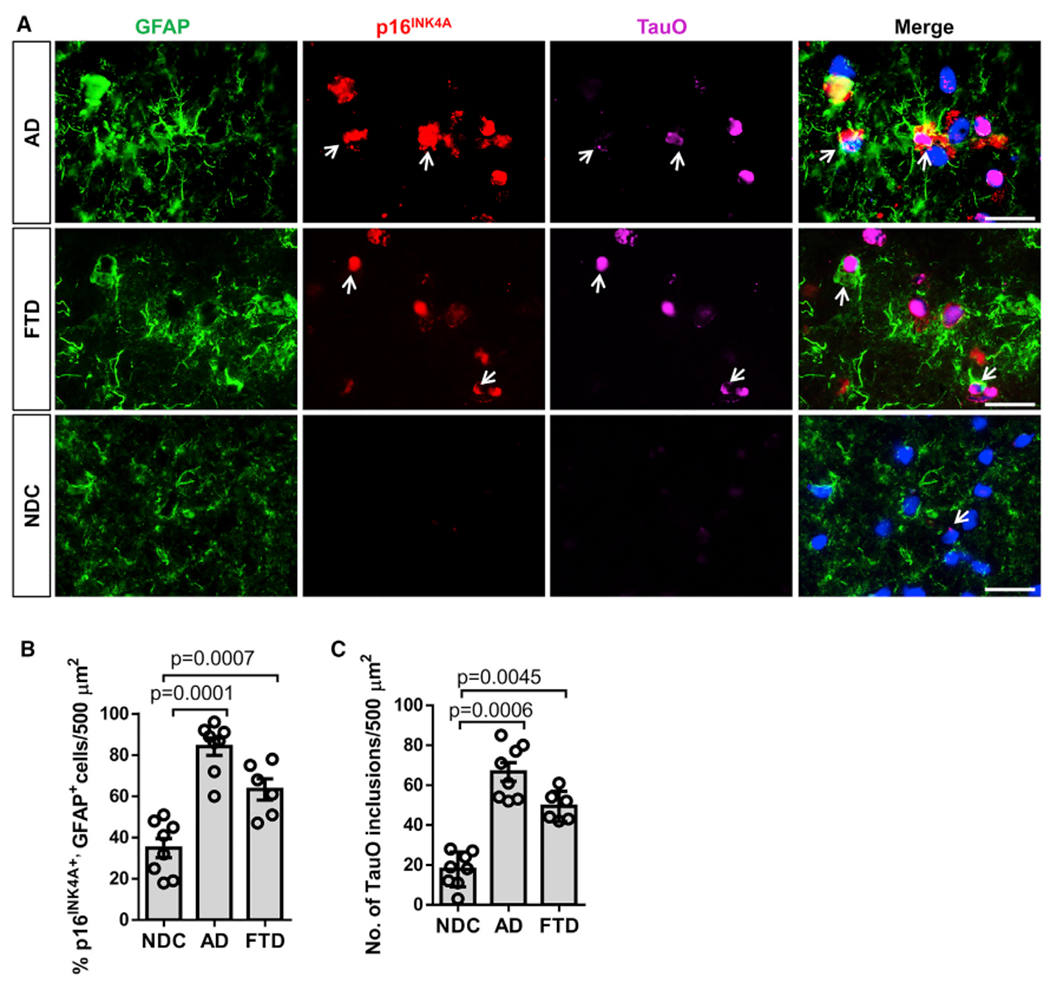
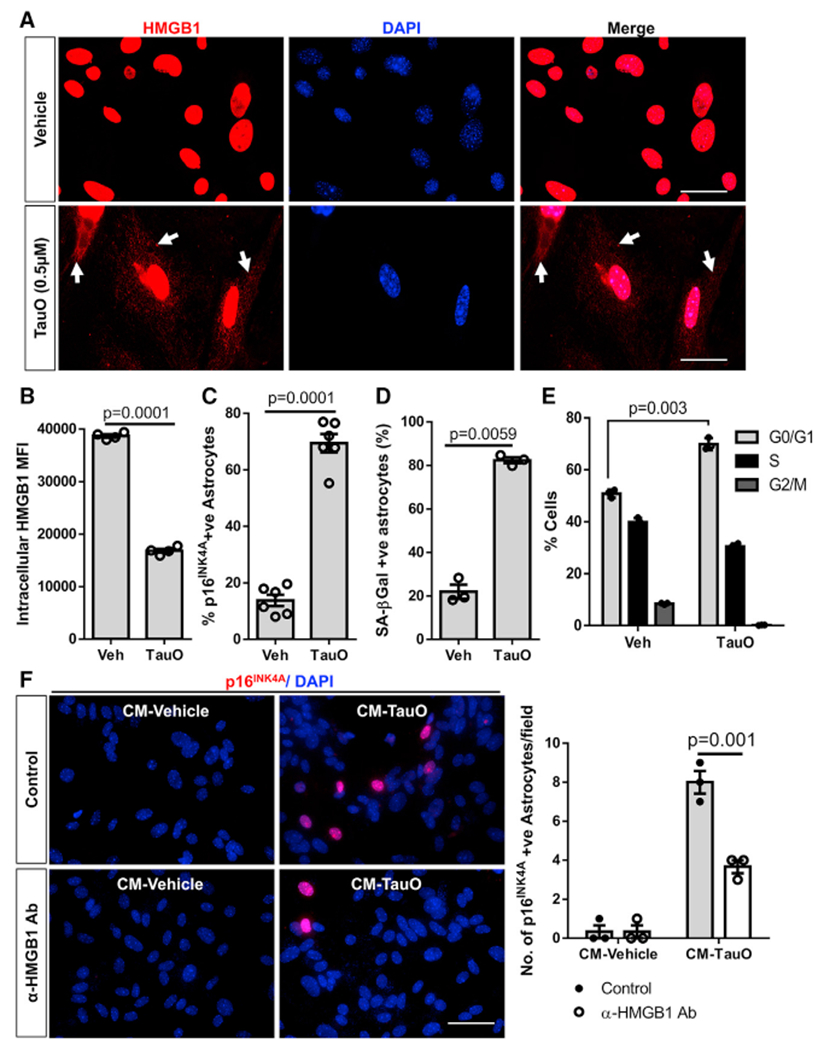
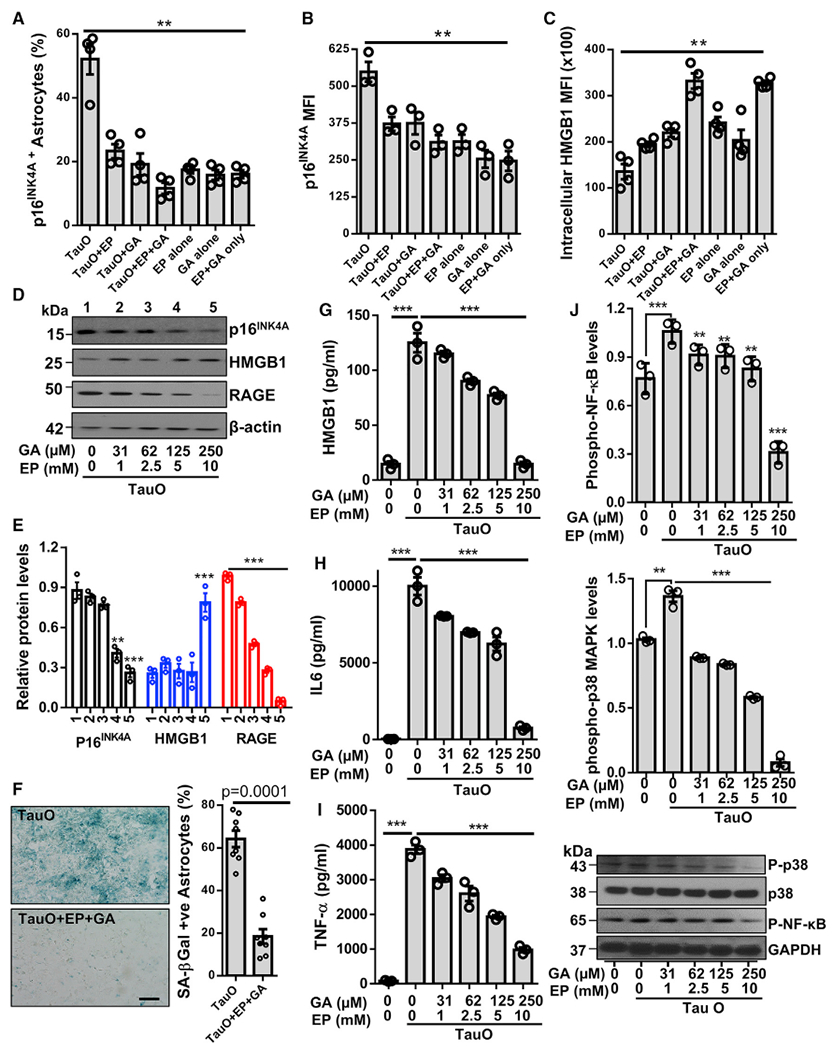
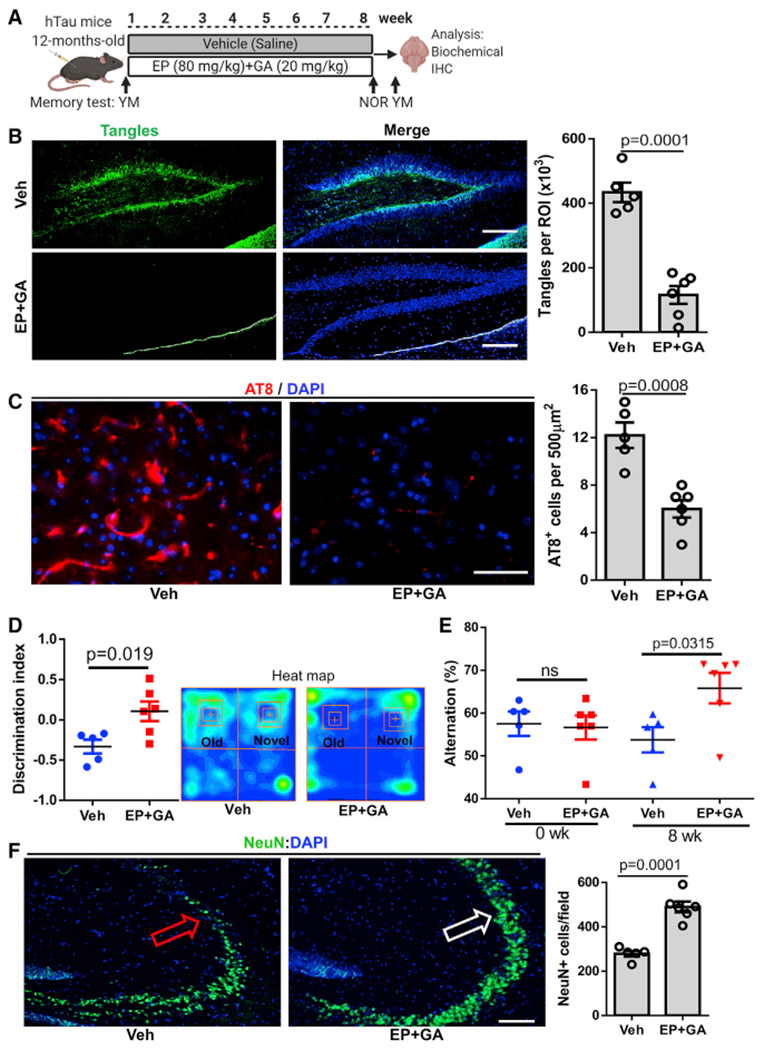
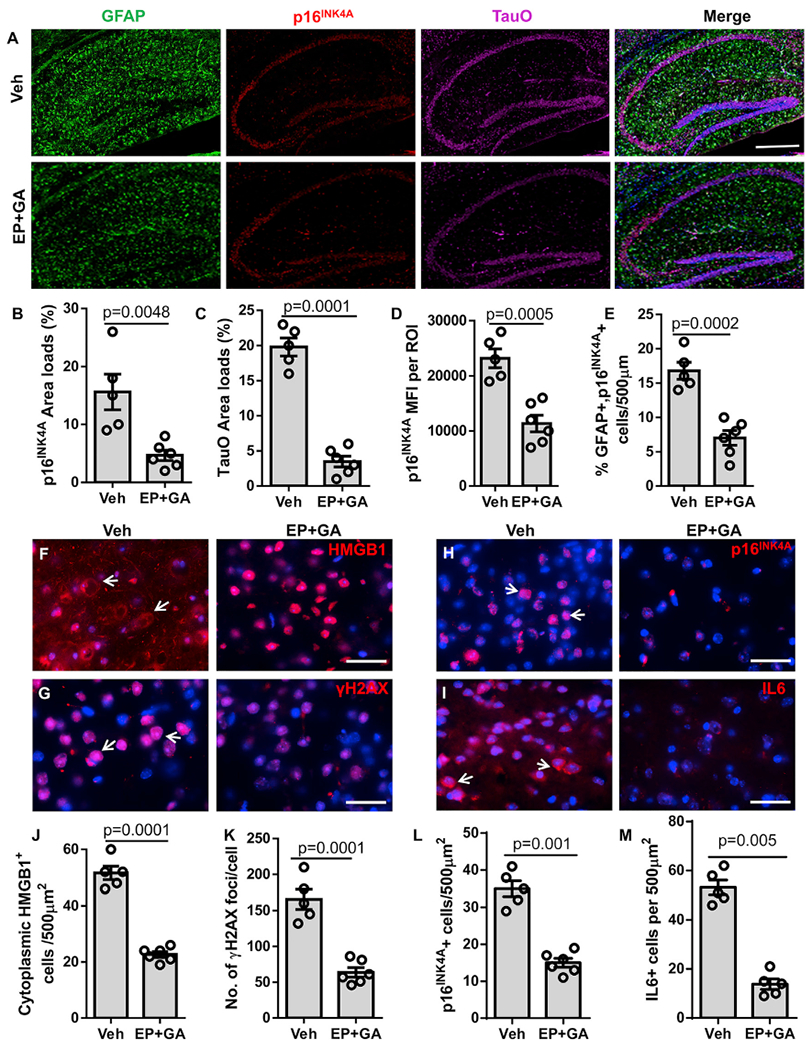
Aging, pathological tau oligomers (TauO), and chronic inflammation in the brain play a central role in tauopathies, including Alzheimer's disease (AD) and frontotemporal dementia (FTD). However, the underlying mechanism of TauO-induced aging-related neuroinflammation remains unclear. Here, we show that TauO-associated astrocytes display a senescence-like phenotype in the brains of patients with AD and FTD. TauO exposure triggers astrocyte senescence through high mobility group box 1 (HMGB1) release and inflammatory senescence-associated secretory phenotype (SASP), which mediates paracrine senescence in adjacent cells. HMGB1 release inhibition using ethyl pyruvate (EP) and glycyrrhizic acid (GA) prevents TauO-induced senescence through inhibition of p38-mitogen-activated protein kinase (MAPK) and nuclear factor κB (NF-κB)-the essential signaling pathways for SASP development. Despite the developed tauopathy in 12-month-old hTau mice, EP+GA treatment significantly decreases TauO and senescent cell loads in the brain, reduces neuroinflammation, and thus ameliorates cognitive functions. Collectively, TauO-induced HMGB1 release promotes cellular senescence and neuropathology, which could represent an important common pathomechanism in tauopathies including AD and FTD.
Overview
The claims and statistics of this paper haven’t been checked yet.
Run the check — free, no account needed. It reads the open-access text and checks the sources it cites.
Integrity signals
Registry
Cites
Statistics
Figures
Verification
Claims the paper makes
The claims and statistics of this paper haven’t been checked yet.
Run the check — free, no account needed. It reads the open-access text and checks the sources it cites.
Claims other papers make about this one
Each is checked against this paper’s own text: does it say what the citing paper says it does?
The check wasn’t confident either way, so it gives no verdict — never disputed.
In the citing paper
“Ast-AD revealed fewer GFAP-positive cells than S100B-positive ones, with low HMGB1 and IL-10 and elevated IL-6 and C/EBPα gene levels, already pointing to some altered properties [27,72,120].”
From Emerging Role of miR-21-5p in Neuron–Glia Dysregulation and Exosome Transfer Using Multiple Models of Alzheimer’s Disease (2022) · cites this paper as [120]
Experimental — accuracy not yet measuredIn the citing paper
“exposure to pathological protein aggregates such as Aβ and TauO triggers HMGB1 release, chronic inflammation, and upregulation of RAGE and TLR4 signaling pathways. 57”
From Senescence, brain inflammation, and oligomeric tau drive cognitive decline in Alzheimer's disease: Evidence from clinical and preclinical studies (2024) · cites this paper as [57]
In the citing paper
“we and others demonstrated that extracellular HMGB1 promotes paracrine senescence in neighboring cells and induces chronic tissue inflammation via the SASP, 56 , 57”
From Senescence, brain inflammation, and oligomeric tau drive cognitive decline in Alzheimer's disease: Evidence from clinical and preclinical studies (2024) · cites this paper as [57]
In the citing paper
“We reported that in postmortem brain tissue from AD patients, translocation of HMGB1 from the nucleus to the cytoplasm is a molecular signature of senescence and brain inflammation. 57”
From Senescence, brain inflammation, and oligomeric tau drive cognitive decline in Alzheimer's disease: Evidence from clinical and preclinical studies (2024) · cites this paper as [57]
In the citing paper
“Senolytic therapy has shown promising results in various animal models, including tauopathies.”
From Senescence, brain inflammation, and oligomeric tau drive cognitive decline in Alzheimer's disease: Evidence from clinical and preclinical studies (2024) · cites this paper as [57]
Self-check
Percentages, sums and reported differences re-computed from the paper’s own numbers.
The self-check needs the paper’s full text.
Citations
Cites
Preparation of separate astroglial and oligodendroglial cell cultures from rat cerebral tissue.
McCarthy, K. D., & de Vellis, J. (1980) · The Journal of Cell Biology · doi:10.1083/jcb.85.3.890 · Cited by 3,825
Adult Neurogenesis in the Mammalian Brain: Significant Answers and Significant Questions
Ming, G.-L., & Song, H. (2011) · Neuron · doi:10.1016/j.neuron.2011.05.001 · Cited by 2,651
High-mobility group box 1 protein (HMGB1): nuclear weapon in the immune arsenal
Lotze, M. T., & Tracey, K. J. (2005) · Nature reviews. Immunology · doi:10.1038/nri1594 · Cited by 2,490
Zhang, Y., Sloan, S. A., Clarke, L. E., Caneda, C., Plaza, C. A., Blumenthal, P. D., Vogel, H., Steinberg, G. K., Edwards, M. S. B., Li, G., et al. (2016) · Neuron · doi:10.1016/j.neuron.2015.11.013 · Cited by 2,295
Senolytics improve physical function and increase lifespan in old age
Xu, M., Pirtskhalava, T., Farr, J. N., Weigand, B. M., Palmer, A. K., Weivoda, M. M., Inman, C. L., Ogrodnik, M. B., Hachfeld, C. M., Fraser, D. G., et al. (2018) · Nature Medicine · doi:10.1038/s41591-018-0092-9 · Cited by 2,287
A complex secretory program orchestrated by the inflammasome controls paracrine senescence
Acosta, J. C., Banito, A., Wuestefeld, T., Georgilis, A., Janich, P., Morton, J. P., Athineos, D., Kang, T.-W., Lasitschka, F., Andrulis, M., et al. (2013) · Nature Cell Biology · doi:10.1038/ncb2784 · Cited by 2,278 · cited 1×
“Senescent cells are known to accumulate with age and contribute to chronic tissue inflammation and paracrine senescence through their persistent SASP secretion (Acosta et al., 2013).”
BackgroundPhase 3 Trials of Solanezumab for Mild-to-Moderate Alzheimer's Disease
Doody, R. S., Thomas, R. G., Farlow, M., Iwatsubo, T., Vellas, B., Joffe, S., Kieburtz, K., Raman, R., Sun, X., Aisen, P. S., et al. (2014) · New England Journal of Medicine · doi:10.1056/nejmoa1312889 · Cited by 1,668
Jeon, O. H., Kim, C., Laberge, R.-M., Demaria, M., Rathod, S., Vasserot, A. P., Chung, J. W., Kim, D. H., Poon, Y., David, N., et al. (2017) · Nature Medicine · doi:10.1038/nm.4324 · Cited by 1,515
NLRP3 inflammasome activation drives tau pathology
Ising, C., Venegas, C., Zhang, S., Scheiblich, H., Schmidt, S. V., Vieira-Saecker, A., Schwartz, S., Albasset, S., McManus, R. M., Tejera, D., et al. (2019) · Nature · doi:10.1038/s41586-019-1769-z · Cited by 1,487
Self-citationA proteomic atlas of senescence-associated secretomes for aging biomarker development
Basisty, N., Kale, A., Jeon, O. H., Kuehnemann, C., Payne, T., Rao, C., Holtz, A., Shah, S., Sharma, V., Ferrucci, L., et al. (2020) · PLOS Biology · doi:10.1371/journal.pbio.3000599 · Cited by 1,348
Cited by
Sorted by citations
Aging and aging-related diseases: from molecular mechanisms to interventions and treatments
Guo, J., Huang, X., Dou, L., Yan, M., Shen, T., Tang, W., & Li, J. (2022) · Signal Transduction and Targeted Therapy · doi:10.1038/s41392-022-01251-0 · Cited by 1,976
Alzheimer’s disease: insights into pathology, molecular mechanisms, and therapy
Zheng, Q., & Wang, X. (2024) · Protein & Cell · doi:10.1093/procel/pwae026 · Cited by 483
SenNet recommendations for detecting senescent cells in different tissues
Suryadevara, V., Hudgins, A. D., Rajesh, A., Pappalardo, A., Karpova, A., Dey, A. K., Hertzel, A., Agudelo, A., Rocha, A., Soygur, B., et al. (2024) · Nature Reviews Molecular Cell Biology · doi:10.1038/s41580-024-00738-8 · Cited by 408
“…cells have been used to validate the modulation of these markers and corresponding aged or diseased phenotypes 102–104, 109, Senescence profiles of brain ageing are found also in tissues affected by neurodegenerative pathologies such as Alzheimer disease and Parkinson disease 106,107,109–113 .”
The multifunctional protein HMGB1: 50 years of discovery
Tang, D., Kang, R., Zeh, H. J., & Lotze, M. T. (2023) · Nature reviews. Immunology · doi:10.1038/s41577-023-00894-6 · Cited by 405
Sengupta, U., & Kayed, R. (2022) · Progress in Neurobiology · doi:10.1016/j.pneurobio.2022.102270 · Cited by 318
Self-citationAging, Cellular Senescence, and Alzheimer’s Disease
Liu, R.-M. (2022) · International Journal of Molecular Sciences · doi:10.3390/ijms23041989 · Cited by 267
Cellular senescence at the crossroads of inflammation and Alzheimer's disease
Guerrero, A., De Strooper, B., & Arancibia-Cárcamo, I. L. (2021) · Trends in Neurosciences · doi:10.1016/j.tins.2021.06.007 · Cited by 236
Inflammation context in Alzheimer’s disease, a relationship intricate to define
Novoa, C., Salazar, P., Cisternas, P., Gherardelli, C., Vera-Salazar, R., Zolezzi, J. M., & Inestrosa, N. C. (2022) · Biological Research · doi:10.1186/s40659-022-00404-3 · Cited by 206
Lau, V. Z., Ramer, L. M., & Tremblay, M. (2023) · Nature Communications · doi:10.1038/s41467-023-37304-3 · Cited by 175
Reactive astrogliosis: A friend or foe in the pathogenesis of Alzheimer’s disease
Kumar, A., Fontana, I. C., & Nordberg, A. (2023) · Journal of Neurochemistry · doi:10.1111/jnc.15565 · Cited by 150
The interaction between ageing and Alzheimer's disease: insights from the hallmarks of ageing
Liu, Y., Tan, Y., Zhang, Z., Yi, M., Zhu, L., & Peng, W. (2024) · Translational Neurodegeneration · doi:10.1186/s40035-024-00397-x · Cited by 156
Jiang, S.-Y., Tian, T., Yao, H., Xia, X.-M., Wang, C., Cao, L., Hu, G., Du, R.-H., & Lu, M. (2023) · Cell Death & Differentiation · doi:10.1038/s41418-023-01216-y · Cited by 123
Gaikwad, S., Senapati, S., Haque, M. A., & Kayed, R. (2024) · Alzheimer's & Dementia · doi:10.1002/alz.13490 · Cited by 117
Self-citationThe role of cellular senescence in neurodegenerative diseases
Wang, Y., Kuča, K., Li, Y., Nepovimová, E., Heger, Z., Valko, M., Adam, V., Wu, Q., & Jomová, K. (2024) · Archives of Toxicology · doi:10.1007/s00204-024-03768-5 · Cited by 119
Function and inhibition of P38 MAP kinase signaling: Targeting multiple inflammation diseases
Wang, J., Liu, Y., Guo, Y., Liu, C., Yang, Y., Fan, X., Yang, H., Liu, Y., & Ma, T. (2023) · Biochemical Pharmacology · doi:10.1016/j.bcp.2023.115973 · Cited by 120
Matsudaira, T., Nakano, S., Konishi, Y., Kawamoto, S., Uemura, K., Kondo, T., Sakurai, K., Ozawa, T., Hikida, T., Komine, O., et al. (2023) · Communications Biology · doi:10.1038/s42003-023-05027-2 · Cited by 98
Tau interactome and RNA binding proteins in neurodegenerative diseases
Kavanagh, T., Halder, A., & Drummond, E. (2022) · Molecular Neurodegeneration · doi:10.1186/s13024-022-00572-6 · Cited by 111
Glucose metabolism, neural cell senescence and Alzheimer's disease
Wang, Q., Duan, L., Li, X., Wang, Y., Guo, W., Guan, F., & Ma, S. (2022) · International Journal of Molecular Sciences · doi:10.3390/ijms23084351 · Cited by 90
Influence of the Mediterranean Diet on Healthy Aging
Andreo-López, M. C., Contreras-Bolívar, V., Muñoz‐Torres, M., García-Fontana, B., & García‐Fontana, C. (2023) · International Journal of Molecular Sciences · doi:10.3390/ijms24054491 · Cited by 94
Glial fibrillary acidic protein in Alzheimer’s disease: a narrative review
Leipp, F., Vialaret, J., Mohaupt, P., Coppens, S., Jaffuel, A., Niehoff, A., Lehmann, S., & Hirtz, C. (2024) · Brain Communications · doi:10.1093/braincomms/fcae396 · Cited by 88
Cellular senescence in the aging brain: A promising target for neurodegenerative diseases
Sahu, M. R., Rani, L., Subba, R., & Mondal, A. C. (2022) · Mechanisms of Ageing and Development · doi:10.1016/j.mad.2022.111675 · Cited by 75
Wang, M., Tian, T., Zhou, H., Jiang, S., Jiao, Y., Zhu, Z., Xia, J., Ma, J., & Du, R. (2024) · Journal of Neuroinflammation · doi:10.1186/s12974-024-03072-0 · Cited by 79
The impact of neuroinflammation on neuronal integrity
Tastan, B., & Heneka, M. T. (2024) · Immunological Reviews · doi:10.1111/imr.13419 · Cited by 81
Cellular senescence in brain aging and cognitive decline
Shafqat, A., Khan, S., Omer, M. H., Niaz, M., Albalkhi, I., AlKattan, K. M., Yaqinuddin, A., Tchkonia, T., Kirkland, J. L., & Hashmi, S. K. (2023) · Frontiers in Aging Neuroscience · doi:10.3389/fnagi.2023.1281581 · Cited by 81
Targeting senescent cells with NKG2D-CAR T cells
Deng, Y., Kumar, A., Xie, K., Schaaf, K., Scifo, E., Morsy, S., Li, T., Ehninger, A., Bano, D., & Ehninger, D. (2024) · Cell Death Discovery · doi:10.1038/s41420-024-01976-7 · Cited by 75
Therapeutic targeting of senescent cells in the CNS
Riessland, M., Ximerakis, M., Jarjour, A. A., Zhang, B., & Orr, M. E. (2024) · Nature Reviews Drug Discovery · doi:10.1038/s41573-024-01033-z · Cited by 77
Cellular senescence in Alzheimer’s disease: from physiology to pathology
Zhu, J., Wu, C., & Yang, L. (2024) · Translational Neurodegeneration · doi:10.1186/s40035-024-00447-4 · Cited by 74
Ageing in the brain: mechanisms and rejuvenating strategies
Gaspar-Silva, F., Trigo, D., & Magalhães, J. (2023) · Cellular and Molecular Life Sciences · doi:10.1007/s00018-023-04832-6 · Cited by 88
The Role of Glial Cell Senescence in Alzheimer's Disease
Alshaebi, F., Sciortino, A., & Kayed, R. (2025) · Journal of Neurochemistry · doi:10.1111/jnc.70051 · Cited by 60
Self-citationWątroba, M., Grabowska, A. D., & Szukiewicz, D. (2023) · International Journal of Molecular Sciences · doi:10.3390/ijms241210069 · Cited by 65
DAMPs in immunosenescence and cancer
Chen, F., Tang, H., Cai, X., Lin, J., Kang, R., Tang, D., & Liu, J. (2024) · Seminars in Cancer Biology · doi:10.1016/j.semcancer.2024.09.005 · Cited by 60
Garcia, G., Pinto, S., Ferreira, S., Lopes, D., Serrador, M. J., Fernandes, A., Vaz, A. R., Mendonça, A. D., Edenhofer, F., Malm, T., et al. (2022) · Cells · doi:10.3390/cells11213377 · Cited by 55
“Ast-AD revealed fewer GFAP-positive cells than S100B-positive ones, with low HMGB1 and IL-10 and elevated IL-6 and C/EBPα gene levels, already pointing to some altered properties [27,72,120].”
BackgroundThe RAGE Axis: A Relevant Inflammatory Hub in Human Diseases
Armando Rojas, R., Lindner, C., Schneider, I., González, I., & Uribarri, J. (2024) · Biomolecules · doi:10.3390/biom14040412 · Cited by 61
The anti-inflammatory effects of saponins from natural herbs
Zheng, Q., Wang, T., Wang, S., Chen, Z. K., Xue, J., Yang, H. J., Chen, H., Sun, X., Wang, K., Zhang, L., et al. (2025) · Pharmacology & Therapeutics · doi:10.1016/j.pharmthera.2025.108827 · Cited by 55
Li, W., Chen, Q., Peng, C., Yang, D., Liu, S., Lv, Y., Jiang, L., Xu, S., & Li-hua, H. (2025) · International Journal of Molecular Sciences · doi:10.3390/ijms26010403 · Cited by 54
Zhang, C., Kan, X., Zhang, B., Ni, H., & Shao, J. (2022) · Molecular Brain · doi:10.1186/s13041-022-00969-w · Cited by 48
Richardson, M., & Richardson, D. R. (2023) · Molecular Pharmacology · doi:10.1124/molpharm.123.000803 · Cited by 48
Abdolmaleky, H. M., & Zhou, J. (2023) · Nutrients · doi:10.3390/nu15153456 · Cited by 47
Gaikwad, S., Puangmalai, N., Sonawane, M., Montalbano, M., Price, R., Iyer, M. S., Ray, A., Moreno, S., & Kayed, R. (2024) · Science Translational Medicine · doi:10.1126/scitranslmed.adj5958 · Cited by 46
Self-citationAging, cellular senescence and Parkinson's disease
Ma, Y., Erb, M. L., & Moore, D. J. (2025) · Journal of Parkinson s Disease · doi:10.1177/1877718x251316552 · Cited by 47
Biomarkers of ageing of humans and non-human primates
Wu, Z., Qu, J. T., Zhang, W., Bao, Z., Bi, Y., Cai, J.-P., Cai, S.-Q., Cao, C.-M., Cao, F., Cao, Z., et al. (2025) · Nature Reviews Molecular Cell Biology · doi:10.1038/s41580-025-00883-8 · Cited by 52
The role of high mobility group box 1 in neuroinflammatory related diseases
Mo, J., Hu, J., & Cheng, X. (2023) · Biomedicine & Pharmacotherapy · doi:10.1016/j.biopha.2023.114541 · Cited by 44
Cellular mechanisms in brain aging: Focus on physiological and pathological aging
Aguilar‐Hernández, L., Alejandre‐Aguilar, R., Morales‐Medina, J. C., Iannitti, T., & Flores, G. (2022) · Journal of Chemical Neuroanatomy · doi:10.1016/j.jchemneu.2022.102210 · Cited by 45
Cellular senescence and the blood–brain barrier: Implications for aging and age-related diseases
Knopp, R. C., Erickson, M. A., Rhea, E. M., Reed, M. J., & Banks, W. A. (2023) · Experimental Biology and Medicine · doi:10.1177/15353702231157917 · Cited by 47
Li, J., Wang, X., Yao, Z., Yuan, F., Liu, H., Sun, Z.-Y. J., Yuan, Z., Luo, G., Yao, X., 崔昊旻, et al. (2023) · Advanced Science · doi:10.1002/advs.202207383 · Cited by 46
Potential neurotoxic activity of diverse molecules released by astrocytes
Murray, T. E., Richards, C. M., Robert-Gostlin, V. N., Bernath, A. K., Lindhout, I. A., & Klegeris, A. (2022) · Brain Research Bulletin · doi:10.1016/j.brainresbull.2022.08.015 · Cited by 40
Bouvier, D. S., Fixemer, S., Heurtaux, T., Jeannelle, F., Frauenknecht, K. B. M., & Mittelbronn, M. G. A. (2022) · Frontiers in Physiology · doi:10.3389/fphys.2022.814889 · Cited by 43
Astroglial Hmgb1 regulates postnatal astrocyte morphogenesis and cerebrovascular maturation
Andrade, M. F., Comin, C. H., Dyken, P. C. V., Ouellette, J., Raman‐Nair, J., Blakeley, N., Liu, Q. Y., Leclerc, S., Pan, Y., Liu, Z., et al. (2023) · Nature Communications · doi:10.1038/s41467-023-40682-3 · Cited by 42
Jeong, J., Lee, D. H., & Song, J. (2022) · Biomedicine & Pharmacotherapy · doi:10.1016/j.biopha.2022.112933 · Cited by 40
Molecular Mechanisms of Cellular Senescence in Neurodegenerative Diseases
Lee, H.-J., Yoon, Y.-S., & Lee, S.-J. (2023) · Journal of Molecular Biology · doi:10.1016/j.jmb.2023.168114 · Cited by 36
Yang, R., Gao, Y., Li, H., Huang, W. C., Tu, D., Yang, M., Liu, X., Hong, J., & Gao, H. (2022) · Cell Reports · doi:10.1016/j.celrep.2022.111330 · Cited by 41
The Redox Protein High-Mobility Group Box 1 in Cell Death and Cancer
Chen, R., Zou, J., Kang, R., & Tang, D. (2023) · Antioxidants and Redox Signaling · doi:10.1089/ars.2023.0236 · Cited by 39
Aquaporin 4 is differentially increased and dislocated in association with tau and amyloid-beta
Kecheliev, V., Boss, L., Maheshwari, U., Konietzko, U., Keller, A., Razansky, D., Nitsch, R. M., Klohs, J., & Ni, R. (2023) · Life Sciences · doi:10.1016/j.lfs.2023.121593 · Cited by 36
Cellular senescence and neurodegeneration
Holloway, K., Neherin, K., Dam, K. U., & Zhang, H. (2023) · Human Genetics · doi:10.1007/s00439-023-02565-x · Cited by 40
Rouillard, M. E., Hu, J., Sutter, P. A., Kim, H. W., Huang, J. K., & Crocker, S. J. (2022) · Frontiers in Cellular Neuroscience · doi:10.3389/fncel.2022.833186 · Cited by 35
Elmaaboud, M. A. A., Estfanous, R. S., Atef, A., Kabel, A. M., Alnemari, K. A., Naguib, T. M., Alsufyani, S. E., Darwish, H. W., & Arab, H. H. (2023) · Pharmaceuticals · doi:10.3390/ph16101370 · Cited by 35
Senolytic treatment for low back pain
Mannarino, M., Cherif, H., Darband, S. G., Martinez, O. W., Sheng, K., Cousineau, E., Lee, S., Millecamps, M., Gao, C., Gilbert, A., et al. (2025) · Science Advances · doi:10.1126/sciadv.adr1719 · Cited by 33
Synaptic Disruption by Soluble Oligomers in Patients with Alzheimer’s and Parkinson’s Disease
Gutierrez, B. A., & Limón, A. (2022) · Biomedicines · doi:10.3390/biomedicines10071743 · Cited by 32
Bellelli, F., Angioni, D., Arosio, B., Vellas, B. J., & Barreto, P. D. S. (2025) · Ageing Research Reviews · doi:10.1016/j.arr.2025.102699 · Cited by 34
Autophagy and Cellular Senescence in Alzheimer's Disease: Key Drivers of Neurodegeneration
Hussain, M. S., Agrawal, N., Ilma, B., Rekha, M. M., Nayak, P. P., Kaur, M., Khachi, A., Goyal, K., Rekha, A., Gupta, S., et al. (2025) · CNS Neuroscience & Therapeutics · doi:10.1111/cns.70503 · Cited by 35
Jiang, Z., Wang, J., Qin, Y., Liu, S., Luo, B., Bai, F., Wei, H., Zhang, S., Wei, J., Ding, G., et al. (2024) · Alzheimer s Research & Therapy · doi:10.1186/s13195-024-01392-0 · Cited by 32
Reliable Hallmarks and Biomarkers of Senescent Lymphocytes
Сергеевна, М. Ю., Tereshchenko, V., Bogdanova, D. A., & Александрович, Р. С. (2023) · International Journal of Molecular Sciences · doi:10.3390/ijms242115653 · Cited by 28
Mitigation of perioperative neurocognitive disorders: A holistic approach
Safavynia, S. A., Goldstein, P. A., & Evered, L. A. (2022) · Frontiers in Aging Neuroscience · doi:10.3389/fnagi.2022.949148 · Cited by 44
Ruggieri, E., Domenico, E. D., Locatelli, A. G., Isopo, F., Damanti, S., LORENZO, R. D., Milan, E., Musco, G., Rovere, P. Q., Cenci, S., et al. (2024) · Ageing Research Reviews · doi:10.1016/j.arr.2024.102550 · Cited by 27
Wu, Z., Wang, Z., Xie, Z., Zhu, H., Li, C., Xie, S., Zhou, W., Zhang, Z., & Li, M. (2021) · World Neurosurgery · doi:10.1016/j.wneu.2021.11.085 · Cited by 27
Relationship among α‑synuclein, aging and inflammation in Parkinson's disease (Review)
Zhang, N., Yan, Z., Hua, X., Shao, S., Xue, S., Cespuglio, R., & Wang, S. (2023) · Experimental and Therapeutic Medicine · doi:10.3892/etm.2023.12311 · Cited by 27
ApoE4 expression disrupts tau uptake, trafficking, and clearance in astrocytes
Eisenbaum, M., Pearson, A., Ortiz, C., Mullan, M., Crawford, F., Ojo, J., & Bachmeier, C. (2024) · Glia · doi:10.1002/glia.24469 · Cited by 25
Hudson, H. R., Sun, X., & Orr, M. E. (2025) · Neurotherapeutics · doi:10.1016/j.neurot.2024.e00519 · Cited by 28
Ye, X., Shao, S., Wang, Y., & Su, W. (2023) · Journal of Chemical Neuroanatomy · doi:10.1016/j.jchemneu.2023.102346 · Cited by 25
Graves, S. I., Meyer, C. F., Jeganathan, K. B., & Baker, D. J. (2025) · Neuron · doi:10.1016/j.neuron.2025.04.020 · Cited by 26
Bagga, S., & Kumar, M. (2022) · Current Molecular Medicine · doi:10.2174/1566524022666220404112843 · Cited by 25
Mechanisms involved in the HMGB1 modulation of tumor multidrug resistance (Review)
Shao, L., Li, Z., Wang, M., Ning, Y., Chen, F.-Q., Gao, X.-Q., Yang, C.-T., Wang, H., & Liu, X. (2023) · International Journal of Molecular Medicine · doi:10.3892/ijmm.2023.5272 · Cited by 23
Targeting secretory autophagy in solid cancers: mechanisms, immune regulation and clinical insights
Li, X., & Zhao, H. (2025) · Experimental Hematology and Oncology · doi:10.1186/s40164-025-00603-0 · Cited by 25
What have we learned from past failures of investigational drugs for Alzheimer’s disease?
Imbimbo, B. P., & Watling, M. I. L. (2021) · Expert Opinion on Investigational Drugs · doi:10.1080/13543784.2021.2017881 · Cited by 24
Qu, W., Canoll, P., & Hargus, G. (2023) · Neuroscience · doi:10.1016/j.neuroscience.2022.05.006 · Cited by 24
Koutsodendris, N., Blumenfeld, J. R., Agrawal, A., Traglia, M., Yip, O., Rao, A. T., Kim, M. J., Nelson, M. R., Wang, Y.-H., Grone, B. P., et al. (2023) · Cell Reports · doi:10.1016/j.celrep.2023.113252 · Cited by 25
Tangavelou, K., & Bhaskar, K. (2024) · International Journal of Molecular Sciences · doi:10.3390/ijms252212335 · Cited by 25
HMGB1 in depression: An overview of microglial HMBG1 in the pathogenesis of depression
Huang, X., Wang, B., Yang, J., Lian, Y., Yu, H.-Z., & Wang, Y. (2023) · Brain Behavior & Immunity - Health · doi:10.1016/j.bbih.2023.100641 · Cited by 23
Iskandar, M., Barbero, M. X., Jaber, M. T., Chen, R., Gomez-Guevara, R., Cruz, E., & Westerheide, S. D. (2025) · Cancers · doi:10.3390/cancers17020257 · Cited by 30
Qian, B., Li, T., Zheng, Z.-X., Zhang, H., Xu, W., Mo, S.-M., Cui, J., Chen, W.-J., Lin, Y., & Lin, Z. (2024) · Journal of Hazardous Materials · doi:10.1016/j.jhazmat.2024.134466 · Cited by 20
The Role of Senescence-Associated Secretory Phenotype in Bone Loss
Zhu, R., Wan, H., Yang, H. S., Song, M., Chai, Y., & Yu, B. (2022) · Frontiers in Cell and Developmental Biology · doi:10.3389/fcell.2022.841612 · Cited by 21
Arenas, Y. M., & Felipo, V. (2023) · Molecular Neurobiology · doi:10.1007/s12035-023-03264-4 · Cited by 22
Defining and characterizing neuronal senescence, ‘neurescence’, as GX arrested cells
Hudson, H. R., Rießland, M., & Orr, M. E. (2024) · Trends in Neurosciences · doi:10.1016/j.tins.2024.09.006 · Cited by 21
Chen, Z., Mao, Z., Tang, W., Shi, Y., Liu, J., & You, Y. (2025) · Translational Neurodegeneration · doi:10.1186/s40035-025-00517-1 · Cited by 27
Senescent cells in the brain and where to find them
Rachmian, N., & Krizhanovsky, V. (2022) · FEBS Journal · doi:10.1111/febs.16649 · Cited by 18
Inflammasome links traumatic brain injury, chronic traumatic encephalopathy, and Alzheimer’s disease
Seplovich, G., Bouchi, Y., Vaccari, J. P. D. R., Pareja, J. C. M., Reisner, A., Blackwell, L. S., Mechref, Y. S., Wang, K., Tyndall, J. A., Tharakan, B., et al. (2024) · Neural Regeneration Research · doi:10.4103/nrr.nrr-d-24-00107 · Cited by 21
Tau proteins and senescent Cells: Targeting aging pathways in Alzheimer’s disease
Singh, M., Ali, H., Jyothi, S. R., Kaur, I., Kumar, S., Sharma, N., Prasad, G. V. S., Pramanik, A., Almalki, W. H., & Imran, M. (2024) · Brain Research · doi:10.1016/j.brainres.2024.149165 · Cited by 18
Post-translational modifications in sepsis-induced organ dysfunction: mechanisms and implications
Song, L., Jiang, W., Lin, H., Yu, J., Liu, K., & Zheng, R. (2024) · Frontiers in Immunology · doi:10.3389/fimmu.2024.1461051 · Cited by 19
DAMP signaling networks: from receptors to diverse pathophysiological functions
Chen, R., Zou, J., Zhong, X. Y., Liu, J., Kang, R., & Tang, D. (2025) · Journal of Advanced Research · doi:10.1016/j.jare.2025.07.047 · Cited by 26
Muthu, S. A., Sharma, R., Qureshi, A., Parvez, S., & Ahmad, B. (2022) · International Journal of Biological Macromolecules · doi:10.1016/j.ijbiomac.2022.12.166 · Cited by 17
Alzheimer's Disease and Aging Association: Identification and Validation of Related Genes
Liu, T., Hou, K., Li, J., Han, T., Liu, S., & Wei, J. (2023) · The Journal of Prevention of Alzheimer s Disease · doi:10.14283/jpad.2023.101 · Cited by 17
The effects of cGAS-STING inhibition in liver disease, kidney disease, and cellular senescence
Wang, L., Zhang, Z., Zhang, H., Zhou, M., Huang, C. Z., Xia, W., Li, J., & You, H. (2024) · Frontiers in Immunology · doi:10.3389/fimmu.2024.1346446 · Cited by 18
Jayaraman, S., Eswaran, A., Rajagopal, P., Palanisamy, C. P., Veerakumar, P., Veeraraghavan, V. P., & Sirasanagandla, S. R. (2026) · Biogerontology · doi:10.1007/s10522-026-10402-7 · Cited by 17
Zhao, G., Wang, X., Lei, H., Ruan, N., Yuan, B., Tang, S., Ni, N., Zuo, Z., Xun, L., Luo, M., et al. (2024) · International Immunopharmacology · doi:10.1016/j.intimp.2024.112886 · Cited by 16
Positron Emission Tomography in Animal Models of Tauopathies
Cao, L., Kong, Y., Ji, B., Ren, Y., Guan, Y., & Ni, R. (2022) · Frontiers in Aging Neuroscience · doi:10.3389/fnagi.2021.761913 · Cited by 14
Zeng, X., Sheng, Z., Zhang, Y., Xiao, J., Li, Y., Jiaping, Z., Xu, G., Jia, J., Wang, M., & Li, L. (2024) · European Journal of Pharmacology · doi:10.1016/j.ejphar.2024.177098 · Cited by 15
Zeng, Q., Tao, L., Liu, M., Guo, Y., Chen, H., Wu, Y., Wang, Z., Hu, Y., Liang, P., Zheng, Z., et al. (2025) · Nano Letters · doi:10.1021/acs.nanolett.4c05420 · Cited by 15
Lau, V. Z., Awogbindin, I. O., Frenkel, D., Whitehead, S. N., & Tremblay, M. (2025) · Alzheimer s & Dementia · doi:10.1002/alz.70363 · Cited by 16
Das, V., Miller, J. H., Goud, A. C., Annadurai, N., Sanctis, J. B. D., Hrubá, L., & Hajdúch, M. (2024) · Medicinal Research Reviews · doi:10.1002/med.22033 · Cited by 16
Duarte, L. F., Villalobos, V., Farías, M. A., Rangel-Ramírez, M. A., González-Madrid, E., Navarro, A. J., Carbone-Schellman, J., Domínguez, A., Álvarez, A., Riedel, C. A., et al. (2024) · Communications Biology · doi:10.1038/s42003-024-06486-x · Cited by 18
Metadata
- Authors
- Gaikwad, S., Puangmalai, N., Bittar, A., Montalbano, M., Garcia, S., McAllen, S., Bhatt, N., Sonawane, M., Sengupta, U., & Kayed, R.
- Affiliations
- The University of Texas Medical Branch at Galveston (US)
- Corresponding author
- Kayed, Rakez
- ORCID
- Venue
- Cell Reports
- Publisher
- Elsevier BV
- Published
- 2021-07
- Volume
- 36
- Issue
- 3
- Pages
- 109419
- ISSN
- 2211-1247 (ISSN-L)
- PMC
- PMC8341760
- OpenAlex
- W3186179545
- Cited by
- 234
- References
- 109
- Citations by year
- 2026: 49 · 2025: 55 · 2024: 52 · 2023: 43 · 2022: 28 · 2021: 6
- FWCI
- 20.24
- Type
- journal article
- Language
- en
- Open access
- gold
- doi.org
- Licence
- Locations
- Cell Reports (publishedVersion, cc-by-nc-nd)
- SSRN Electronic Journal (acceptedVersion)
- PubMed (publishedVersion)
- PubMed Central (acceptedVersion, cc-by-nc-nd)
- Funders
- National Institutes of Health (R01AG054025, R01AG060718, R01NS094557, RFA1AG055771)
- American Heart Association (17CSA33620007)
- Topics
- Life Sciences › Neuroscience › Cellular and Molecular Neuroscience › Alzheimer's disease research and treatments
- Life Sciences › Neuroscience › Neurology › Neuroinflammation and Neurodegeneration Mechanisms
- Life Sciences › Biochemistry, Genetics and Molecular Biology › Cell Biology › Telomeres, Telomerase, and Senescence
- Keywords
- tau oligomers, HMGB1 release, cellular senescence, astrocytes, senescence-associated secretory phenotype, neuroinflammation, Alzheimer's disease, frontotemporal dementia, tauopathy, p38 MAPK, NF-κB, ethyl pyruvate, glycyrrhizin, paracrine senescence, cognitive function
- MeSH terms
- Alzheimer Disease, Animals, Astrocytes, Brain, Cell Nucleus, Cells, Cultured, Cognition Disorders, Humans, Mice, Inbred C57BL, Mice, Transgenic, Phenotype, Pyruvates, tau Proteins, Cellular Senescence, Glycyrrhizic Acid, Protein Transport, HMGB1 Protein, Mice, Frontotemporal Dementia
About these checks
Registry, retraction, Cites and statistics results are computed, not judged, with one exception: a printed reference that no index lists is read once by a model before it counts as a citation error. Claims are extracted by a model and kept only when their quote appears verbatim in the text; each cited source is then checked, with a model’s help, for whether it says what the claim relies on. Those verdicts can be wrong — read the claim’s quote and the cited source before relying on one.
Statistics and arithmetic are recomputed, not judged.
Confidence bands are shown only for fields calibrated on our annotated test set. None is calibrated yet, so no band is shown.
What counts as a claim ›How we measure confidence ›How we check this ›
Are you an author, or do you see a problem with this page? Request a review
