

The DOI matches its Crossref record; 51 of the 53 references it cites were found in a registry or an index.
The Sedoheptulose Kinase CARKL Directs Macrophage Polarization through Control of Glucose Metabolism
Open accessAbstract
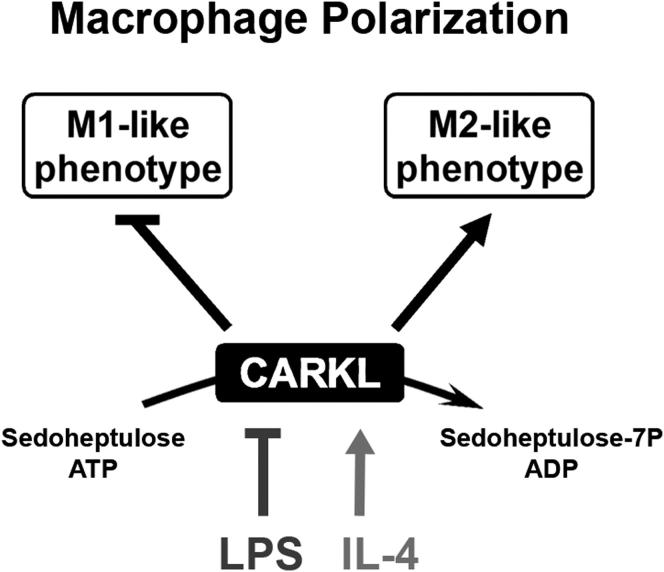
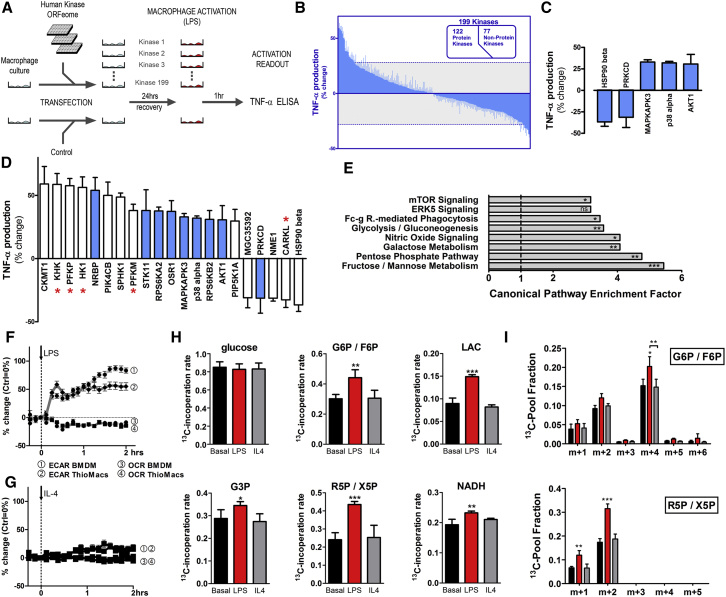
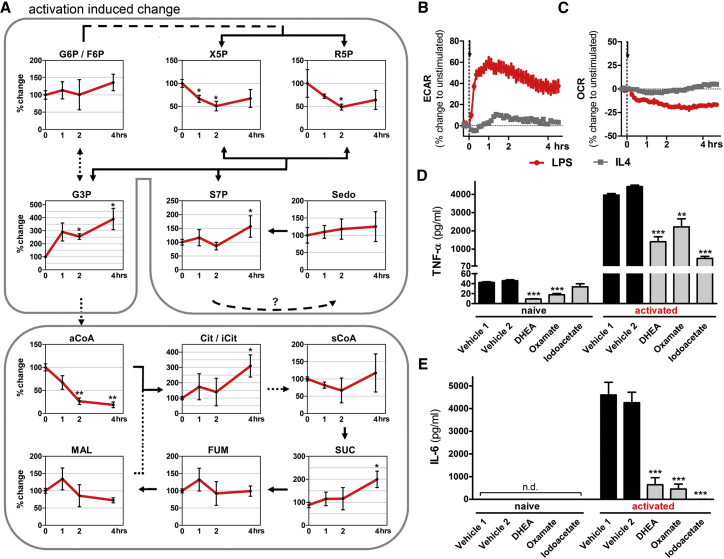
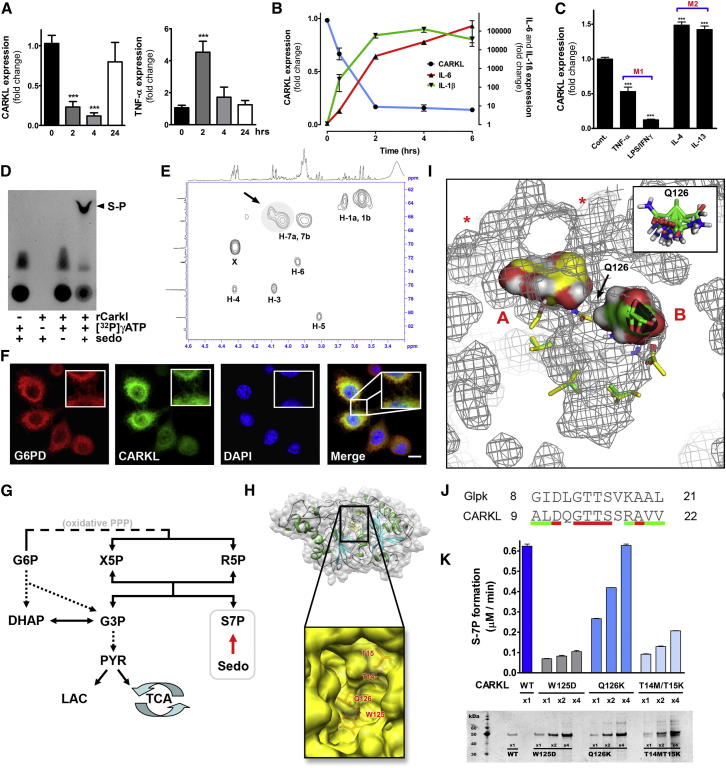
Immune cells are somewhat unique in that activation responses can alter quantitative phenotypes upwards of 100,000-fold. To date little is known about the metabolic adaptations necessary to mount such dramatic phenotypic shifts. Screening for novel regulators of macrophage activation, we found nonprotein kinases of glucose metabolism among the most enriched classes of candidate immune modulators. We find that one of these, the carbohydrate kinase-like protein CARKL, is rapidly downregulated in vitro and in vivo upon LPS stimulation in both mice and humans. Interestingly, CARKL catalyzes an orphan reaction in the pentose phosphate pathway, refocusing cellular metabolism to a high-redox state upon physiological or artificial downregulation. We find that CARKL-dependent metabolic reprogramming is required for proper M1- and M2-like macrophage polarization and uncover a rate-limiting requirement for appropriate glucose flux in macrophage polarization.
Overview
The claims and statistics of this paper haven’t been checked yet.
Run the check — free, no account needed. It reads the open-access text and checks the sources it cites.
Integrity signals
Registry
Cites
Statistics
Figures
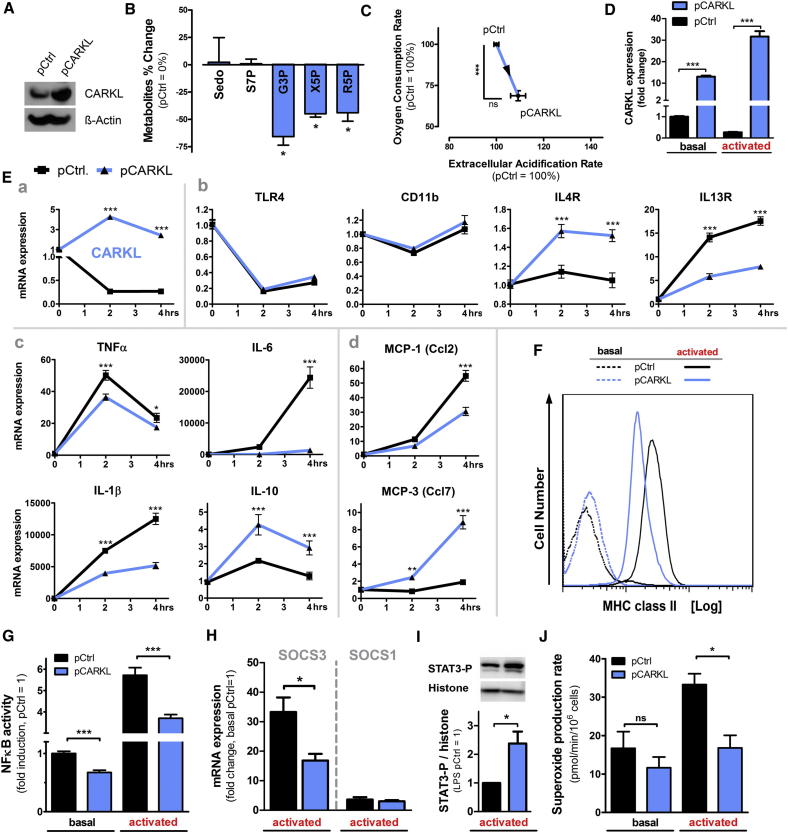
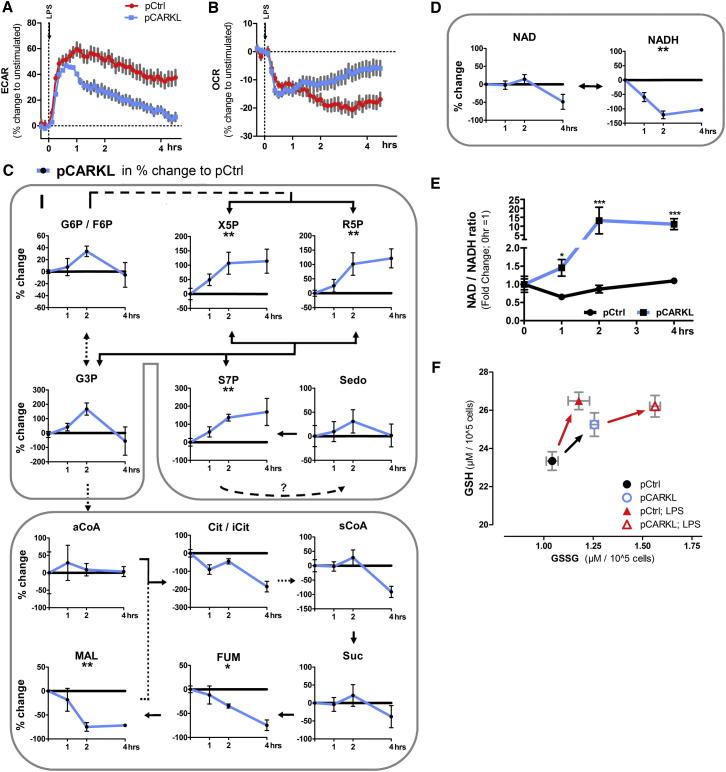
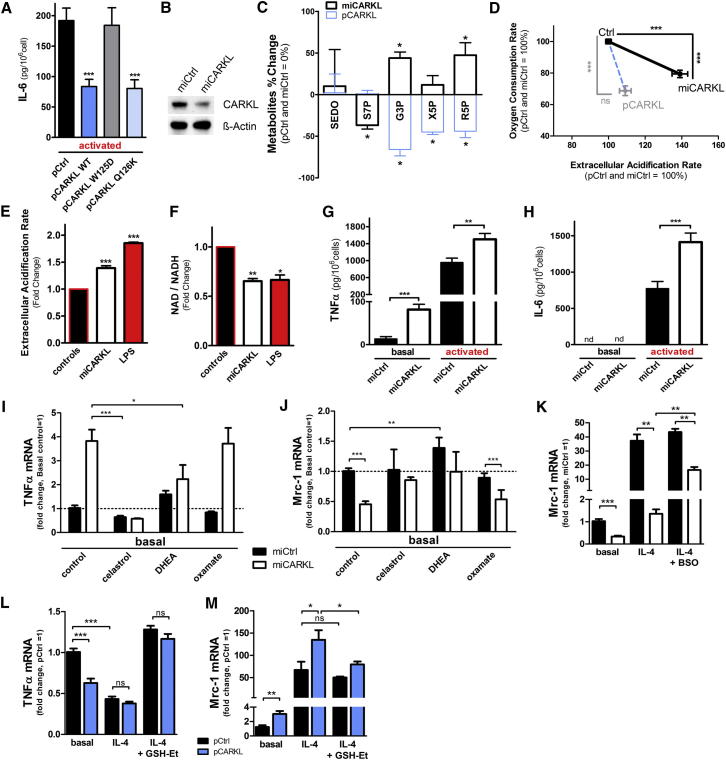
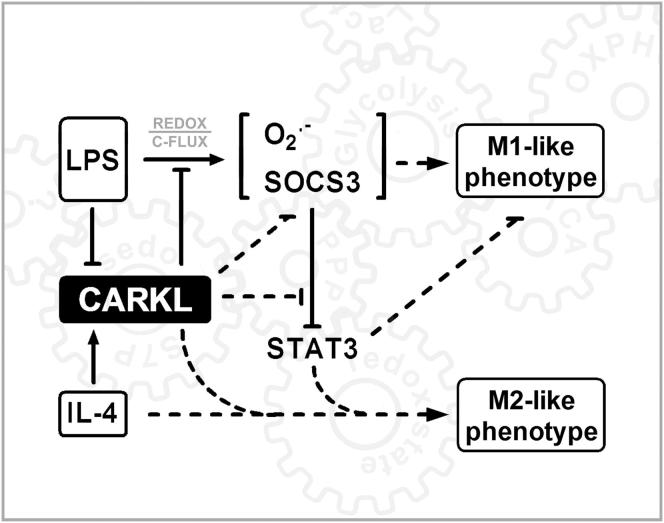
Verification
Claims the paper makes
The claims and statistics of this paper haven’t been checked yet.
Run the check — free, no account needed. It reads the open-access text and checks the sources it cites.
Claims other papers make about this one
Each is checked against this paper’s own text: does it say what the citing paper says it does?
In the citing paper
“TCR/CD28 stimulation of T cells (6), the stimulation of surface immunoglobulin on B cells (41), and TLR stimulation of macrophages and dendritic cells (DCs) (42, 43) all promote changes in aerobic glycolysis characteristic of the Warburg effect.”
From Fueling Immunity: Insights into Metabolism and Lymphocyte Function (2013) · cites this paper as [43]
Self-check
Percentages, sums and reported differences re-computed from the paper’s own numbers.
The self-check needs the paper’s full text.
Citations
Cites
Understanding the Warburg Effect: The Metabolic Requirements of Cell Proliferation
Vander Heiden, M. G., Cantley, L. C., & Thompson, C. B. (2009) · Science · doi:10.1126/science.1160809 · Cited by 16,197
Warburg, O. (1956) · Science · doi:10.1126/science.123.3191.309 · Cited by 13,425
Alternative activation of macrophages: mechanism and functions
Gordon, S., & Martinez, F. O. (2010) · Immunity · doi:10.1016/j.immuni.2010.05.007 · Cited by 4,197
Approaching the asymptote? Evolution and revolution in immunology.Preprint
Janeway, C. (1989) · Cold Spring Harbor Symposia on Quantitative Biology · doi:10.1101/sqb.1989.054.01.003 · Cited by 3,396
The Inflammasomes: Guardians of the Body
Martinon, F., Mayor, A., & Tschopp, J. (2009) · Annual Review of Immunology · doi:10.1146/annurev.immunol.021908.132715 · Cited by 2,436
Nathan, C., & Ding, A. (2010) · Cell · doi:10.1016/j.cell.2010.02.029 · Cited by 2,183
Inflammation 2010: New Adventures of an Old Flame
Medzhitov, R. M. (2010) · Cell · doi:10.1016/j.cell.2010.03.006 · Cited by 1,928
Shi, L. Z., Wang, R., Huang, G., Vogel, P., Neale, G., Green, D. R., & Chi, H. (2011) · Journal of Experimental Medicine · doi:10.1084/jem.20110278 · Cited by 1,803
SOCS proteins, cytokine signalling and immune regulation
Yoshimura, A., Naka, T., & Kubo, M. (2007) · Nature Reviews Immunology · doi:10.1038/nri2093 · Cited by 1,580
Toll-like receptor–induced changes in glycolytic metabolism regulate dendritic cell activation
Krawczyk, C. M., Holowka, T., Sun, J., Blagih, J., Amiel, E., DeBerardinis, R. J., Cross, J. R., Jung, E., Thompson, C. B., Jones, R. G., et al. (2010) · Blood · doi:10.1182/blood-2009-10-249540 · Cited by 1,246
Research works printed but not linked: 1
- Warburg, 1924, Ueber den Stoffwechsel der Tumoren, Biochem. Z., 152, 319
Cited by
Sorted by citations
Items 301–400 of 637
Gong, L., Liang, J., Xie, L., Zhang, Z., Mei, Z., & Zhang, W. (2024) · Current Neuropharmacology · doi:10.2174/1570159x22666240131121032 · Cited by 36
Macrophages in Atherosclerosis, First or Second Row Players?
Checkouri, É., Blanchard, V., & Meilhac, O. (2021) · Biomedicines · doi:10.3390/biomedicines9091214 · Cited by 39
The Pentose Phosphate Pathway: From Mechanisms to Implications for Gastrointestinal Cancers
Qiao, J., Yu, Z., Zhou, H., Wang, W., Wu, H., & Ye, J. (2025) · International Journal of Molecular Sciences · doi:10.3390/ijms26020610 · Cited by 32
The metabolic pathways utilized by Salmonella Typhimurium during infection of host cells
Thompson, A., Fulde, M., & Tedin, K. (2018) · Environmental Microbiology Reports · doi:10.1111/1758-2229.12628 · Cited by 33
Zhang, K., Hast, M. W., Izumi, S., Usami, Y., Shetye, S. S., Akabudike, N. M., Philp, N. J., Iwamoto, M., Nissim, I., Soslowsky, L. J., et al. (2018) · The American Journal of Sports Medicine · doi:10.1177/0363546518778789 · Cited by 32
The metabolic characteristic of decidual immune cells and their unique properties in pregnancy loss*
Zhang, T., Shen, H., Qin, X., & Li, M. (2022) · Immunological Reviews · doi:10.1111/imr.13085 · Cited by 33
The flux of energy in critical illness and the obesity paradox
Jaitovich, A., & Hall, J. B. (2025) · Physiological Reviews · doi:10.1152/physrev.00029.2024 · Cited by 34
Immuno-metabolic profile of human macrophages after Leishmania and Trypanosoma cruzi infection
Ty, M., Loke, P., Alberola, J., Rodrı́guez, A., & Rodríguez, A. (2019) · PLoS ONE · doi:10.1371/journal.pone.0225588 · Cited by 31
Effects of glycolysis on the polarization and function of tumor‑associated macrophages (Review)
Cao, J., Zeng, F., Liao, S., Cao, L., & Zhou, Y. (2023) · International Journal of Oncology · doi:10.3892/ijo.2023.5518 · Cited by 34
Schmidt, E. A., Fee, B. E., Henry, S. C., Nichols, A., Shinohara, M. L., Rathmell, J. C., MacIver, N. J., Coers, J., Ilkayeva, O., Koves, T. R., et al. (2017) · Journal of Biological Chemistry · doi:10.1074/jbc.m116.770735 · Cited by 30
Metabolic influence on the differentiation of suppressive myeloid cells in cancer
Porta, C., Marino, A., Consonni, F. M., Bleve, A., Mola, S., Storto, M., Riboldi, E., & Sica, A. (2018) · Carcinogenesis · doi:10.1093/carcin/bgy088 · Cited by 31
Metabolic Plasticity of Stem Cells and Macrophages in Cancer
Krstić, J., Trivanović, D. I., Jauković, A., Santibanez, J. F., & Bugarski, D. S. (2017) · Frontiers in Immunology · doi:10.3389/fimmu.2017.00939 · Cited by 31
Innate immune activation by checkpoint inhibition in human patient-derived lung cancer tissues
Fan, T. W. ‐., Higashi, R. M., Song, H., Daneshmandi, S., Mahan, A. L., Purdom, M. S., Bocklage, T. J., Pittman, T. A., He, D., Wang, C., et al. (2021) · eLife · doi:10.7554/elife.69578 · Cited by 29
Metabolic Reprogramming in Kidney Diseases: Evidence and Therapeutic Opportunities
Li, Y., Sha, Z., & Peng, H. (2021) · International Journal of Nephrology · doi:10.1155/2021/5497346 · Cited by 32
Exosomal miRNAs-mediated macrophage polarization and its potential clinical application
Yu, M. Y., Jia, H. J., Zhang, J., Ran, G., Liu, Y., & Yang, X. H. (2023) · International Immunopharmacology · doi:10.1016/j.intimp.2023.109905 · Cited by 32
AKT mediated glycolytic shift regulates autophagy in classically activated macrophages
Matta, S. K., & Kumar, D. (2015) · The International Journal of Biochemistry & Cell Biology · doi:10.1016/j.biocel.2015.07.010 · Cited by 29
Rapid glycolytic activation accompanying innate immune responses: mechanisms and function
Namgaladze, D., & Brüne, B. (2023) · Frontiers in Immunology · doi:10.3389/fimmu.2023.1180488 · Cited by 31
Kumar, M., Sharma, S., Kumar, J., Barik, S., & Mazumder, S. (2024) · Current Research in Immunology · doi:10.1016/j.crimmu.2024.100077 · Cited by 28
Immunologic role of macrophages in sepsis-induced acute liver injury
Xu, W., Hou, H., Yang, W., Tang, W., & Sun, L. (2024) · International Immunopharmacology · doi:10.1016/j.intimp.2024.113492 · Cited by 32
Macrophages as Key Players during Adipose Tissue–Liver Crosstalk in Nonalcoholic Fatty Liver Disease
Korf, H., Boesch, M., Meelberghs, L., & der Merwe, V. (2019) · Seminars in Liver Disease · doi:10.1055/s-0039-1687851 · Cited by 29
Mechanisms of photobiomodulation in the brain
Hamblin, M. R. (2019) · Elsevier eBooks · doi:10.1016/b978-0-12-815305-5.00008-7 · Cited by 29
Wang, Z., Zhao, Q., Nie, Y., Yu, Y., Misra, B. B., Zabalawi, M., Chou, J. W., Key, C.-C. C., Molina, A. J. A., Quinn, M. A., et al. (2020) · iScience · doi:10.1016/j.isci.2020.101125 · Cited by 28
Ferreira, B. L., Sousa, M. B., Leite, G. G. F., Brunialti, M. K. C., Nishiduka, E. S., Tashima, A. K., van der Poll, T., & Salomão, R. (2022) · Frontiers in Immunology · doi:10.3389/fimmu.2022.1051514 · Cited by 29
Wang, A., Li, Q., Sun, Z., Zhang, D., & Ma, X. (2023) · The Journal of Nutritional Biochemistry · doi:10.1016/j.jnutbio.2023.109370 · Cited by 30
Molecular detection of inflammation in cell models using hyperpolarized 13C-pyruvate
Sriram, R., Nguyen, J., Santos, J. D., Nguyen, L., Sun, J., Vigneron, S. F., Criekinge, M. V., Kurhanewicz, J. V., & MacKenzie, J. D. (2018) · Theranostics · doi:10.7150/thno.24322 · Cited by 29
Glycolytic side pathways regulating macrophage inflammatory phenotypes and functions
Dionísio, F., Tomas, L., & Schulz, C. (2023) · American Journal of Physiology-Cell Physiology · doi:10.1152/ajpcell.00276.2022 · Cited by 30
Pastore, M., Lori, G., Gentilini, A., Taddei, M. L., Maira, G. D., Campani, C., Recalcati, S., Invernizzi, P., Marra, F., & Raggi, C. (2020) · Cells · doi:10.3390/cells9030596 · Cited by 28
Metabolic regulation of immune cells in proinflammatory microenvironments and diseases during ageing
Li, P., Zhang, R., Cheng, L., Liu, J., & Chen, H. (2020) · Ageing Research Reviews · doi:10.1016/j.arr.2020.101165 · Cited by 29
Selenium-dependent metabolic reprogramming during inflammation and resolution
Korwar, A. M., Hossain, A., Lee, T.-J., Shay, A. E., Basrur, V., Conlon, K. P., Smith, P. B. W., Carlson, B. A., Salis, H. M., Patterson, A. D., et al. (2021) · Journal of Biological Chemistry · doi:10.1016/j.jbc.2021.100410 · Cited by 28
Decano, J. L., & Aikawa, M. (2018) · Frontiers in Cardiovascular Medicine · doi:10.3389/fcvm.2018.00097 · Cited by 29
Immmunometabolism of systemic lupus erythematosus
Furment, M. M., & Perl, A. (2024) · Clinical Immunology · doi:10.1016/j.clim.2024.109939 · Cited by 28
Bánki, K., & Perl, A. (2025) · Autoimmunity Reviews · doi:10.1016/j.autrev.2025.103781 · Cited by 27
Eger, M., Hussen, J., Koy, M., Dänicke, S., Schuberth, H., & Breves, G. (2015) · Journal of Dairy Science · doi:10.3168/jds.2015-10435 · Cited by 27
Lactate – A new frontier in the immunology and therapy of prostate cancer
Nenu, I., Gafencu, G., Popescu, T., & Kacsó, G. (2017) · Journal of Cancer Research and Therapeutics · doi:10.4103/0973-1482.163692 · Cited by 28
An association between mitochondria and microglia effector function: what do we think we know?
Harry, G. J., Childers, G. M., Giridharan, S., & Hernandes, I. L. (2020) · Neuroimmunology and Neuroinflammation · doi:10.20517/2347-8659.2020.07 · Cited by 27
Yang, Y., Zhan, X., Zhang, C., Shi, J., Wu, J., Deng, X., Xing, X., Cheng, A., Yu, H., Wang, Y.-N., et al. (2023) · Clinical Immunology · doi:10.1016/j.clim.2023.109279 · Cited by 27
Cardiac fibrogenesis: an immuno-metabolic perspective
Hoque, M. M., Gbadegoye, J. O., Hassan, F. O., Raafat, A., & Lebeche, D. (2024) · Frontiers in Physiology · doi:10.3389/fphys.2024.1336551 · Cited by 30
Cellular metabolism changes in atherosclerosis and the impact of comorbidities
Dai, Y., Junho, C. V. C., Schieren, L., Wollenhaupt, J., Sluimer, J. C., van der Vorst, E. P. C., & Noels, H. (2024) · Frontiers in Cell and Developmental Biology · doi:10.3389/fcell.2024.1446964 · Cited by 27
Li, Q., Cui, H., Yang, Y.-J., Li, X., Chen, G.-H., Tian, X., Jin, C., Dong, Q., Huang, P., & Xu, J. (2017) · Cellular Physiology and Biochemistry · doi:10.1159/000470806 · Cited by 26
Zhu, B., Guo, X., Xu, H., Jiang, B., Li, H., Wang, Y., Yin, Q., Zhou, T., Cai, J. J., Glaser, S. S., et al. (2021) · Laboratory Investigation · doi:10.1038/s41374-020-00523-z · Cited by 26
Macrophage metabolic regulation in atherosclerotic plaque
Dolfi, B., Gallerand, A., Haschemi, A., Guinamard, R., & Ivanov, S. (2021) · Atherosclerosis · doi:10.1016/j.atherosclerosis.2021.08.010 · Cited by 29
Self-citationFan, C., Li, J., Li, Y., Jin, Y., Feng, J., Guo, R., Meng, X., Gong, D., Chen, Q., Du, F., et al. (2023) · Clinical & Translational Immunology · doi:10.1002/cti2.1447 · Cited by 26
Lu, C., Cheng, R., Zhang, Q., Hu, Y., Pu, Y., Wen, J., Zhong, Y., Tang, Z., Wu, L., Wei, S., et al. (2023) · International Immunopharmacology · doi:10.1016/j.intimp.2023.111175 · Cited by 26
Ai, Q., Lin, X., Xie, H., Li, B., Liao, M., & Fan, H. (2021) · Viruses · doi:10.3390/v13071236 · Cited by 25
Hcn1 Is a Tremorgenic Genetic Component in a Rat Model of Essential Tremor
Ohno, Y., Shimizu, S., Tatara, A., Imaoku, T., Ishii, T. M., Sasa, M., Serikawa, T., & Kuramoto, T. (2015) · PLoS ONE · doi:10.1371/journal.pone.0123529 · Cited by 25
Pathophysiological Integration of Metabolic Reprogramming in Breast Cancer
Corchado‐Cobos, R., García‐Sancha, N., Mendiburu‐Eliçabe, M., Gómez-Vecino, A., Jiménez‐Navas, A., Pérez‐Baena, M. J., Holgado-Madruga, M., Mao, J., Cañueto, J., Castillo‐Lluva, S., et al. (2022) · Cancers · doi:10.3390/cancers14020322 · Cited by 27
Sedoheptulose kinase regulates cellular carbohydrate metabolism by sedoheptulose 7-phosphate supply
Nagy, C., & Haschemi, A. (2013) · Biochemical Society Transactions · doi:10.1042/bst20120354 · Cited by 25
Self-citation11β-HSD1 reduces metabolic efficacy and adiponectin synthesis in hypertrophic adipocytes
Koh, E. H., Kim, A., Kim, H., Kim, J. H., Park, H., Ko, M. S., Kim, M., Kim, H.-J., Kim, B. J., Yoo, H. J., et al. (2015) · Journal of Endocrinology · doi:10.1530/joe-15-0117 · Cited by 23
Biology of macrophage fate decision: Implication in inflammatory disorders
Yadav, S., Dwivedi, A., & Tripathi, A. (2022) · Cell Biology International · doi:10.1002/cbin.11854 · Cited by 26
Chou, C., Mohanty, S., Kang, H. A., Kong, L., Ávila-Pacheco, J., Joshi, S. R., Ueda, I., Devine, L., Raddassi, K., Pierce, K. A., et al. (2022) · Aging Cell · doi:10.1111/acel.13682 · Cited by 23
Liang, Y., He, J., Chen, X., Yin, L., Yuan, Q., Zeng, Q., Zu, X., & Shen, Y. (2023) · International Journal of Biological Sciences · doi:10.7150/ijbs.86039 · Cited by 28
Disparate macrophage responses are linked to infection outcome of Hantan virus in humans or rodents
Ma, H., Yang, Y., Nie, T., Yan, R., Si, Y., Wei, J., Li, M., Liu, H., Ye, W., Zhang, H., et al. (2024) · Nature Communications · doi:10.1038/s41467-024-44687-4 · Cited by 22
Metabolic reprogramming: a new option for the treatment of spinal cord injury
Chen, J., Chen, J., Yu, C., Xia, K., Yang, B., Wang, R., Li, Y., Shi, K., Zhang, Y., Xu, H., et al. (2024) · Neural Regeneration Research · doi:10.4103/nrr.nrr-d-23-01604 · Cited by 25
Lu, Z., Li, X., Yang, P., Mu, G., He, L., Chunmei, S., & Xu, F. (2020) · Inflammation · doi:10.1007/s10753-020-01263-4 · Cited by 23
Wang, H., Xu, P., Yin, K., & Wang, S. (2025) · Frontiers in Immunology · doi:10.3389/fimmu.2025.1521196 · Cited by 22
Alqarni, A. M., Dissanayake, T., Nelson, D. J., Parkinson, J. A., Dufton, M. J., Ferro, V. A., & Watson, D. G. (2019) · Vaccines · doi:10.3390/vaccines7040142 · Cited by 21
Meta-analysis of 308-nm excimer laser therapy for alopecia areata
Gupta, A. K., & Carviel, J. (2019) · Journal of Dermatological Treatment · doi:10.1080/09546634.2019.1687819 · Cited by 22
Ernst, O., Sun, J., Lin, B., Banoth, B., Dorrington, M. G., Liang, J. J., Schwarz, B. H., Stromberg, K. A., Katz, S., Vayttaden, S. J., et al. (2021) · Science Signaling · doi:10.1126/scisignal.abe0387 · Cited by 20
Unconventional animal models: a booster for new advances in host—pathogen interactions
Conti, F., Abnave, P., & Ghigo, É. (2014) · Frontiers in Cellular and Infection Microbiology · doi:10.3389/fcimb.2014.00142 · Cited by 22
Lajqi, T., Marx, C., Hudalla, H., Haas, F., Größe, S., Wang, Z., Heller, R., Bauer, M. W., Wetzker, R., & Bauer, R. (2021) · International Journal of Molecular Sciences · doi:10.3390/ijms22052578 · Cited by 22
Contribution of Mitochondrial DNA Variation to Chronic Disease in East Asian Populations
Sun, D., Wei, Y., Zheng, H.-X., Jin, L., & Wang, J. (2019) · Frontiers in Molecular Biosciences · doi:10.3389/fmolb.2019.00128 · Cited by 21
Okuyama, N., Matsuda, S., Yamashita, A., Moriguchi‐Goto, S., Sameshima, N., Iwakiri, T., Matsuura, Y., Sato, Y. Z., & Asada, Y. (2015) · Circulation Journal · doi:10.1253/circj.cj-15-0394 · Cited by 21
Meoli, L., Gupta, N., Saeidi, N., Panciotti, C., Biddinger, S. B., Corey, K. E., & Stylopoulos, N. (2018) · American Journal of Physiology-Endocrinology and Metabolism · doi:10.1152/ajpendo.00296.2017 · Cited by 21
Zhang, R., Ji, J., Blaženović, I., Pi, F., Wang, T., Zhang, Y., & Sun, X. (2018) · Toxins · doi:10.3390/toxins10110441 · Cited by 23
Yang, Y., Zhang, H., Komasa, S., MORIMOTO, Y., Sekino, T., Kawazoe, T., & Okazaki, J. (2021) · Materials Science and Engineering C · doi:10.1016/j.msec.2021.112377 · Cited by 23
Inflammation and mitochondria in the pathogenesis of chronic Chagas disease cardiomyopathy
Nunes, J. P. S., Roda, V. M. D. P., Andrieux, P., Kalil, J. E., Chevillard, C., & Cunha‐Neto, E. (2023) · Experimental Biology and Medicine · doi:10.1177/15353702231220658 · Cited by 22
Immunometabolic Regulation of Bacterial Infection, Biofilms, and Antibiotic Susceptibility
Chen, Y.-T., Lohia, G. K., Chen, S., & Riquelme, S. A. (2024) · Journal of Innate Immunity · doi:10.1159/000536649 · Cited by 23
Liao, W., Hung, C., Liang, S., Yu, S., Lu, J., Lee, C., Chai, C., & Yu, H. (2021) · Journal of Investigative Dermatology · doi:10.1016/j.jid.2020.11.035 · Cited by 21
The crucial role of metabolic reprogramming in driving macrophage conversion in kidney disease
Gong, N., Wang, W., Fu, Y., Zheng, X., Guo, X., Chen, Y., Chen, Y., Zheng, S., & Cai, G. (2025) · Cellular & Molecular Biology Letters · doi:10.1186/s11658-025-00746-2 · Cited by 20
TNFα-induced metabolic reprogramming drives an intrinsic anti-viral state
Ciesla, J. H., Moreno, I., & Munger, J. C. (2022) · PLoS Pathogens · doi:10.1371/journal.ppat.1010722 · Cited by 25
Fan, T. W. ‐., Daneshmandi, S., Cassel, T., Uddin, M. B., Sledziona, J., Thompson, P. T., Lin, P., Higashi, R. M., & Lane, A. N. (2022) · The Journal of Immunology · doi:10.4049/jimmunol.2200178 · Cited by 20
Sun, X., Yao, Z., Chen, L., Huang, J., & Dong, S. (2023) · Fundamental and Clinical Pharmacology · doi:10.1111/fcp.12928 · Cited by 20
Metabolism in Immune Cell Differentiation and Function
Chapman, N. M., Shrestha, S., & Chi, H. (2017) · Advances in experimental medicine and biology · doi:10.1007/978-94-024-1170-6_1 · Cited by 22
Metabolic Reprogramming of Macrophages in Atherosclerosis: Is It All about Cholesterol?
Yvan‐Charvet, L., & Ivanov, S. (2020) · Journal of Lipid and Atherosclerosis · doi:10.12997/jla.2020.9.2.231 · Cited by 19
Melis, M. J., Khpal, M., Peters, V. B. M., & Singer, M. (2023) · Clinical Science · doi:10.1042/cs20220709 · Cited by 24
Sun, L., Zhou, F., Shao, Y., Lv, Z., & Li, C. (2020) · Developmental & Comparative Immunology · doi:10.1016/j.dci.2020.103694 · Cited by 19
Elebo, N., Fru, P., Omoshoro–Jones, J., Candy, G. P., & Nweke, E. E. (2020) · Molecular Medicine Reports · doi:10.3892/mmr.2020.11622 · Cited by 19
Behrangi, E., Roohaninasab, M., Sadeghzadeh‐Bazargan, A., Nobari, N. N., Ghassemi, M., Seirafianpour, F., Goodarzi, A., & Dodangeh, M. (2021) · Journal of Cosmetic Dermatology · doi:10.1111/jocd.14480 · Cited by 19
Macrophage polarization and metabolic reprogramming in abdominal aortic aneurysm
Hou, N., Zhou, H., Li, J., Xiong, X., Deng, H., & Xiong, S. (2024) · Immunity Inflammation and Disease · doi:10.1002/iid3.1268 · Cited by 18
Emerson, L. E., Gioseffi, A., Barker, H. A., Sheppe, A. E. F., Morrill, J. K., Edelmann, M. J., & Kima, P. E. (2022) · Frontiers in Cellular and Infection Microbiology · doi:10.3389/fcimb.2022.934611 · Cited by 18
Wu, Z., Bai, Y., Qi, Y., Chang, C., Jiao, Y., Bai, Y., & Guo, Z. (2023) · Cell Death Discovery · doi:10.1038/s41420-023-01308-1 · Cited by 18
Advances in Metabolic Regulation of Macrophage Polarization State
Liu, X., Xiang, R., Fang, X., Wang, G., & Zhou, Y. (2024) · Immunological Investigations · doi:10.1080/08820139.2024.2302828 · Cited by 19
Raulien, N., Friedrich, K., Strobel, S., Raps, S., Hecker, F., Pierer, M., Schilling, E., Lainka, E., Kallinich, T., Baumann, S., et al. (2024) · Science Signaling · doi:10.1126/scisignal.add8913 · Cited by 18
Jeroundi, N., Roy, C., Basset, L., Pignon, P., Preisser, L., Blanchard, S., Bocca, C., Abadie, C., Lalande-Martin, J., Guéguen, N., et al. (2024) · EMBO Reports · doi:10.1038/s44319-024-00278-4 · Cited by 18
Tu, T. H., Kim, C.-S., Nam‐Goong, I. S., Nam, C. W., Kim, Y., Goto, T., Kawada, T., Park, T., Park, J. H. Y., Ryoo, Z. Y., et al. (2015) · FEBS Journal · doi:10.1111/febs.13236 · Cited by 18
Self-citationMetabolic Plasticity in Dendritic Cell Responses: Implications in Allergic Asthma
Mishra, A. (2017) · Journal of Immunology Research · doi:10.1155/2017/5134760 · Cited by 18
Effect of Melittin on Metabolomic Profile and Cytokine Production in PMA-Differentiated THP-1 Cells
Alqarni, A. M., Ferro, V. A., Parkinson, J. A., Dufton, M. J., & Watson, D. G. (2018) · Vaccines · doi:10.3390/vaccines6040072 · Cited by 18
Rabaneda‐Lombarte, N., Blasco-Agell, L., Serratosa, J., Ferigle, L., Saura, J., & Solà, C. (2020) · Scientific Reports · doi:10.1038/s41598-020-67649-4 · Cited by 18
Dar, M. I., Hussain, Y., & Pan, X. (2025) · American Journal of Physiology-Endocrinology and Metabolism · doi:10.1152/ajpendo.00009.2025 · Cited by 18
Metabolic rewiring directs melanoma immunology
Sun, N., Tian, Y., Chen, Y., Guo, W., & Li, C. (2022) · Frontiers in Immunology · doi:10.3389/fimmu.2022.909580 · Cited by 19
Resource allocation in mammalian systems
Baghdassarian, H. M., & Lewis, N. E. (2024) · Biotechnology Advances · doi:10.1016/j.biotechadv.2023.108305 · Cited by 17
Cattaneo, F., Marino, S. D., Parisi, M., Festa, C., Castaldo, M., Finamore, C., Duraturo, F., Zollo, C., Ammendola, R., Zollo, F., et al. (2019) · Phytochemical Analysis · doi:10.1002/pca.2844 · Cited by 16
Sun, L., Guo, M. Z., Lv, Z., Shao, Y., & Li, C. (2020) · Aquaculture · doi:10.1016/j.aquaculture.2020.735393 · Cited by 17
Mitochondrial connections with immune system in Zebrafish
do Amaral, M. A., Paredes, L. C., Padovani, B. N., Mendonça-Gomes, J. M., Montes, L. F., Câmara, N. O. S., & Morales, C. (2021) · Fish and Shellfish Immunology Reports · doi:10.1016/j.fsirep.2021.100019 · Cited by 17
Targeting macrophage metabolism to enhance tumor immunotherapy
Liu, J., Ma, Z., Jia, W., & Lan, P. (2024) · Cellular and Molecular Immunology · doi:10.1038/s41423-024-01149-7 · Cited by 16
Gallerand, A., Dolfi, B., Stunault, M. I., Caillot, Z., Castiglione, A., Strazzulla, A., Chen, C., Heo, G. S., Luehmann, H. P., Batoul, F., et al. (2024) · Nature Communications · doi:10.1038/s41467-024-53267-5 · Cited by 16
Self-citationImmunometabolic programming of macrophages in asthma pathogenesis and therapy
Lu, L., Shi, M., Wen, Q., Yang, M., Wang, X. C., & Wang, Y. (2026) · Frontiers in Physiology · doi:10.3389/fphys.2025.1736340 · Cited by 16
Jing, P., Luo, Y., Chen, Y., Tan, J., Liao, C., & Zhang, S. (2023) · Bioconjugate Chemistry · doi:10.1021/acs.bioconjchem.2c00548 · Cited by 16
Zhao, H.-Q., Wen, Z., & Xiong, S. (2023) · Cells · doi:10.3390/cells12162093 · Cited by 16
Hua, Y., Ji, P., Xue, Z.-Y., & Wei, Y. (2015) · Molecular BioSystems · doi:10.1039/c5mb00405e · Cited by 16
Metadata
- Authors
- Haschemi, A., Kosma, P., Gille, L., Evans, C. R., Burant, C. F., Starkl, P., Knapp, B., Haas, R., Schmid, J. A., Jandl, C., Amir, S., Lubec, G., Park, J., Esterbauer, H., Bilban, M., Brizuela, L., Pospisilik, J. A., Otterbein, L. E., & Wagner, O.
- Affiliations
- Beth Israel Deaconess Medical Center (US)
- BOKU University (AT)
- University of Veterinary Medicine Vienna (AT)
- University of Michigan (US)
- Medical University of Vienna (AT)
- Harvard University (US)
- Max Planck Institute of Immunobiology and Epigenetics (DE)
- Corresponding author
- Haschemi, Arvand
- Pospisilik, J. Andrew
- ORCID
- Venue
- Cell Metabolism
- Publisher
- Elsevier BV
- Published
- 2012-06
- Volume
- 15
- Issue
- 6
- Pages
- 813-826
- ISSN
- 1550-4131 (ISSN-L)
- PMC
- PMC3370649
- OpenAlex
- W2047563937
- Cited by
- 635
- References
- 53
- Citations by year
- 2026: 30 · 2025: 35 · 2024: 68 · 2023: 56 · 2022: 41 · 2021: 60 · 2020: 57 · 2019: 50 · 2018: 48 · 2017: 61 · 2016: 35 · 2015: 41 · 2014: 24 · 2013: 14 · 2012: 3
- FWCI
- 11.47
- Type
- journal article
- Language
- en
- Open access
- hybrid
- doi.org
- Licence
- Locations
- Cell Metabolism (publishedVersion, cc-by-nc-nd)
- Europe PMC (PubMed Central) (publishedVersion, cc-by-nc-nd)
- PubMed Central (publishedVersion, cc-by-nc-nd)
- PubMed (publishedVersion)
- Max Planck Digital Library (submittedVersion)
- MPG.PuRe (Max Planck Society) (submittedVersion)
- Funders
- Bundesministerium für Wissenschaft und Forschung
- National Institute of General Medical Sciences (R01GM088666)
- National Institute of Diabetes and Digestive and Kidney Diseases (K25DK092558, DK089503, P30DK089503)
- Topics
- Life Sciences › Immunology and Microbiology › Immunology › Immune cells in cancer
- Life Sciences › Biochemistry, Genetics and Molecular Biology › Molecular Biology › Metabolism, Diabetes, and Cancer
- Life Sciences › Biochemistry, Genetics and Molecular Biology › Cancer Research › Cancer, Hypoxia, and Metabolism
- Keywords
- macrophage polarization, glucose metabolism, pentose phosphate pathway, metabolic reprogramming, M1/M2 macrophages, lipopolysaccharide stimulation, redox state, immune cell metabolism
- MeSH terms
- Amino Acid Sequence, Animals, Cell Line, Double-Blind Method, Energy Metabolism, Glucose, Humans, Lipopolysaccharides, Macrophages, Male, Mice, Inbred C57BL, Models, Molecular, Phenotype, Receptors, Immunologic, Transcription Factors, Tumor Necrosis Factor-alpha, Down-Regulation, Interleukin-6, Gene Expression Regulation, Enzymologic, Cell Polarity, Protein Structure, Tertiary, Phosphotransferases (Alcohol Group Acceptor), Endotoxemia, Carbohydrate Metabolism, Mice
About these checks
Registry, retraction, Cites and statistics results are computed, not judged, with one exception: a printed reference that no index lists is read once by a model before it counts as a citation error. Claims are extracted by a model and kept only when their quote appears verbatim in the text; each cited source is then checked, with a model’s help, for whether it says what the claim relies on. Those verdicts can be wrong — read the claim’s quote and the cited source before relying on one.
Statistics and arithmetic are recomputed, not judged.
Confidence bands are shown only for fields calibrated on our annotated test set. None is calibrated yet, so no band is shown.
What counts as a claim ›How we measure confidence ›How we check this ›
Are you an author, or do you see a problem with this page? Request a review
