

The DOI matches its Crossref record; 49 of the 50 references it cites were found in a registry or an index.
Opa1 Overexpression Ameliorates the Phenotype of Two Mitochondrial Disease Mouse Models
Open accessAbstract
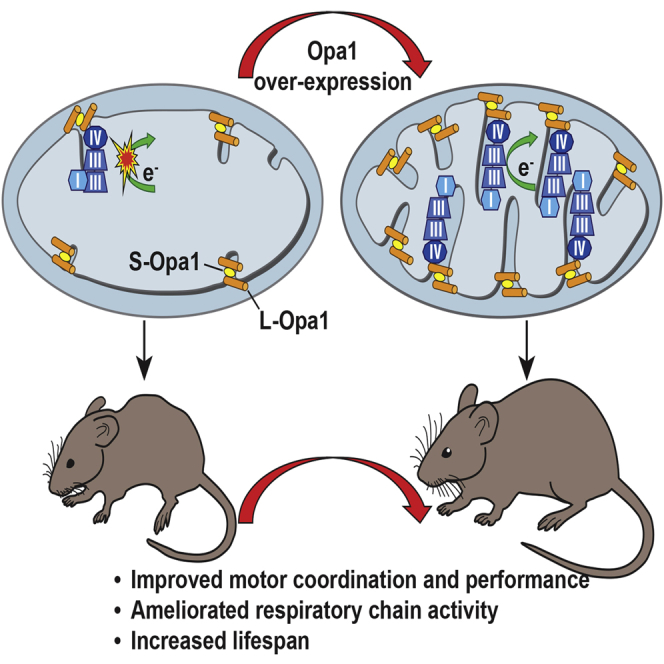
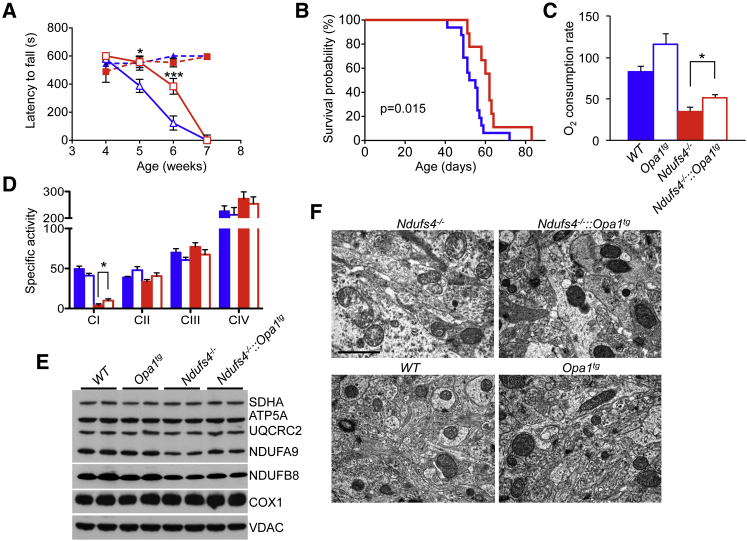
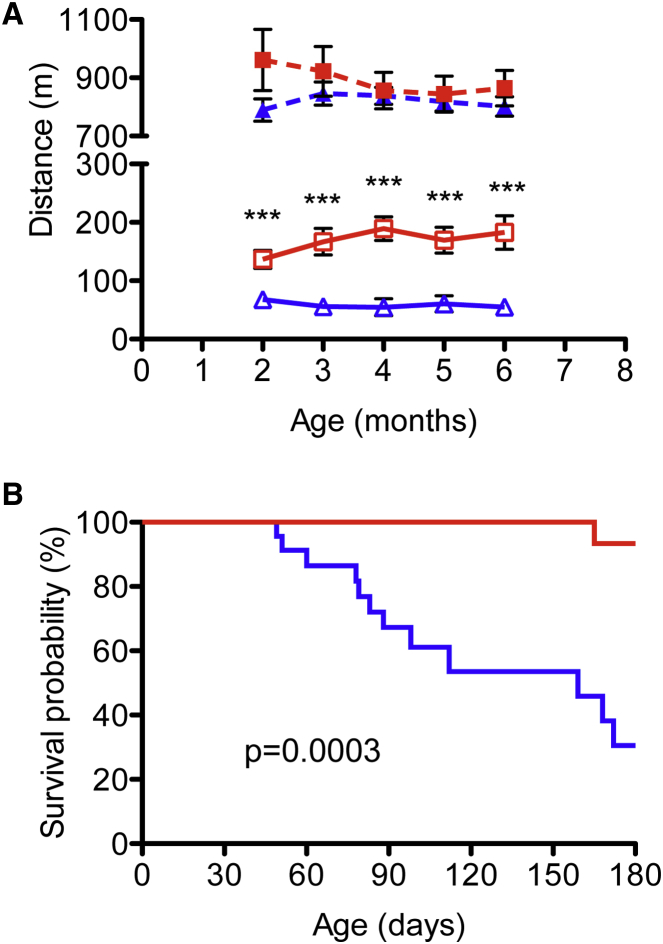
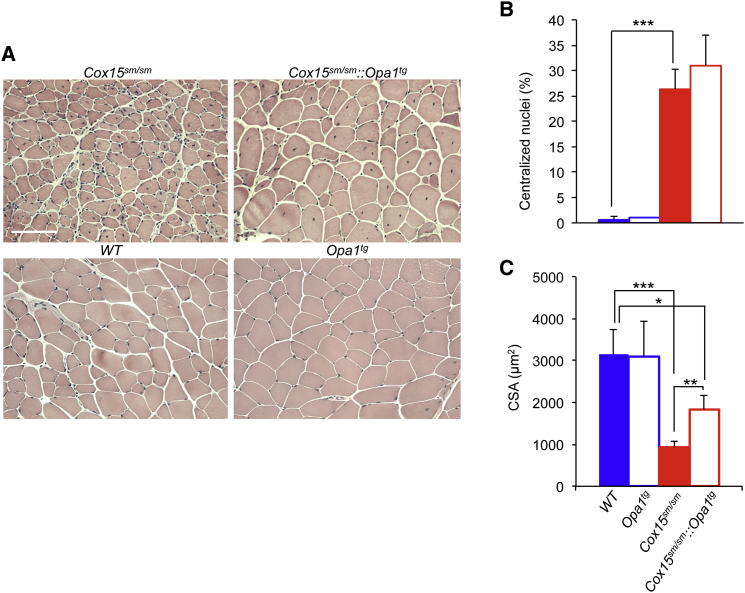
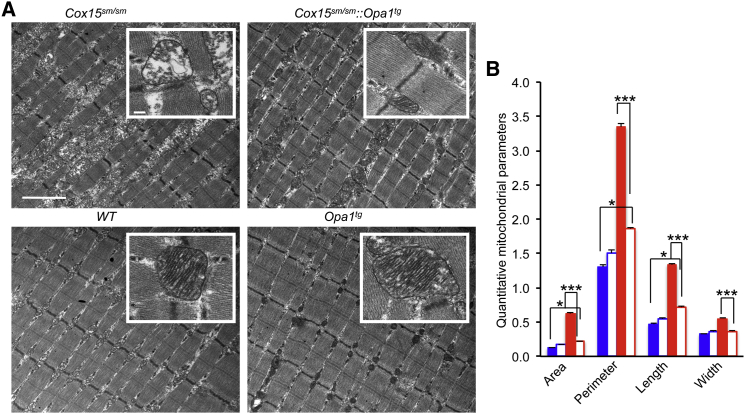
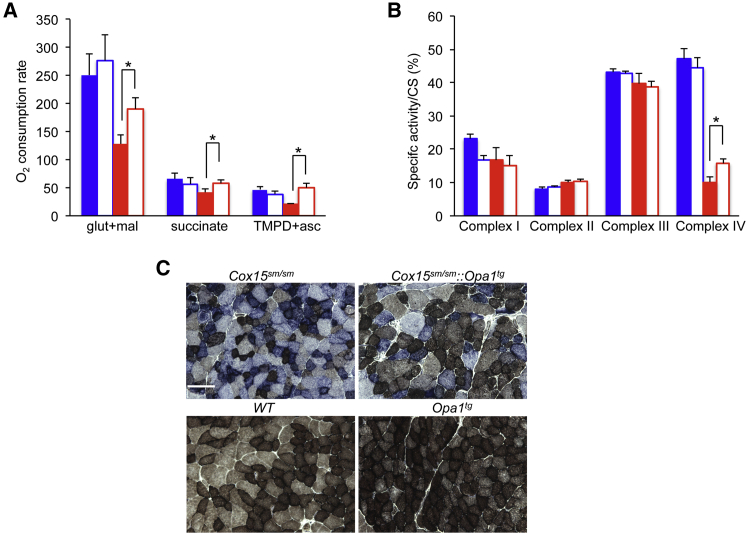
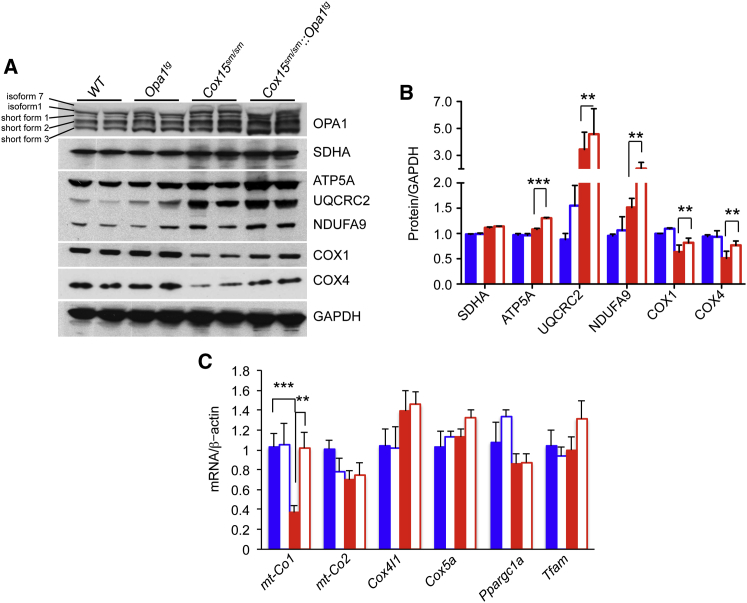
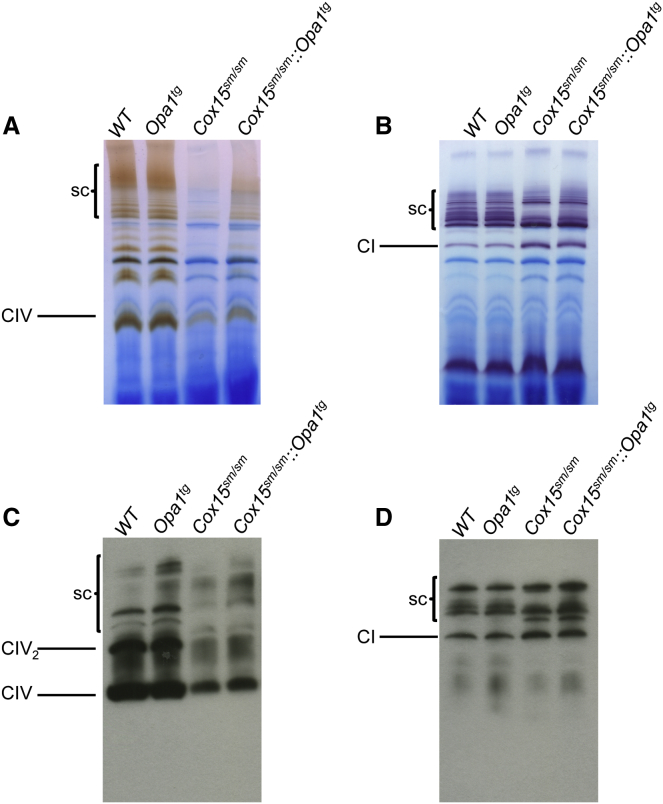
Increased levels of the mitochondria-shaping protein Opa1 improve respiratory chain efficiency and protect from tissue damage, suggesting that it could be an attractive target to counteract mitochondrial dysfunction. Here we show that Opa1 overexpression ameliorates two mouse models of defective mitochondrial bioenergetics. The offspring from crosses of a constitutive knockout for the structural complex I component Ndufs4 (Ndufs4(-/-)), and of a muscle-specific conditional knockout for the complex IV assembly factor Cox15 (Cox15(sm/sm)), with Opa1 transgenic (Opa1(tg)) mice showed improved motor skills and respiratory chain activities compared to the naive, non-Opa1-overexpressing, models. While the amelioration was modest in Ndufs4(-/-)::Opa1(tg) mice, correction of cristae ultrastructure and mitochondrial respiration, improvement of motor performance and prolongation of lifespan were remarkable in Cox15(sm/sm)::Opa1(tg) mice. Mechanistically, respiratory chain supercomplexes were increased in Cox15(sm/sm)::Opa1(tg) mice, and residual monomeric complex IV was stabilized. In conclusion, cristae shape amelioration by controlled Opa1 overexpression improves two mouse models of mitochondrial disease.
Overview
The claims and statistics of this paper haven’t been checked yet.
Run the check — free, no account needed. It reads the open-access text and checks the sources it cites.
Integrity signals
Registry
Cites
Statistics
Figures
Verification
Claims the paper makes
The claims and statistics of this paper haven’t been checked yet.
Run the check — free, no account needed. It reads the open-access text and checks the sources it cites.
Claims other papers make about this one
Each is checked against this paper’s own text: does it say what the citing paper says it does?
The source backs part of the claim, not all of it — or backs it for a different population, condition or comparison.
In the citing paper
“Several reports have shown that rebalancing of mitochondrial dynamics rescues the phenotype of certain diseases associated with alterations of mitochondrial fusion or fission [119, 194, 195, 214]”
From The connection between the dynamic remodeling of the mitochondrial network and the regulation of muscle mass (2021) · cites this paper as [195]
Experimental — accuracy not yet measuredIn the citing paper
“OPA1 transgenic mice are protected from acute muscle loss induced by denervation [194] as well as from chronic muscle loss in a model of myopathy caused by muscle-specific deletion of the mitochondrial subunit COX15 [195].”
From The connection between the dynamic remodeling of the mitochondrial network and the regulation of muscle mass (2021) · cites this paper as [195]
In the citing paper
“Conversely, overexpression of Opa1 protects from denervation-induced muscle loss and ameliorates muscle function in a mouse model of mitochondrial myopathy [9,10].”
From Inhibition of the Fission Machinery Mitigates OPA1 Impairment in Adult Skeletal Muscles (2019) · cites this paper as [9]
In the citing paper
“Conversely, OPA1 overexpression protects mice from acute and chronic muscle atrophy by ameliorating mitochondrial cristae remodeling and mitochondrial dysfunction (87, 88).”
From From mitochondria to sarcopenia: role of 17β-estradiol and testosterone (2023) · cites this paper as [88]
In the citing paper
“Both transgenic and gene knockout approaches in mice have also been used to demonstrate the important roles of OPA1 in regulating skeletal muscle mass and functions23,44,45.”
From Disuse-associated loss of the protease Lonp1 in muscle impairs mitochondrial function and causes reduced skeletal muscle mass and strength (2022) · cites this paper as [44]
Self-check
Percentages, sums and reported differences re-computed from the paper’s own numbers.
The self-check needs the paper’s full text.
Citations
Cites
OPA1 Controls Apoptotic Cristae Remodeling Independently from Mitochondrial Fusion
Frezza, C., Cipolat, S., Martins de Brito, O., Micaroni, M., Beznoussenko, G. V., Rudka, T., Bartoli, D., Polishuck, R. S., Danial, N. N., De Strooper, B., et al. (2006) · Cell · doi:10.1016/j.cell.2006.06.025 · Cited by 1,673
Self-citationOPA1 requires mitofusin 1 to promote mitochondrial fusion
Cipolat, S., de Brito, O. M., Dal Zilio, B., & Scorrano, L. (2004) · Proceedings of the National Academy of Sciences · doi:10.1073/pnas.0407043101 · Cited by 1,300
Self-citationCogliati, S., Frezza, C., Soriano, M. E., Varanita, T., Quintana-Cabrera, R., Corrado, M., Cipolat, S., Costa, V., Casarin, A., Gomes, L. C., et al. (2013) · Cell · doi:10.1016/j.cell.2013.08.032 · Cited by 1,265
Self-citationOrganelle isolation: functional mitochondria from mouse liver, muscle and cultured filroblasts
Frezza, C., Cipolat, S., & Scorrano, L. (2007) · Nature Protocols · doi:10.1038/nprot.2006.478 · Cited by 1,188
Self-citationRegulation of mitochondrial morphology through proteolytic cleavage of OPA1
Ishihara, N., Fujita, Y., Oka, T., & Mihara, K. (2006) · The EMBO Journal · doi:10.1038/sj.emboj.7601184 · Cited by 899
Song, Z., Chen, H., Fiket, M., Alexander, C., & Chan, D. C. (2007) · The Journal of Cell Biology · doi:10.1083/jcb.200704110 · Cited by 818
The i -AAA protease YME1L and OMA1 cleave OPA1 to balance mitochondrial fusion and fission
Anand, R., Wai, T., Baker, M. J., Kladt, N., Schauss, A. C., Rugarli, E., & Langer, T. (2014) · Journal of Cell Biology · doi:10.1083/jcb.201308006 · Cited by 812
Transcriptional integration of mitochondrial biogenesis
Scarpulla, R. C., Vega, R. B., & Kelly, D. P. (2012) · Trends in Endocrinology & Metabolism · doi:10.1016/j.tem.2012.06.006 · Cited by 798
Pathogenic Mitochondrial DNA Mutations Are Common in the General Population
Elliott, H. R., Samuels, D. C., Eden, J. A., Relton, C. L., & Chinnery, P. F. (2008) · The American Journal of Human Genetics · doi:10.1016/j.ajhg.2008.07.004 · Cited by 638
Regulation of OPA1 processing and mitochondrial fusion by m -AAA protease isoenzymes and OMA1
Ehses, S., Lauria, I., Mancuso, G., Bernacchia, A., Geimer, S., Tondera, D., Martinou, J., Westermann, B., Rugarli, E. I., & Langer, T. (2009) · The Journal of Cell Biology · doi:10.1083/jcb.200906084 · Cited by 596
Cited by
Sorted by citations
Sarcopenia: Aging-Related Loss of Muscle Mass and Function
Larsson, L., Degens, H., Li, M., Salviati, L., Lee, Y. I., Thompson, W., Kirkland, J. L., & Sandri, M. (2019) · Physiological Reviews · doi:10.1152/physrev.00061.2017 · Cited by 1,797
Mitochondrial Dynamics Controls T Cell Fate through Metabolic Programming
Buck, M. D., O’Sullivan, D., Geltink, R. I. K., Curtis, J. D., Chang, C., Sanin, D. E., Qiu, J., Kretz, O., Braas, D., van der Windt, G. J. W., et al. (2016) · Cell · doi:10.1016/j.cell.2016.05.035 · Cited by 1,491
Mitochondrial Dynamics and Metabolic Regulation
Wai, T., & Langer, T. (2016) · Trends in Endocrinology and Metabolism · doi:10.1016/j.tem.2015.12.001 · Cited by 1,354
Mitochondrial Cristae: Where Beauty Meets Functionality
Cogliati, S., Enriquez, J. A., & Scorrano, L. (2016) · Trends in Biochemical Sciences · doi:10.1016/j.tibs.2016.01.001 · Cited by 816
Self-citationPernas, L. F., & Scorrano, L. (2015) · Annual Review of Physiology · doi:10.1146/annurev-physiol-021115-105011 · Cited by 845
Self-citation
Metadata
- Authors
- Civiletto, G., Varanita, T., Cerutti, R., Gorletta, T., Barbaro, S., Marchet, S., Lamperti, C., Viscomi, C., Scorrano, L., & Zeviani, M.
- Affiliations
- Fondazione IRCCS Istituto Neurologico Carlo Besta (IT)
- Veneto Institute of Molecular Medicine (IT)
- MRC Mitochondrial Biology Unit (GB)
- University of Padua (IT)
- Corresponding author
- Scorrano, Luca
- Zeviani, Massimo
- ORCID
- Venue
- Cell Metabolism
- Publisher
- Elsevier BV
- Published
- 2015-06
- Volume
- 21
- Issue
- 6
- Pages
- 845-854
- ISSN
- 1550-4131 (ISSN-L)
- PMC
- PMC4457891
- OpenAlex
- W2169501919
- Cited by
- 216
- References
- 50
- Citations by year
- 2026: 4 · 2025: 12 · 2024: 12 · 2023: 15 · 2022: 19 · 2021: 26 · 2020: 26 · 2019: 28 · 2018: 22 · 2017: 18 · 2016: 24 · 2015: 10
- FWCI
- 10.65
- Type
- journal article
- Language
- en
- Open access
- hybrid
- doi.org
- Licence
- Locations
- Cell Metabolism (publishedVersion, cc-by-nc-nd)
- Europe PMC (PubMed Central) (publishedVersion, cc-by-nc-nd)
- PubMed Central (publishedVersion, cc-by-nc-nd)
- PubMed (publishedVersion)
- Archivio Istituzionale della Ricerca (Universita Degli Studi Di Milano) (submittedVersion, other-oa)
- Padua Research Archive (University of Padova) (submittedVersion, cc-by-nc-nd)
- Padua Research Archive (University of Padova) (submittedVersion, other-oa)
- Topics
- Life Sciences › Biochemistry, Genetics and Molecular Biology › Molecular Biology › Mitochondrial Function and Pathology
- Life Sciences › Biochemistry, Genetics and Molecular Biology › Clinical Biochemistry › Metabolism and Genetic Disorders
- Life Sciences › Biochemistry, Genetics and Molecular Biology › Cell Biology › Autophagy in Disease and Therapy
- Keywords
- OPA1, mitochondrial disease, mitochondrial cristae, mitochondrial fusion, NDUFS4, complex I, cytochrome c oxidase, respiratory chain supercomplexes, mitochondrial bioenergetics, motor function, lifespan extension, transgenic mice, mitochondrial dysfunction
- MeSH terms
- Animals, Electron Transport Complex IV, Mitochondria, Oxygen Consumption, Gene Expression Regulation, Enzymologic, Mice, Knockout, GTP Phosphohydrolases, Mitochondrial Diseases, Electron Transport Complex I, Mice
About these checks
Registry, retraction, Cites and statistics results are computed, not judged, with one exception: a printed reference that no index lists is read once by a model before it counts as a citation error. Claims are extracted by a model and kept only when their quote appears verbatim in the text; each cited source is then checked, with a model’s help, for whether it says what the claim relies on. Those verdicts can be wrong — read the claim’s quote and the cited source before relying on one.
Statistics and arithmetic are recomputed, not judged.
Confidence bands are shown only for fields calibrated on our annotated test set. None is calibrated yet, so no band is shown.
What counts as a claim ›How we measure confidence ›How we check this ›
Are you an author, or do you see a problem with this page? Request a review
