

The DOI matches its Crossref record; 27 of the 27 references it cites were found in a registry or an index.
Brusatol provokes a rapid and transient inhibition of Nrf2 signaling and sensitizes mammalian cells to chemical toxicity—implications for therapeutic targeting of Nrf2
Open accessAbstract
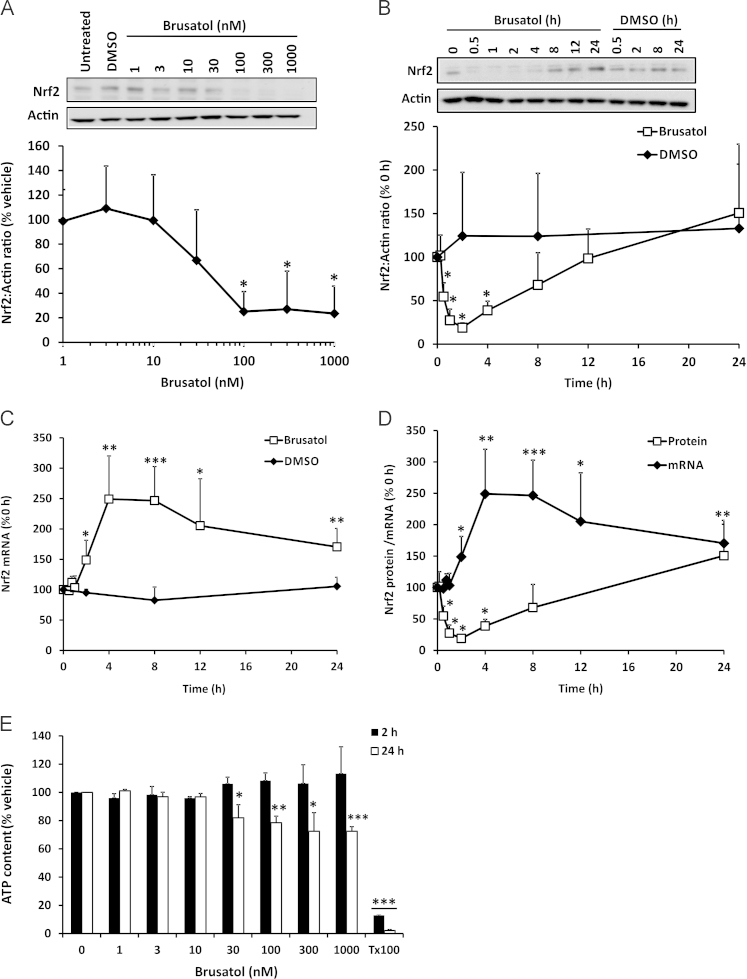
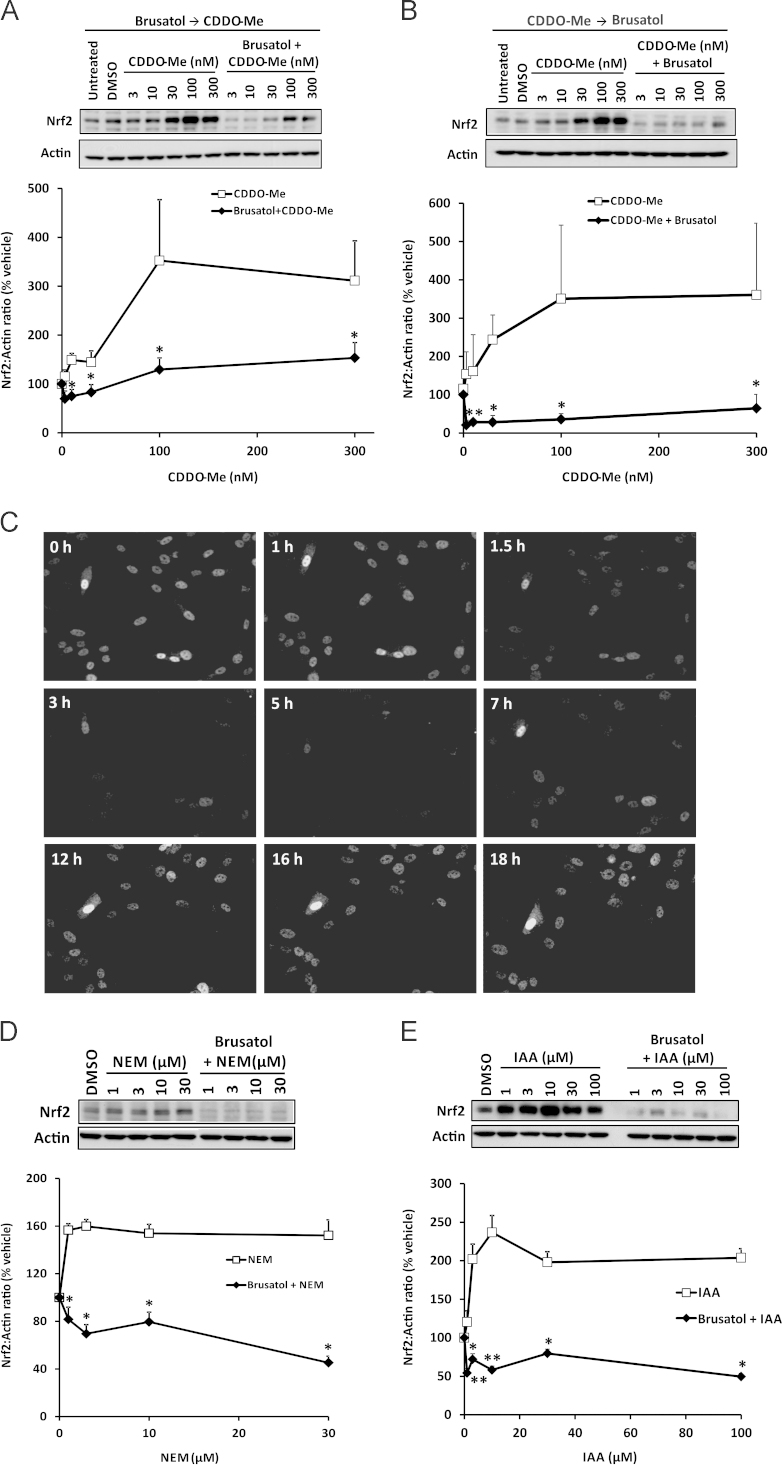
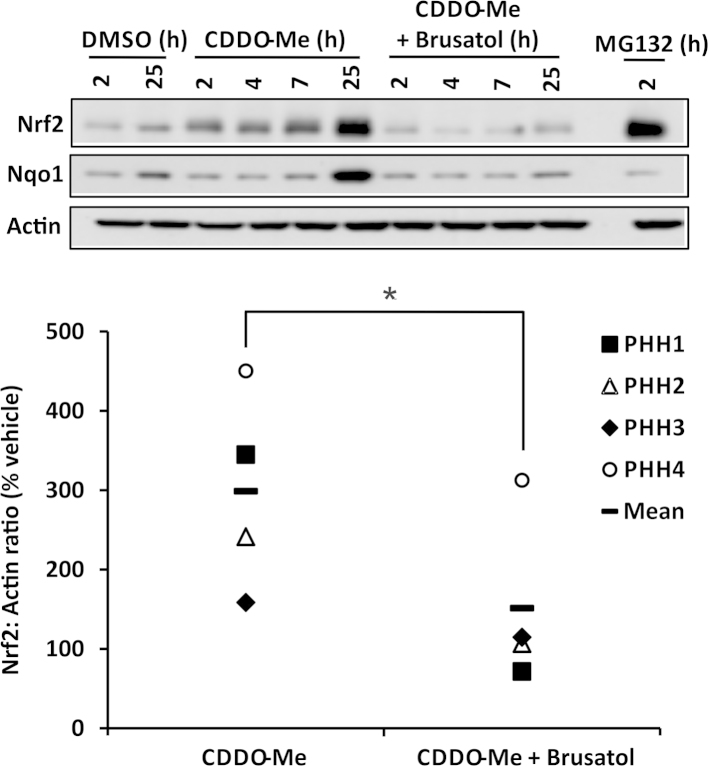
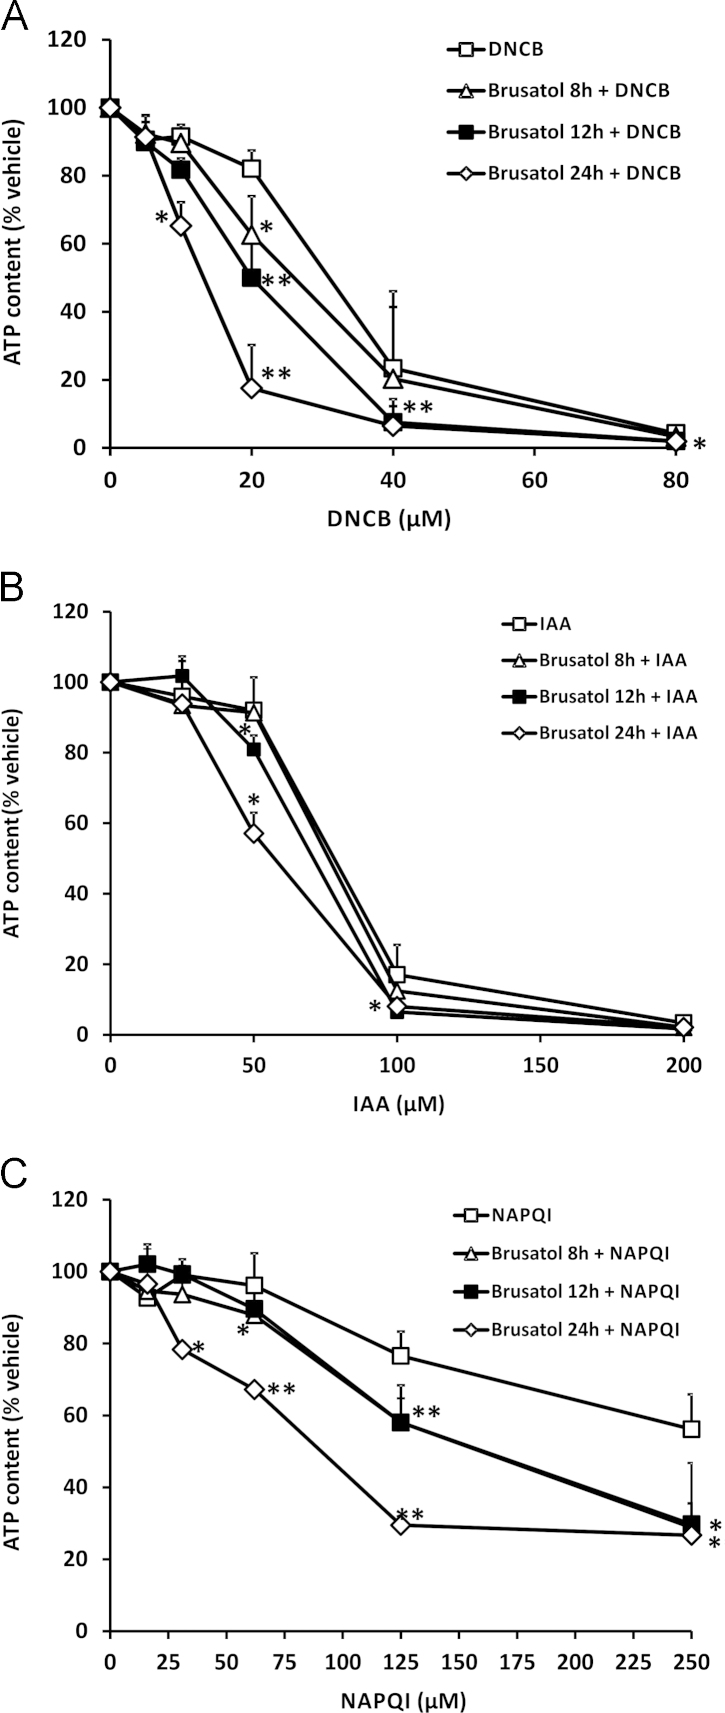
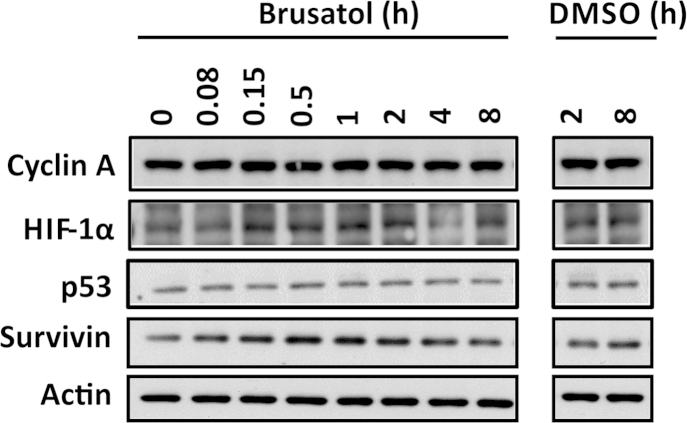
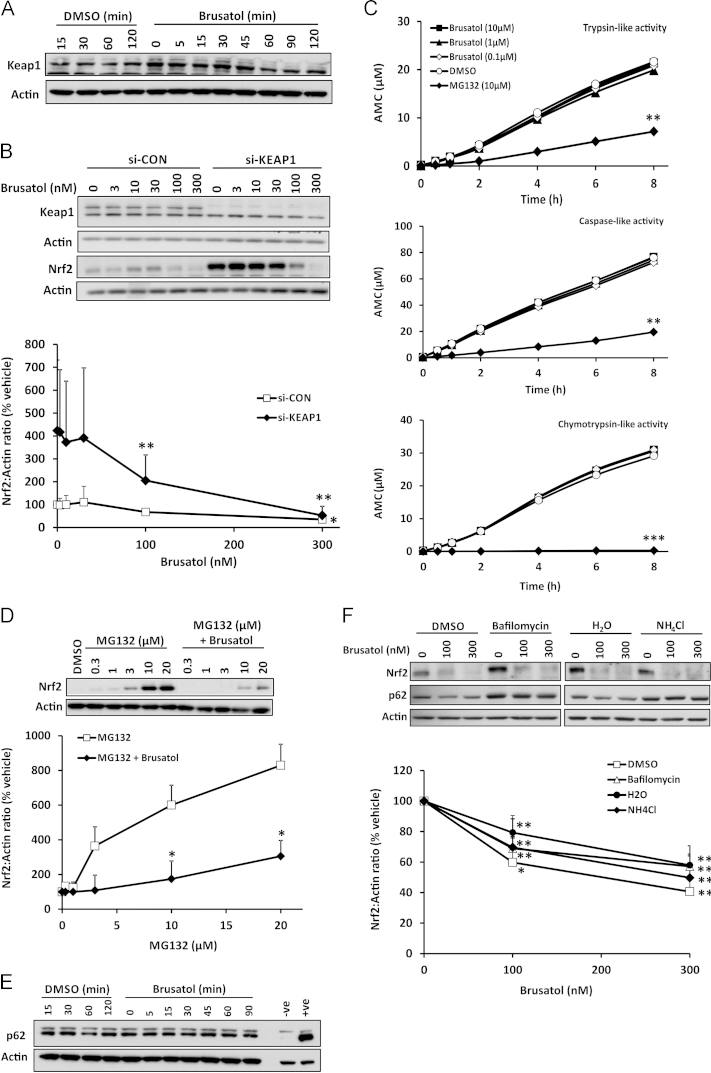
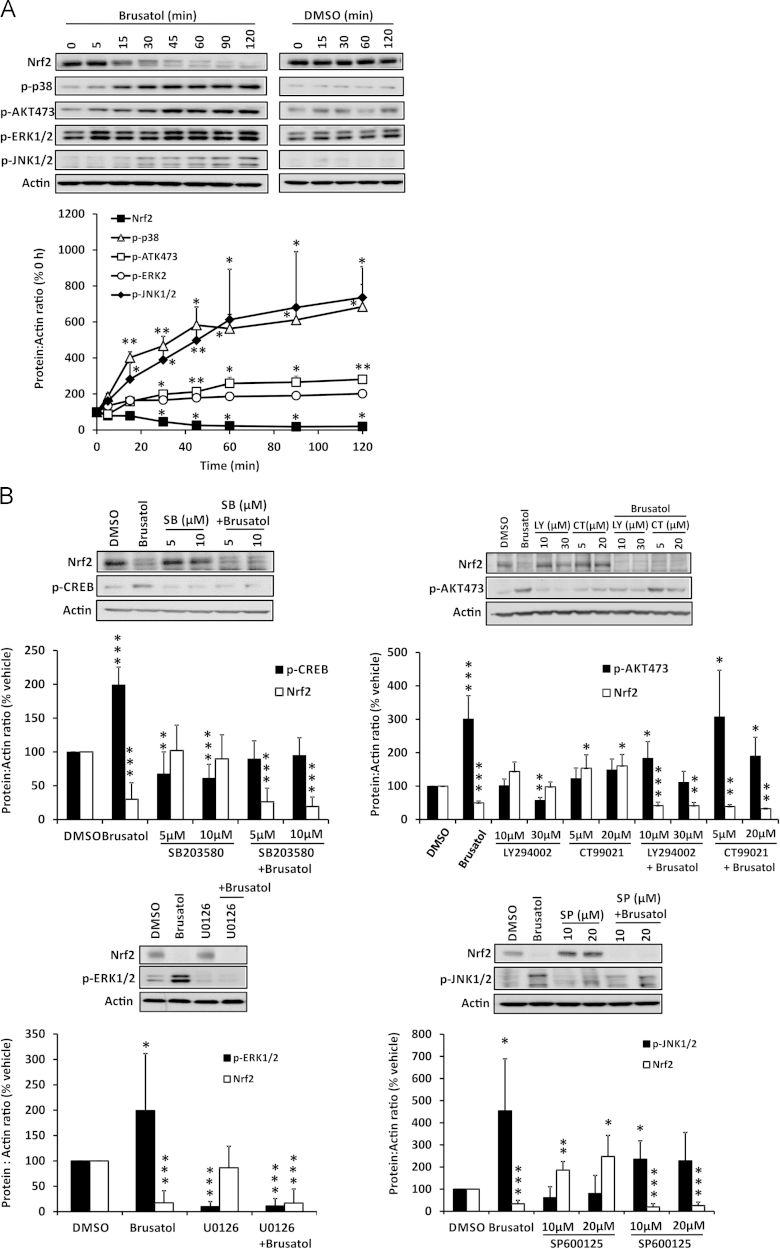
The transcription factor Nrf2 regulates the basal and inducible expression of a battery of cytoprotective genes. Whereas numerous Nrf2-inducing small molecules have been reported, very few chemical inhibitors of Nrf2 have been identified to date. The quassinoid brusatol has recently been shown to inhibit Nrf2 and ameliorate chemoresistance in vitro and in vivo. Here, we show that brusatol provokes a rapid and transient depletion of Nrf2 protein, through a posttranscriptional mechanism, in mouse Hepa-1c1c7 hepatoma cells. Importantly, brusatol also inhibits Nrf2 in freshly isolated primary human hepatocytes. In keeping with its ability to inhibit Nrf2 signaling, brusatol sensitizes Hepa-1c1c7 cells to chemical stress provoked by 2,4-dinitrochlorobenzene, iodoacetamide, and N-acetyl-p-benzoquinone imine, the hepatotoxic metabolite of acetaminophen. The inhibitory effect of brusatol toward Nrf2 is shown to be independent of its repressor Keap1, the proteasomal and autophagic protein degradation systems, and protein kinase signaling pathways that are known to modulate Nrf2 activity, implying the involvement of a novel means of Nrf2 regulation. These findings substantiate brusatol as a useful experimental tool for the inhibition of Nrf2 signaling and highlight the potential for therapeutic inhibition of Nrf2 to alter the risk of adverse events by reducing the capacity of nontarget cells to buffer against chemical and oxidative insults. These data will inform a rational assessment of the risk:benefit ratio of inhibiting Nrf2 in relevant therapeutic contexts, which is essential if compounds such as brusatol are to be developed into efficacious and safe drugs.
Overview
The claims and statistics of this paper haven’t been checked yet.
Run the check — free, no account needed. It reads the open-access text and checks the sources it cites.
Integrity signals
Registry
Cites
Statistics
Figures
Verification
Claims the paper makes
The claims and statistics of this paper haven’t been checked yet.
Run the check — free, no account needed. It reads the open-access text and checks the sources it cites.
Claims other papers make about this one
Each is checked against this paper’s own text: does it say what the citing paper says it does?
In the citing paper
“brusatol has been shown to enhance the efficacy of chemotherapy by inhibiting Nrf2 [229,230].”
From Nrf2 and Oxidative Stress: A General Overview of Mechanisms and Implications in Human Disease (2022) · cites this paper as [230]
Self-check
Percentages, sums and reported differences re-computed from the paper’s own numbers.
The self-check needs the paper’s full text.
Citations
Cites
Itoh, K., Wakabayashi, N., Katoh, Y., Ishii, T., Igarashi, K., Engel, J. D., & Yamamoto, M. (1999) · Genes & Development · doi:10.1101/gad.13.1.76 · Cited by 3,634
Molecular mechanisms of the Keap1-Nrf2 pathway in stress response and cancer evolution
Taguchi, K., Motohashi, H., & Yamamoto, M. (2011) · Genes to Cells · doi:10.1111/j.1365-2443.2010.01473.x · Cited by 1,478
Keap1 Is a Redox-Regulated Substrate Adaptor Protein for a Cul3-Dependent Ubiquitin Ligase Complex
Zhang, D. D., Lo, S., Cross, J. V., Templeton, D. J., & Hannink, M. (2004) · Molecular and Cellular Biology · doi:10.1128/mcb.24.24.10941-10953.2004 · Cited by 1,284
Chapter 12 Monitoring Autophagic Degradation of p62/SQSTM1
Bjørkøy, G., Lamark, T., Pankiv, S., Øvervatn, A., Brech, A., & Johansen, T. (2009) · Methods in Enzymology · doi:10.1016/s0076-6879(08)03612-4 · Cited by 1,069
The Nrf2 cell defence pathway: Keap1-dependent and -independent mechanisms of regulation
Bryan, H. K., Olayanju, A., Goldring, C. E., & Park, B. K. (2012) · Biochemical Pharmacology · doi:10.1016/j.bcp.2012.11.016 · Cited by 1,047
An important function of Nrf2 in combating oxidative stress: Detoxification of acetaminophen
Chan, K., Han, X.-D., & Kan, Y. W. (2001) · Proceedings of the National Academy of Sciences · doi:10.1073/pnas.081082098 · Cited by 766
Enomoto, A. (2001) · Toxicological Sciences · doi:10.1093/toxsci/59.1.169 · Cited by 728
Brusatol enhances the efficacy of chemotherapy by inhibiting the Nrf2-mediated defense mechanism
Ren, D., Villeneuve, N. F., Jiang, T., Wu, T., Lau, A., Toppin, H. A., & Zhang, D. D. (2011) · Proceedings of the National Academy of Sciences · doi:10.1073/pnas.1014275108 · Cited by 673
Nguyen, T., Sherratt, P. J., Huang, H.-C., Yang, C. S., & Pickett, C. B. (2003) · Journal of Biological Chemistry · doi:10.1074/jbc.m207293200 · Cited by 615
Nrf2 signaling: An adaptive response pathway for protection against environmental toxic insults
Osburn, W. O., & Kensler, T. W. (2007) · Mutation Research/Reviews in Mutation Research · doi:10.1016/j.mrrev.2007.11.006 · Cited by 549
Okawa, H., Motohashi, H., Kobayashi, A., Aburatani, H., Kensler, T. W., & Yamamoto, M. P. (2005) · Biochemical and Biophysical Research Communications · doi:10.1016/j.bbrc.2005.10.185 · Cited by 387
The transcription factor NRF2 protects against pulmonary fibrosis
Cho, H., Reddy, S. P., Yamamoto, M. P., & Kleeberger, S. R. (2004) · The FASEB Journal · doi:10.1096/fj.03-1127fje · Cited by 355
Arlt, A., Sebens, S., Krebs, S., Geismann, C., Großmann, M., Kruse, M.-L., Schreiber, S., & Schäfer, H. (2012) · Oncogene · doi:10.1038/onc.2012.493 · Cited by 338
Tang, X., Wang, H., Fan, L., Wu, X., Xin, A., Ren, H.-Y., & Wang, X. J. (2011) · Free Radical Biology and Medicine · doi:10.1016/j.freeradbiomed.2011.03.008 · Cited by 336
Wang, X. J., Hayes, J. D., Henderson, C. J., & Wolf, C. R. (2007) · Proceedings of the National Academy of Sciences · doi:10.1073/pnas.0709483104 · Cited by 310
Oncogenic KRAS Confers Chemoresistance by Upregulating NRF2
Tao, S., Wang, S., Moghaddam, S. J., Ooi, A., Chapman, E., Wong, P. K., & Zhang, D. D. (2014) · Cancer Research · doi:10.1158/0008-5472.can-14-1439 · Cited by 291
Nrf2 is overexpressed in pancreatic cancer: implications for cell proliferation and therapy
Lister, A., Nedjadi, T., Kitteringham, N. R., Campbell, F., Costello, E., Lloyd, B. H., Copple, I. M., Williams, S. J., Owen, A., Neoptolemos, J. P., et al. (2011) · Molecular Cancer · doi:10.1186/1476-4598-10-37 · Cited by 243
Adaptation to Oxidative Stress, Chemoresistance, and Cell Survival
Landriscina, M., Maddalena, F., Laudiero, G., & Esposito, F. (2009) · Antioxidants and Redox Signaling · doi:10.1089/ars.2009.2692 · Cited by 219
Nrf2: control of sensitivity to carcinogens
Slocum, S. L., & Kensler, T. W. (2011) · Archives of Toxicology · doi:10.1007/s00204-011-0675-4 · Cited by 219
p62 at the Interface of Autophagy, Oxidative Stress Signaling, and Cancer
Nezis, I. P., & Stenmark, H. (2011) · Antioxidants and Redox Signaling · doi:10.1089/ars.2011.4394 · Cited by 186
Aleksunes, L. M., Goedken, M. J., Rockwell, C. E., Thomale, J., Manautou, J. E., & Klaassen, C. D. (2010) · Journal of Pharmacology and Experimental Therapeutics · doi:10.1124/jpet.110.170084 · Cited by 178
The Keap1–Nrf2 Cell Defense Pathway – A Promising Therapeutic Target?
Copple, I. M. (2012) · Advances in pharmacology · doi:10.1016/b978-0-12-398339-8.00002-1 · Cited by 174
Oxidative stress, mammospheres and Nrf2–new implication for breast cancer therapy?
Wu, T., Harder, B. G., Wong, P. K., Lang, J. E., & Zhang, D. D. (2014) · Molecular Carcinogenesis · doi:10.1002/mc.22202 · Cited by 119
Darnell, M., Ulvestad, M., Ellis, E. C. S., Weidolf, L. O. G., & Andersson, T. B. (2012) · Journal of Pharmacology and Experimental Therapeutics · doi:10.1124/jpet.112.195834 · Cited by 67
Mechanism of eukaryotic protein synthesis inhibition by brusatol
Willingham, W., Stafford, E. A., Reynolds, S. H., Chaney, S. G., Lee, K.-H., Okano, M., & Hall, I. H. (1981) · Biochimica et Biophysica Acta (BBA) - Nucleic Acids and Protein Synthesis · doi:10.1016/0005-2787(81)90168-4 · Cited by 36
Translational control of Nrf2 within the open reading frame
Pérez, Ó. C., Barrero, C. A., & Merali, S. (2013) · Biochemical and Biophysical Research Communications · doi:10.1016/j.bbrc.2013.06.052 · Cited by 23
Willingham, W., Considine, R. T., Chaney, S. G., Lee, K., & Hall, I. H. (1984) · Biochemical Pharmacology · doi:10.1016/0006-2952(84)90494-5 · Cited by 10
Cited by
Sorted by citations
Nrf2 and Oxidative Stress: A General Overview of Mechanisms and Implications in Human Disease
Ngo, V., & Duennwald, M. L. (2022) · Antioxidants · doi:10.3390/antiox11122345 · Cited by 1,130
The Keap1–Nrf2–ARE Pathway As a Potential Preventive and Therapeutic Target: An Update
Lu, M., Ji, J., Jiang, Z., & You, Q. (2016) · Medicinal Research Reviews · doi:10.1002/med.21396 · Cited by 815
Nrf2, the Master Regulator of Anti-Oxidative Responses
Vomund, S., Schäfer, A., Parnham, M., Brüne, B., & Von Knethen, A. (2017) · International Journal of Molecular Sciences · doi:10.3390/ijms18122772 · Cited by 752
Transcription Factor NRF2 as a Therapeutic Target for Chronic Diseases: A Systems Medicine Approach
Cuadrado, A., Manda, G., Hassan, A., Alcaraz, M. J., Barbas, C., Daiber, A., Ghezzi, P., León, R., López, M. G., Oliva, B., et al. (2018) · Pharmacological Reviews · doi:10.1124/pr.117.014753 · Cited by 632
Anti-angiogenic therapy: current challenges and future perspectives
Lopes-Coelho, F., Martins, F., Pereira, S. A., & Serpa, J. (2021) · International Journal of Molecular Sciences · doi:10.3390/ijms22073765 · Cited by 416
Metadata
- Authors
- Olayanju, A., Copple, I. M., Bryan, H. K., Edge, G. T., Sison, R. L., Wong, M. W., Lai, Z.-Q., Lin, Z.-X., Dunn, K., Sanderson, C. M., Alghanem, A. F., Cross, M. J., Ellis, E. C., Ingelman-Sundberg, M., Malik, H. Z., Kitteringham, N. R., Goldring, C. E., & Park, B. K.
- Affiliations
- University of Liverpool (GB)
- Chinese University of Hong Kong (HK)
- Karolinska University Hospital (SE)
- Aintree University Hospitals NHS Foundation Trust (GB)
- Corresponding author
- Goldring, Christopher E.
- ORCID
- Venue
- Free Radical Biology and Medicine
- Publisher
- Elsevier BV
- Published
- 2015-01
- Volume
- 78
- Pages
- 202-212
- ISSN
- 0891-5849 (ISSN-L)
- PMC
- PMC4291150
- OpenAlex
- W1998845439
- Cited by
- 232
- References
- 27
- Citations by year
- 2026: 15 · 2025: 15 · 2024: 23 · 2023: 11 · 2022: 34 · 2021: 26 · 2020: 24 · 2019: 17 · 2018: 20 · 2017: 25 · 2016: 14 · 2015: 7
- FWCI
- 6.28
- Type
- journal article
- Language
- en
- Open access
- hybrid
- doi.org
- Licence
- Locations
- Free Radical Biology and Medicine (publishedVersion, cc-by)
- Europe PMC (PubMed Central) (publishedVersion, cc-by)
- PubMed Central (publishedVersion, cc-by)
- PubMed (publishedVersion)
- Funders
- Medical Research Council
- EMBO (ASTF 398-2013)
- Topics
- Life Sciences › Biochemistry, Genetics and Molecular Biology › Molecular Biology › Genomics, phytochemicals, and oxidative stress
- Life Sciences › Pharmacology, Toxicology and Pharmaceutics › Toxicology › Bioactive Compounds and Antitumor Agents
- Life Sciences › Pharmacology, Toxicology and Pharmaceutics › Pharmacology › Drug-Induced Hepatotoxicity and Protection
- Keywords
- brusatol, Nrf2 inhibition, quassinoids, post-transcriptional regulation, hepatotoxicity, 1-chloro-2,4-dinitrobenzene, iodoacetamide, chemoresistance, hepatocytes, hepatoma cells, oxidative stress, drug safety
- MeSH terms
- Animals, Autophagy, Cells, Cultured, Gene Expression Regulation, Carcinoma, Hepatocellular, Humans, Liver Neoplasms, Oxidation-Reduction, RNA, Messenger, Blotting, Western, Signal Transduction, Apoptosis, Oxidative Stress, Reverse Transcriptase Polymerase Chain Reaction, Hepatocytes, Brucea, RNA, Small Interfering, Quassins, Cell Proliferation, NF-E2-Related Factor 2, Mice, Real-Time Polymerase Chain Reaction
About these checks
Registry, retraction, Cites and statistics results are computed, not judged, with one exception: a printed reference that no index lists is read once by a model before it counts as a citation error. Claims are extracted by a model and kept only when their quote appears verbatim in the text; each cited source is then checked, with a model’s help, for whether it says what the claim relies on. Those verdicts can be wrong — read the claim’s quote and the cited source before relying on one.
Statistics and arithmetic are recomputed, not judged.
Confidence bands are shown only for fields calibrated on our annotated test set. None is calibrated yet, so no band is shown.
What counts as a claim ›How we measure confidence ›How we check this ›
Are you an author, or do you see a problem with this page? Request a review
