Cited by 12

The DOI matches its Crossref record; 11 of the 11 references it cites were found in a registry or an index.

Single-Cell Transcriptomes Reveal Characteristics of MicroRNAs in Gene Expression Noise Reduction

Hu, Tao, Wei, Lei, Li, Shuailin, Cheng, Tianrun, Zhang, Xuegong, Wang, Xiaowo·2021·Genomics, Proteomics & Bioinformatics

Abstract

Isogenic cells growing in identical environments show cell-to-cell variations because of the stochasticity in gene expression. High levels of variation or noise can disrupt robust gene expression and result in tremendous consequences for cell behaviors. In this work, we showed evidence from single-cell RNA sequencing data analysis that microRNAs (miRNAs) can reduce gene expression noise at the mRNA level in mouse cells. We identified that the miRNA expression level, number of targets, target pool abundance, and miRNA–target interaction strength are the key features contributing to noise repression. miRNAs tend to work together in cooperative subnetworks to repress target noise synergistically in a cell type-specific manner. By building a physical model of post-transcriptional regulation and observing in synthetic gene circuits, we demonstrated that accelerated degradation with elevated transcriptional activation of the miRNA target provides resistance to extrinsic fluctuations. Together, through the integrated analysis of single-cell RNA and miRNA expression profiles, we demonstrated that miRNAs are important post-transcriptional regulators for reducing gene expression noise and conferring robustness to biological processes.

Overview

The claims and statistics of this paper haven’t been checked yet.

Run the check — free, no account needed. It reads the open-access text and checks the sources it cites.

A few free checks a day · papers already verified open instantly · results are public

Integrity signals

Registry

Crossref · 10.1016/j.gpb.2021.05.002

Cites

11 of 11 references verified0 citation errors · 0 not checkable

Statistics

Figures
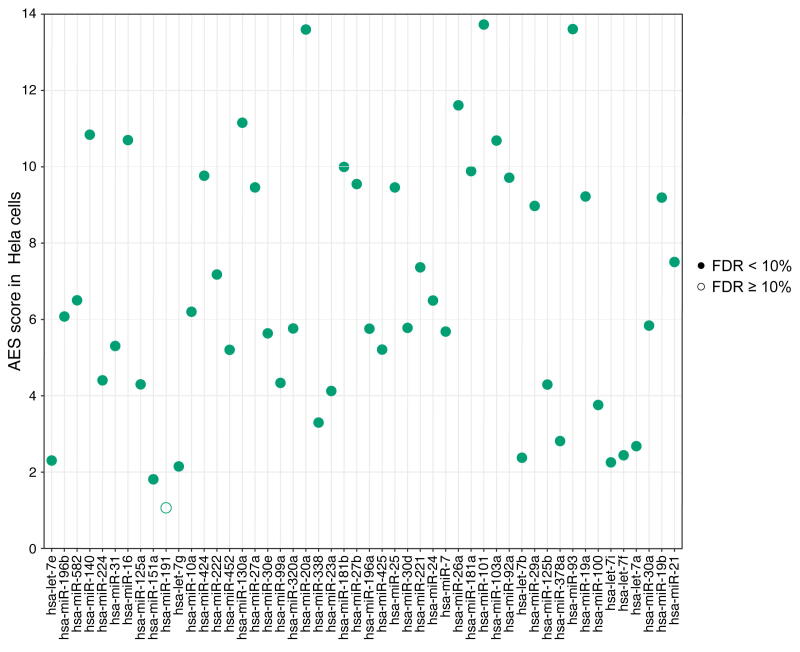
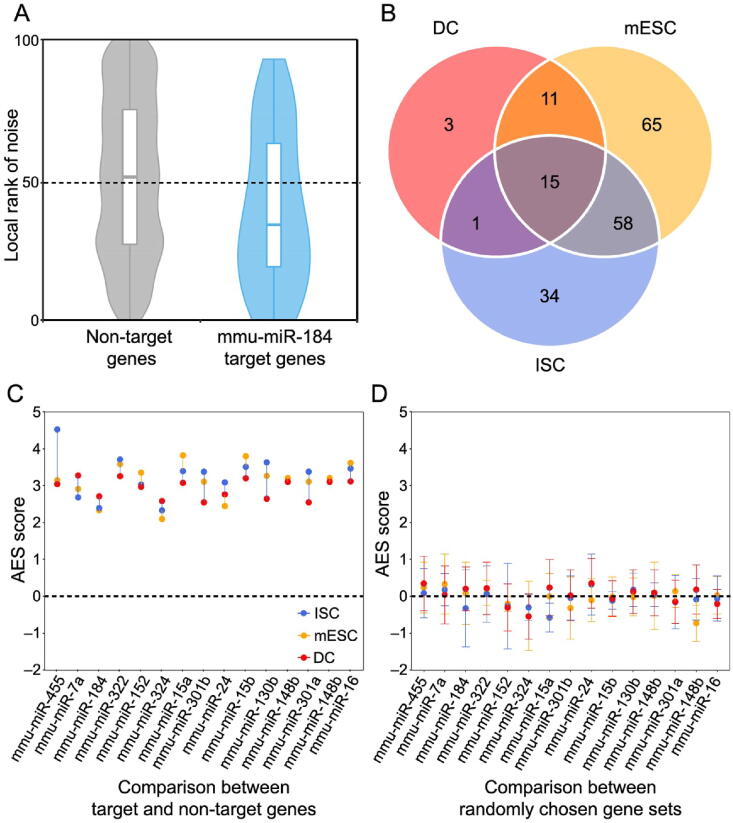
Figure 1 Gene set noise analysis reveals that miRNAs can suppress gene expression noise A. Box-violin plots quantifying the relative noise disparity of mmu-miR-184 target genes and its non-target genes. The middle line in the box is the median, and the density represents the distribution of the local rank of noise. The P value is 1.9 × 10⁻⁵, and the AES score is 2.73 for the Mann–Whitney U test. An AES score of mmu-miR-184 larger than 0 indicates that the expression noise of its target genes is lower than that of non-target genes. B. Venn diagram showing the number of overlapping and specific de-nosing miRNAs after multiple test correction (AES score > 0, FDR < 10%) among the three different cell type datasets. C. Noise disparity between the target and non-target genes for shared de-noising miRNAs of three different cell types. Different colors indicate different cell types. D. Noise disparity is absent for randomly chosen gene sets. Points and error bars indicate the mean and standard deviation, respectively, over 100 samplings. miRNA, microRNA; mmu, Mus musculus; AES, adjusted effect size; FDR, false discovery rate; mESC, mouse embryonic stem cell; ISC, intestinal stem cell; DC, dendritic cell.
Figure 1 Gene set noise analysis reveals that miRNAs can suppress gene expression noise A. Box-violin plots quantifying the relative noise disparity of mmu-miR-184 target genes and its non-target genes. The middle line in the box is the median, and the density represents the distribution of the local rank of noise. The P value is 1.9 × 10⁻⁵, and the AES score is 2.73 for the Mann–Whitney U test. An AES score of mmu-miR-184 larger than 0 indicates that the expression noise of its target genes is lower than that of non-target genes. B. Venn diagram showing the number of overlapping and specific de-nosing miRNAs after multiple test correction (AES score > 0, FDR < 10%) among the three different cell type datasets. C. Noise disparity between the target and non-target genes for shared de-noising miRNAs of three different cell types. Different colors indicate different cell types. D. Noise disparity is absent for randomly chosen gene sets. Points and error bars indicate the mean and standard deviation, respectively, over 100 samplings. miRNA, microRNA; mmu, Mus musculus; AES, adjusted effect size; FDR, false discovery rate; mESC, mouse embryonic stem cell; ISC, intestinal stem cell; DC, dendritic cell.CC BY-NC-ND · PubMed Central
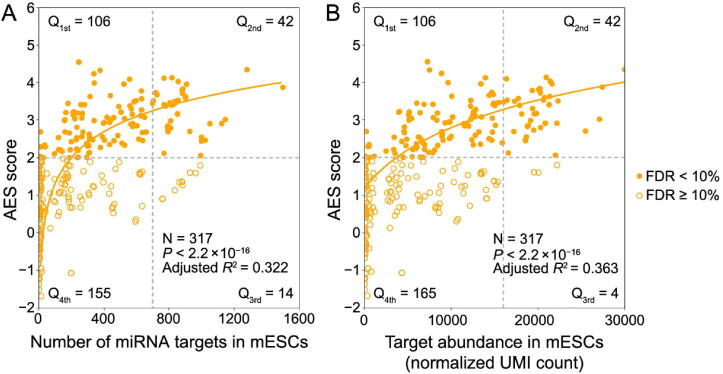
Figure 2 miRNAs with a large target pool are associated with better noise suppression A. AES score of the Mann–Whitney U test versus the number of targets across all detected miRNAs in mESCs. Curves were fitted to a+blog10(x+c), where a, b, and c were determined by least-squares approximation. The fitted parameters are shown in Table S1. The cut-off for the AES score is 2.0, and the cut-off for the number of targets is 700 in Fisher’s exact test. B. Similar points and fitting curve to those shown in (A) for target pool abundance. The cut-off for the AES score is 2.0, and the cut-off for the target pool abundance is 16,000.
Figure 2 miRNAs with a large target pool are associated with better noise suppression A. AES score of the Mann–Whitney U test versus the number of targets across all detected miRNAs in mESCs. Curves were fitted to a+blog10(x+c), where a, b, and c were determined by least-squares approximation. The fitted parameters are shown in Table S1. The cut-off for the AES score is 2.0, and the cut-off for the number of targets is 700 in Fisher’s exact test. B. Similar points and fitting curve to those shown in (A) for target pool abundance. The cut-off for the AES score is 2.0, and the cut-off for the target pool abundance is 16,000.CC BY-NC-ND · PubMed Central
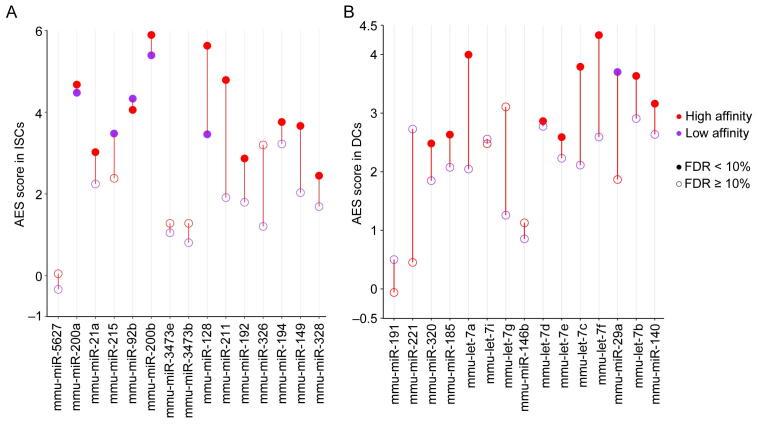
Figure 3 miRNA–target interaction strength influences the noise reduction effect A. The binding energy of all miRNA–mRNA pairs is ranked in ascending order. The endogenous miRNA target pool is indicated by wavy lines illustrating the affinity of the targets (red for high affinity, green for low affinity) and their relative abundances. B. Noise disparity between the target and non-target genes of the top 15 abundant miRNAs for strong (red) and weak (purple) interaction strength in mESCs. C. and D. AES score versus weak target pool abundance (C) and strong target pool abundance (D) across all miRNAs expressed in mESCs with strong miRNA–target interactions. Curves were fitted to a+blog10(x+c), where a, b, and c were determined by least-squares approximation. The fitted parameters are shown in Table S1.
Figure 3 miRNA–target interaction strength influences the noise reduction effect A. The binding energy of all miRNA–mRNA pairs is ranked in ascending order. The endogenous miRNA target pool is indicated by wavy lines illustrating the affinity of the targets (red for high affinity, green for low affinity) and their relative abundances. B. Noise disparity between the target and non-target genes of the top 15 abundant miRNAs for strong (red) and weak (purple) interaction strength in mESCs. C. and D. AES score versus weak target pool abundance (C) and strong target pool abundance (D) across all miRNAs expressed in mESCs with strong miRNA–target interactions. Curves were fitted to a+blog10(x+c), where a, b, and c were determined by least-squares approximation. The fitted parameters are shown in Table S1.CC BY-NC-ND · PubMed Central
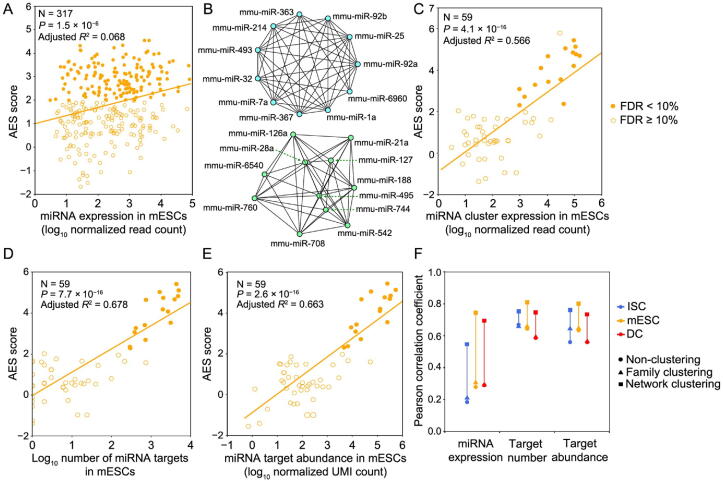
Figure 4 Gene expression noise is repressed by the miRNA coregulation subnetwork A. AES score versus miRNA expression for miRNA individuals. B. Two examples of significant de-noising miRNA subnetworks for mESCs. Each node represents a miRNA species, and edges indicate the connection of miRNAs. Other significant de-noising miRNA subnetworks are shown in Table S2. C. AES score versus miRNA expression for miRNA subnetworks. D. AES score after subnetwork clustering versus the number of targets across all cluster miRNAs in mESCs. E. Similar points and fitting curve to those shown in (C) for target pool abundance. F. Pearson correlation coefficients between miRNA features (log10 transformed) and AES scores for non-clustering, clustering by miRNA family, and clustering by network. Colors indicate different cell types. Curves in (A and C–E) were fitted to a+blog10(x) where a and b were determined by least-squares approximation. The fitted parameters are shown in Table S3.
Figure 4 Gene expression noise is repressed by the miRNA coregulation subnetwork A. AES score versus miRNA expression for miRNA individuals. B. Two examples of significant de-noising miRNA subnetworks for mESCs. Each node represents a miRNA species, and edges indicate the connection of miRNAs. Other significant de-noising miRNA subnetworks are shown in Table S2. C. AES score versus miRNA expression for miRNA subnetworks. D. AES score after subnetwork clustering versus the number of targets across all cluster miRNAs in mESCs. E. Similar points and fitting curve to those shown in (C) for target pool abundance. F. Pearson correlation coefficients between miRNA features (log10 transformed) and AES scores for non-clustering, clustering by miRNA family, and clustering by network. Colors indicate different cell types. Curves in (A and C–E) were fitted to a+blog10(x) where a and b were determined by least-squares approximation. The fitted parameters are shown in Table S3.CC BY-NC-ND · PubMed Central
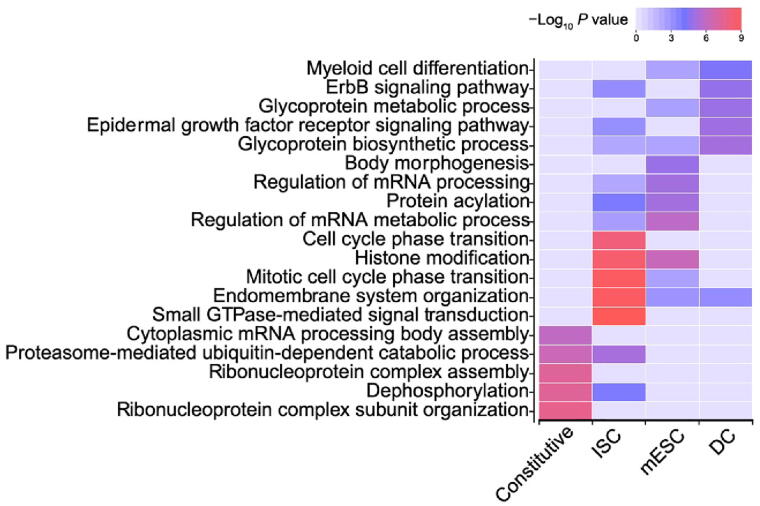
Figure 5 De-noising miRNA subnetworks correspond to cell types and cell functions Top 5 enriched GO terms with their respective P values (ClusterProfiler) for target genes in the constitutive de-noising miRNA subnetworks and cell type-specific de-noising miRNA subnetworks in mESCs, ISCs, and DCs. GO, Gene Ontology.
Figure 5 De-noising miRNA subnetworks correspond to cell types and cell functions Top 5 enriched GO terms with their respective P values (ClusterProfiler) for target genes in the constitutive de-noising miRNA subnetworks and cell type-specific de-noising miRNA subnetworks in mESCs, ISCs, and DCs. GO, Gene Ontology.CC BY-NC-ND · PubMed Central
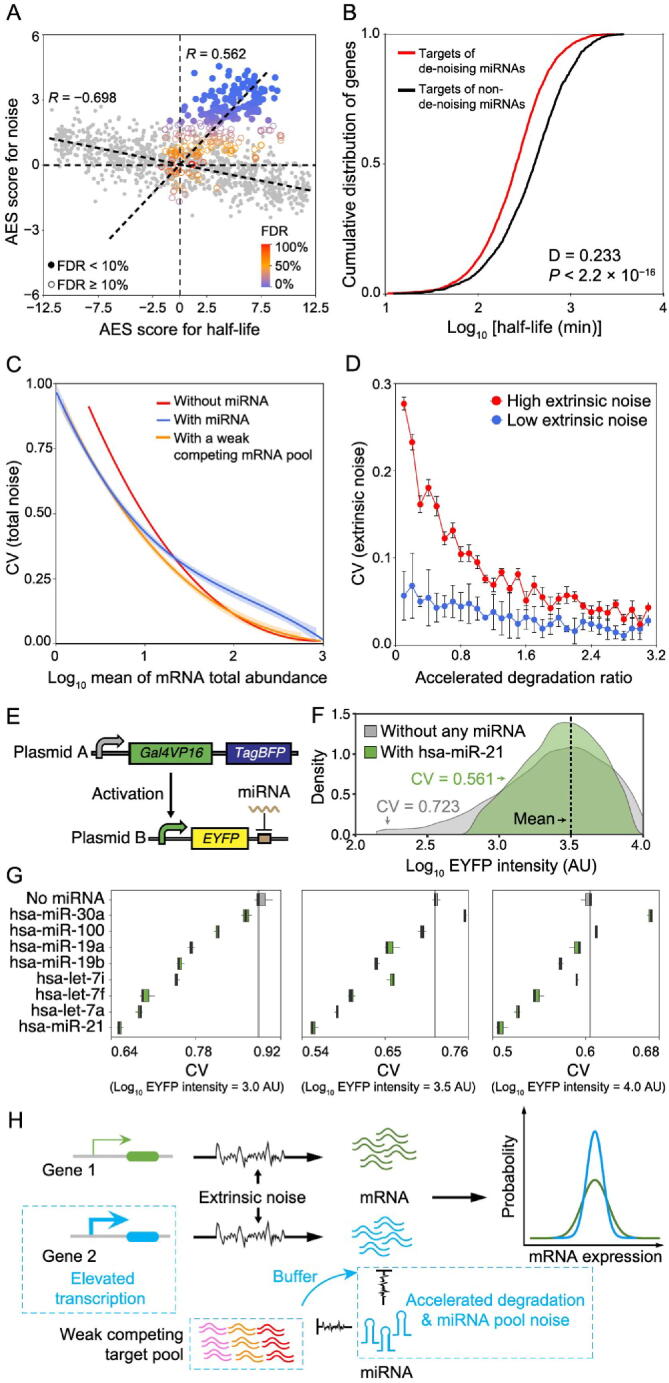
Figure 6 miRNAs accelerate target degradation to resist environmental disturbances A. Scatterplot of AES scores of gene expression noise versus AES scores of mRNA half-life for random gene sets (gray) and real miRNA target gene sets (color) in mESCs. Random gene sets are constructed with varying sample sizes (100–2000) by weighted sampling of mRNAs according to half-life. The AES score is defined as the adjusted statistic for the Mann–Whitney U test, where a value of 0 corresponds to no difference between the gene sets and the background, while a value larger than 0 corresponds to lower noise and lower half-life of the gene sets than those of the background. The Spearman correlation coefficient between AES scores of half-life and noise for the random sample was − 0.698 but was 0.562 for real miRNA target gene sets in mESCs. The similar results obtained in ISC and DC datasets are shown in Figure S12A and B. B. Targets of de-noising miRNAs have a significantly shorter half-life than those targets of non-de-noising miRNAs in mESCs. C. Total noise (intrinsic and extrinsic noises) of an mRNA as a function of mean mRNA total expression (sum abundance of free mRNA and mRNA–miRNA complex). The shadows indicate 100 repeated simulation trials. D. The extrinsic noise of miRNA-regulated genes decreases as the accelerated degradation increases. The error bars indicate the standard deviation of 100 repeated simulation trials. E. Schematic diagram of the synthetic gene circuits used for observing expression noise modulated by miRNA. F. EYFP intensities of synthetic gene circuits without the regulation of miRNA and with the regulation of hsa-miR-21. Cells were binned by log10 TagBFP in sliding windows with bin width equal to 0.2, and then cells in the bin with mean intensity of EYFP (log10 transformed) nearest to 1 × 103.5 AU were shown. G. Noise levels of synthetic gene circuits with or without the regulation of miRNAs under different mean intensities of EYFP (log10 transformed). Cells were selected by the same method described in (F). Three biological replicates were performed. H. Summary scheme showing accelerated degradation with compensatory elevated transcriptional activation of miRNA targets provides resistance to extrinsic fluctuations. In addition, the large competing target pool with weak binding affinity could buffer miRNA pool noise. Therefore, the miRNA target gene (blue) has lower noise than the non-target gene (green) at equal mRNA expression levels globally. AU, arbitrary unit.
Figure 6 miRNAs accelerate target degradation to resist environmental disturbances A. Scatterplot of AES scores of gene expression noise versus AES scores of mRNA half-life for random gene sets (gray) and real miRNA target gene sets (color) in mESCs. Random gene sets are constructed with varying sample sizes (100–2000) by weighted sampling of mRNAs according to half-life. The AES score is defined as the adjusted statistic for the Mann–Whitney U test, where a value of 0 corresponds to no difference between the gene sets and the background, while a value larger than 0 corresponds to lower noise and lower half-life of the gene sets than those of the background. The Spearman correlation coefficient between AES scores of half-life and noise for the random sample was − 0.698 but was 0.562 for real miRNA target gene sets in mESCs. The similar results obtained in ISC and DC datasets are shown in Figure S12A and B. B. Targets of de-noising miRNAs have a significantly shorter half-life than those targets of non-de-noising miRNAs in mESCs. C. Total noise (intrinsic and extrinsic noises) of an mRNA as a function of mean mRNA total expression (sum abundance of free mRNA and mRNA–miRNA complex). The shadows indicate 100 repeated simulation trials. D. The extrinsic noise of miRNA-regulated genes decreases as the accelerated degradation increases. The error bars indicate the standard deviation of 100 repeated simulation trials. E. Schematic diagram of the synthetic gene circuits used for observing expression noise modulated by miRNA. F. EYFP intensities of synthetic gene circuits without the regulation of miRNA and with the regulation of hsa-miR-21. Cells were binned by log10 TagBFP in sliding windows with bin width equal to 0.2, and then cells in the bin with mean intensity of EYFP (log10 transformed) nearest to 1 × 103.5 AU were shown. G. Noise levels of synthetic gene circuits with or without the regulation of miRNAs under different mean intensities of EYFP (log10 transformed). Cells were selected by the same method described in (F). Three biological replicates were performed. H. Summary scheme showing accelerated degradation with compensatory elevated transcriptional activation of miRNA targets provides resistance to extrinsic fluctuations. In addition, the large competing target pool with weak binding affinity could buffer miRNA pool noise. Therefore, the miRNA target gene (blue) has lower noise than the non-target gene (green) at equal mRNA expression levels globally. AU, arbitrary unit.CC BY-NC-ND · PubMed Central
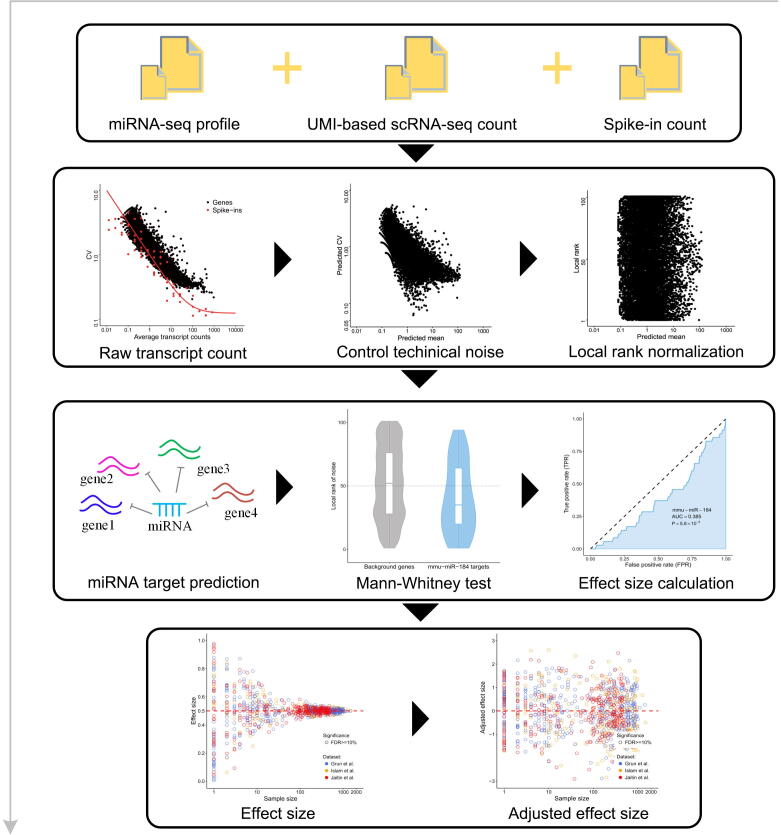
Supplementary figure 1 The workflow of gene expression noise analysis.
Supplementary figure 1 The workflow of gene expression noise analysis.CC BY-NC-ND · PubMed Central
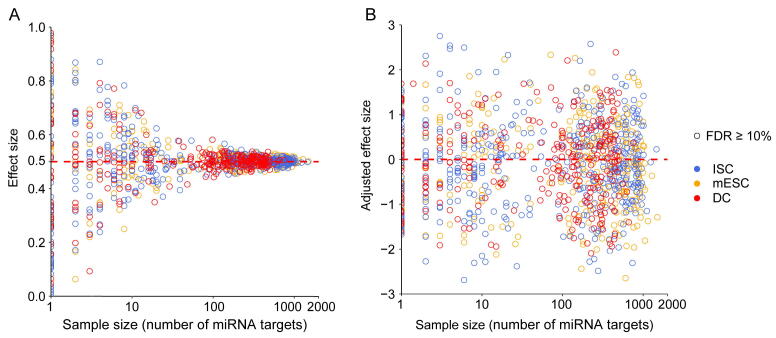
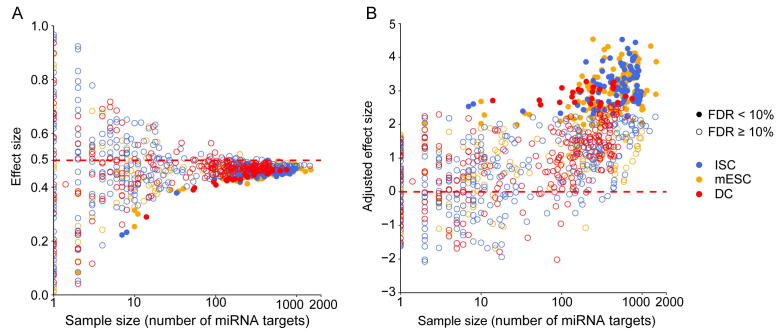
Supplementary figure 2 The correlation between effect size and sample size for the Mann–Whitney U test before correction. A. Validating the correlation between effect size and test sample size by sampling background samples and variable test samples (x-axis) from all genes randomly in three cell types of datasets. The three cell types of datasets are highlighted in different colors. And all tests are not significant in the random experiments (FDR ≥ 10%). This simulation result shows that the effect size is strongly correlated with the test sample size. B. An additional effect size correction step to remove the effect of sample size by calculating the adjusted effect size as z-score according to the distribution of effect size. This plot shows the adjusted effect size after correction.
Supplementary figure 2 The correlation between effect size and sample size for the Mann–Whitney U test before correction. A. Validating the correlation between effect size and test sample size by sampling background samples and variable test samples (x-axis) from all genes randomly in three cell types of datasets. The three cell types of datasets are highlighted in different colors. And all tests are not significant in the random experiments (FDR ≥ 10%). This simulation result shows that the effect size is strongly correlated with the test sample size. B. An additional effect size correction step to remove the effect of sample size by calculating the adjusted effect size as z-score according to the distribution of effect size. This plot shows the adjusted effect size after correction.CC BY-NC-ND · PubMed Central
Supplementary figure 3 The correlation between effect size and sample size for the Mann–Whitney U test after correction. A. Effect size versus test sample size (the number of targets) for real data. This result shows that there was a noise bias for all three cell line datasets. Effect size less than 0.5 indicates that the local rank CV of miRNA target genes is smaller than non-targets. B. An additional effect size correction step for real data.
Supplementary figure 3 The correlation between effect size and sample size for the Mann–Whitney U test after correction. A. Effect size versus test sample size (the number of targets) for real data. This result shows that there was a noise bias for all three cell line datasets. Effect size less than 0.5 indicates that the local rank CV of miRNA target genes is smaller than non-targets. B. An additional effect size correction step for real data.CC BY-NC-ND · PubMed Central
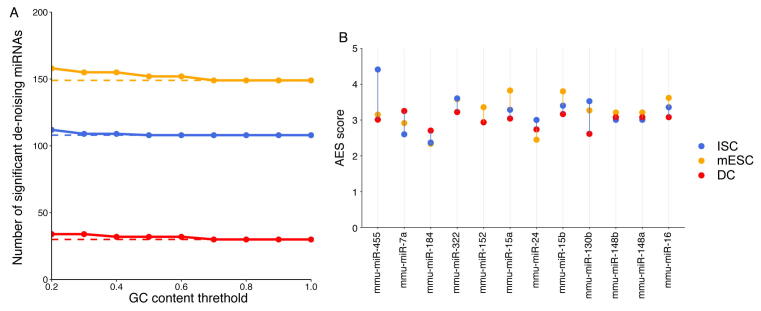
Supplementary figure 4 The number of de-noising miRNAs and AES score are not sensitive to GC content of non-target genes. A. The curves show the number of significant de-noising miRNAs varying with GC content threshold. This is used to select the non-miRNA target genes of lower GC content. The colors indicate different cell types. B. Noise disparity between the target genes and non-target genes for shared de-noising miRNAs of three different cell types. The GC content threshold is 0.5.
Supplementary figure 4 The number of de-noising miRNAs and AES score are not sensitive to GC content of non-target genes. A. The curves show the number of significant de-noising miRNAs varying with GC content threshold. This is used to select the non-miRNA target genes of lower GC content. The colors indicate different cell types. B. Noise disparity between the target genes and non-target genes for shared de-noising miRNAs of three different cell types. The GC content threshold is 0.5.CC BY-NC-ND · PubMed Central
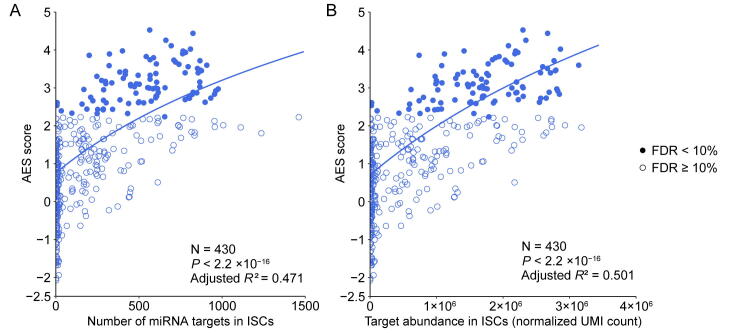
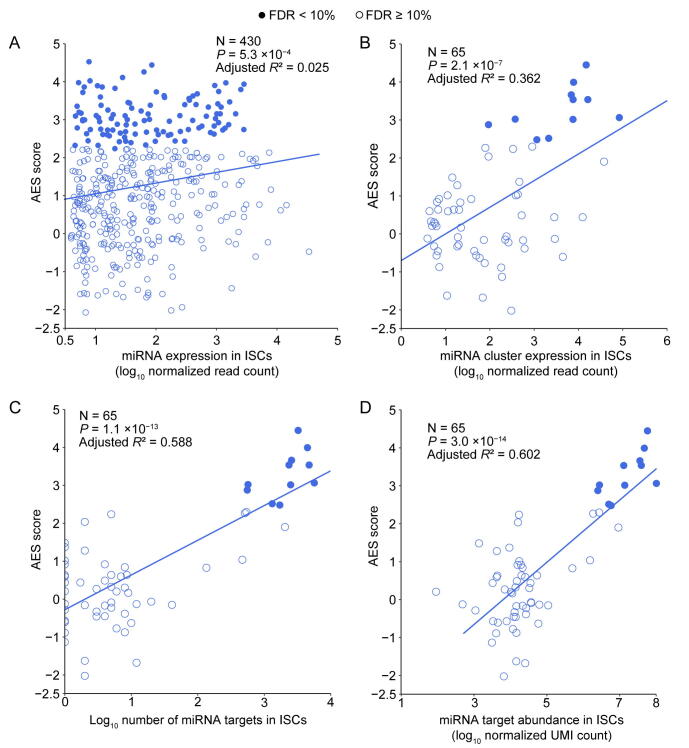
Supplementary figure 5 miRNAs with a large target pool associated with better noise suppression for ISCs. A. AES score of the Mann–Whitney U test versus the number of targets across all detected miRNA in ISCs. Curves were fitted to a+blog10(x+c) where a, b, and c were determined by least-squares approximation. Fitted parameters are shown in Table S1. B. Similar fitting curve to those shown in A for targets pool abundance.
Supplementary figure 5 miRNAs with a large target pool associated with better noise suppression for ISCs. A. AES score of the Mann–Whitney U test versus the number of targets across all detected miRNA in ISCs. Curves were fitted to a+blog10(x+c) where a, b, and c were determined by least-squares approximation. Fitted parameters are shown in Table S1. B. Similar fitting curve to those shown in A for targets pool abundance.CC BY-NC-ND · PubMed Central
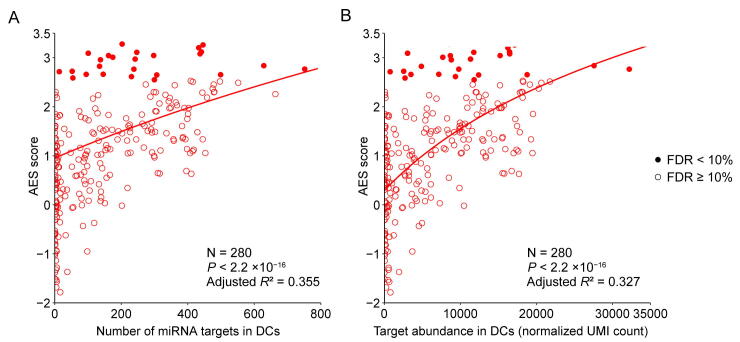
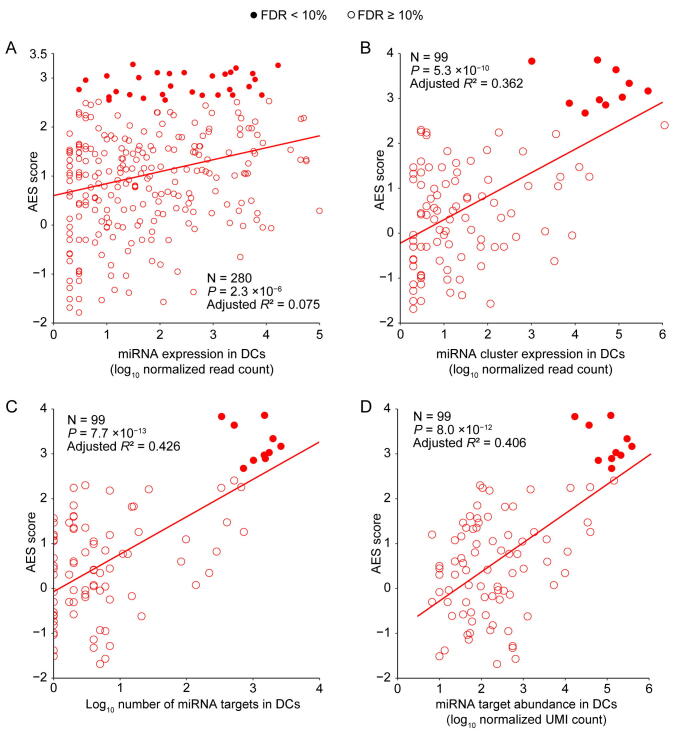
Supplementary figure 6 miRNAs with a large target pool associated with better noise suppression for DCs. A. AES score of the Mann–Whitney U test versus the number of targets across all detected miRNA in DCs. Curves were fitted to a+blog10(x+c) where a, b, and c were determined by least-squares approximation. Fitted parameters are shown in Table S1. B. Similar fitting curve to those shown in A for targets pool abundance.
Supplementary figure 6 miRNAs with a large target pool associated with better noise suppression for DCs. A. AES score of the Mann–Whitney U test versus the number of targets across all detected miRNA in DCs. Curves were fitted to a+blog10(x+c) where a, b, and c were determined by least-squares approximation. Fitted parameters are shown in Table S1. B. Similar fitting curve to those shown in A for targets pool abundance.CC BY-NC-ND · PubMed Central
Supplementary figure 7 Strong interactions will enhance the effect of noise reduction. A. and B. Noise disparity between the target genes of Top15 abundant miRNA for strong (red) and weak interaction strength (purple) in ISCs (left) and DCs (right) respectively.
Supplementary figure 7 Strong interactions will enhance the effect of noise reduction. A. and B. Noise disparity between the target genes of Top15 abundant miRNA for strong (red) and weak interaction strength (purple) in ISCs (left) and DCs (right) respectively.CC BY-NC-ND · PubMed Central
Supplementary figure 8 Gene expression noise is repressed by miRNA co-regulation sub-network for ISCs. A. and B. AES score of the Mann–Whitney U test versus miRNA expression for miRNA individuals and sub-network respectively in ISCs. Curves were fitted to a+blog10(x) where a and b were determined by least-squares approximation. Fitted parameters are shown in Table S3. C. AES score of the Mann–Whitney U test after sub-network clustering versus the number of targets across all cluster miRNA in ISCs. D. Similar fitting curve to those shown in C for targets pool abundance.
Supplementary figure 8 Gene expression noise is repressed by miRNA co-regulation sub-network for ISCs. A. and B. AES score of the Mann–Whitney U test versus miRNA expression for miRNA individuals and sub-network respectively in ISCs. Curves were fitted to a+blog10(x) where a and b were determined by least-squares approximation. Fitted parameters are shown in Table S3. C. AES score of the Mann–Whitney U test after sub-network clustering versus the number of targets across all cluster miRNA in ISCs. D. Similar fitting curve to those shown in C for targets pool abundance.CC BY-NC-ND · PubMed Central
Supplementary figure 9 Gene expression noise is repressed by miRNA co-regulation sub-network for DCs. A. and B. AES score of Mann–Whitney U test versus miRNA expression for miRNA individuals and sub-network respectively in DCs. Curves were fitted to a+blog10(x) where a and b were determined by least-squares approximation. Fitted parameters are shown in Table S3. C. AES score of the Mann–Whitney U test after sub-network clustering versus the number of targets across all cluster miRNA in DCs. D. Similar fitting curve to those shown in C for targets pool abundance.
Supplementary figure 9 Gene expression noise is repressed by miRNA co-regulation sub-network for DCs. A. and B. AES score of Mann–Whitney U test versus miRNA expression for miRNA individuals and sub-network respectively in DCs. Curves were fitted to a+blog10(x) where a and b were determined by least-squares approximation. Fitted parameters are shown in Table S3. C. AES score of the Mann–Whitney U test after sub-network clustering versus the number of targets across all cluster miRNA in DCs. D. Similar fitting curve to those shown in C for targets pool abundance.CC BY-NC-ND · PubMed Central
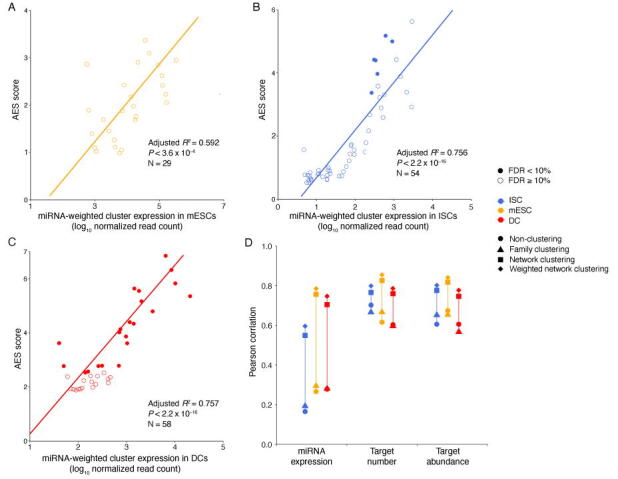
Supplementary figure 10 AES scores of the miRNA coregulation subnetwork for weighted network clustering. A.–C. AES score of Mann–Whitney U test versus miRNA expression for weighted network clustering in mESCs, ISCs, and DCs, respectively. D. Pearson correlation coefficients between miRNA features (log transformed) and AES scores for non-clustering, clustering by miRNA family, clustering by the network, and weighted network clustering. Colors indicate different cell types.
Supplementary figure 10 AES scores of the miRNA coregulation subnetwork for weighted network clustering. A.–C. AES score of Mann–Whitney U test versus miRNA expression for weighted network clustering in mESCs, ISCs, and DCs, respectively. D. Pearson correlation coefficients between miRNA features (log transformed) and AES scores for non-clustering, clustering by miRNA family, clustering by the network, and weighted network clustering. Colors indicate different cell types.CC BY-NC-ND · PubMed Central
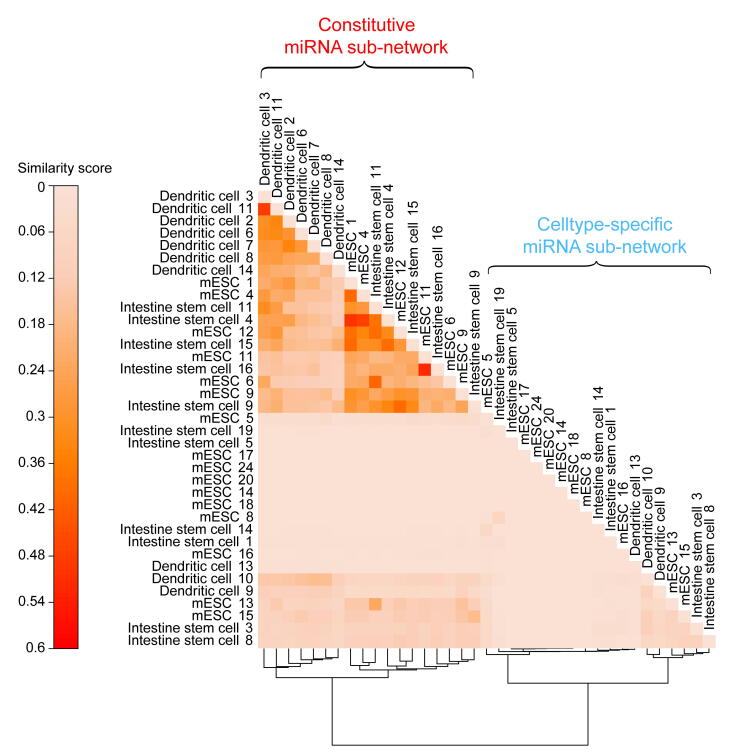
Supplementary figure 11 Similarity matrix for all miRNA sub-networks from three cell types. Sub-networks were divided into constitutive sub-networks and cell-type-specific sub-networks by hierarchical clustering of the similarity matrix. The sub-network similarity matrix was calculated using the Jaccard similarity of their target genes. The numbers in the network name indicate the sub-networks ID. Details of miRNAs of sub-network are shown in Table S2.
Supplementary figure 11 Similarity matrix for all miRNA sub-networks from three cell types. Sub-networks were divided into constitutive sub-networks and cell-type-specific sub-networks by hierarchical clustering of the similarity matrix. The sub-network similarity matrix was calculated using the Jaccard similarity of their target genes. The numbers in the network name indicate the sub-networks ID. Details of miRNAs of sub-network are shown in Table S2.CC BY-NC-ND · PubMed Central
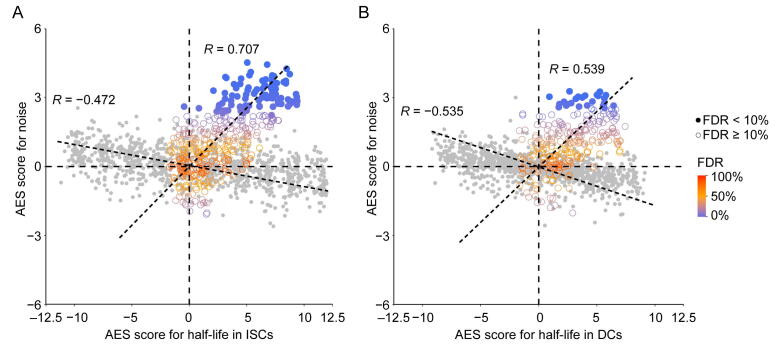
Supplementary figure 12 The correlation between noise and mRNA half-life. A. and B. Scatterplots of AES scores of gene expression noise versus AES scores of mRNA half-life for random gene sets (gray) and real miRNA target gene sets (color) for ISC (A) and DC (B) datasets. Random gene sets are constructed with varying sample size (200–2000) by weighted sampling of mRNAs according to half-life. In (A), Spearman correlation coefficient between AES scores of half-life and noise for the random sample was −0.472, but was 0.707 for real miRNA target gene sets in ISCs; in (B), Spearman correlation coefficient between AES scores of half-life and noise for the random sample was −0.535, but was 0.539 for real miRNA target gene sets in DCs.
Supplementary figure 12 The correlation between noise and mRNA half-life. A. and B. Scatterplots of AES scores of gene expression noise versus AES scores of mRNA half-life for random gene sets (gray) and real miRNA target gene sets (color) for ISC (A) and DC (B) datasets. Random gene sets are constructed with varying sample size (200–2000) by weighted sampling of mRNAs according to half-life. In (A), Spearman correlation coefficient between AES scores of half-life and noise for the random sample was −0.472, but was 0.707 for real miRNA target gene sets in ISCs; in (B), Spearman correlation coefficient between AES scores of half-life and noise for the random sample was −0.535, but was 0.539 for real miRNA target gene sets in DCs.CC BY-NC-ND · PubMed Central
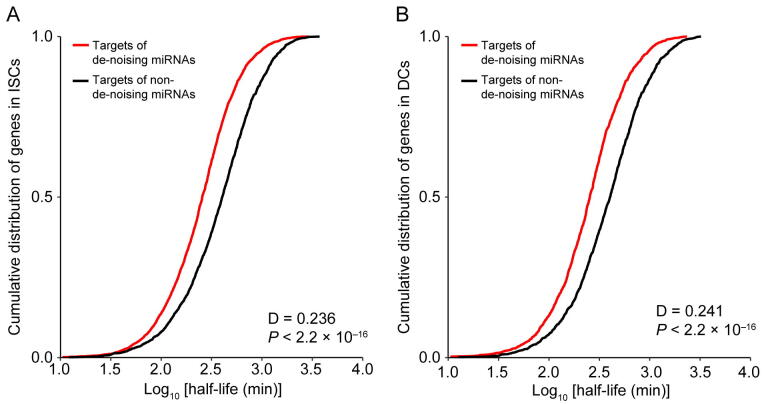
Supplementary figure 13 The distribution of mRNA half-life time for miRNA targets. A. and B. Compared to the mean mRNA half-lives cumulative distribution of de-noising miRNAs target genes with target genes of remain miRNAs in ISCs and DCs respectively. We observed that the targets of de-noising miRNAs have a much shorter half-life than those targets of remain miRNAs.
Supplementary figure 13 The distribution of mRNA half-life time for miRNA targets. A. and B. Compared to the mean mRNA half-lives cumulative distribution of de-noising miRNAs target genes with target genes of remain miRNAs in ISCs and DCs respectively. We observed that the targets of de-noising miRNAs have a much shorter half-life than those targets of remain miRNAs.CC BY-NC-ND · PubMed Central
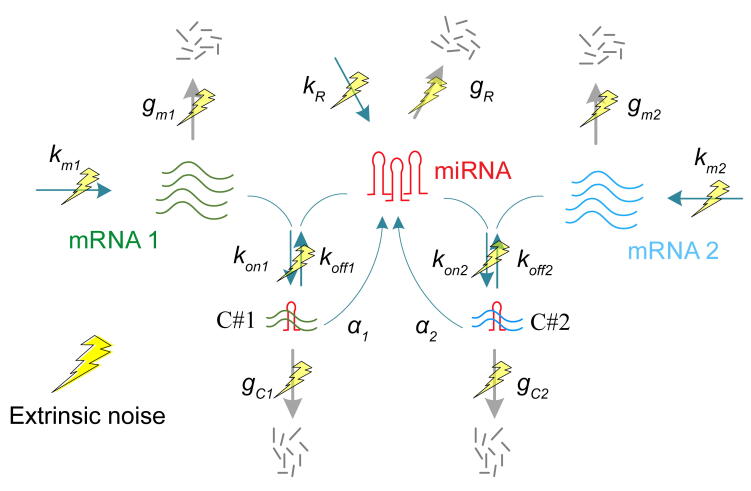
Supplementary figure 14 A kinetics model for miRNA regulation. A coarse-grained model for expression noise of a miRNA regulated gene. Noise in mRNA expression originates from stochastic biochemical reactions in the production of the mRNA (intrinsic noise) and fluctuation in the reaction kinetic rates caused by variable external factors in the environment (extrinsic noise; yellow lightning symbols).
Supplementary figure 14 A kinetics model for miRNA regulation. A coarse-grained model for expression noise of a miRNA regulated gene. Noise in mRNA expression originates from stochastic biochemical reactions in the production of the mRNA (intrinsic noise) and fluctuation in the reaction kinetic rates caused by variable external factors in the environment (extrinsic noise; yellow lightning symbols).CC BY-NC-ND · PubMed Central
Supplementary figure 15 Noise disparity between the target genes and non-target genes for HeLa cells. 49 significant de-nosing miRNAs were found among the top 50 expressed miRNAs in HeLa cells. The miRNAs are arranged left-to-right by expression level (an increasing expression to the right).
Supplementary figure 15 Noise disparity between the target genes and non-target genes for HeLa cells. 49 significant de-nosing miRNAs were found among the top 50 expressed miRNAs in HeLa cells. The miRNAs are arranged left-to-right by expression level (an increasing expression to the right).CC BY-NC-ND · PubMed Central
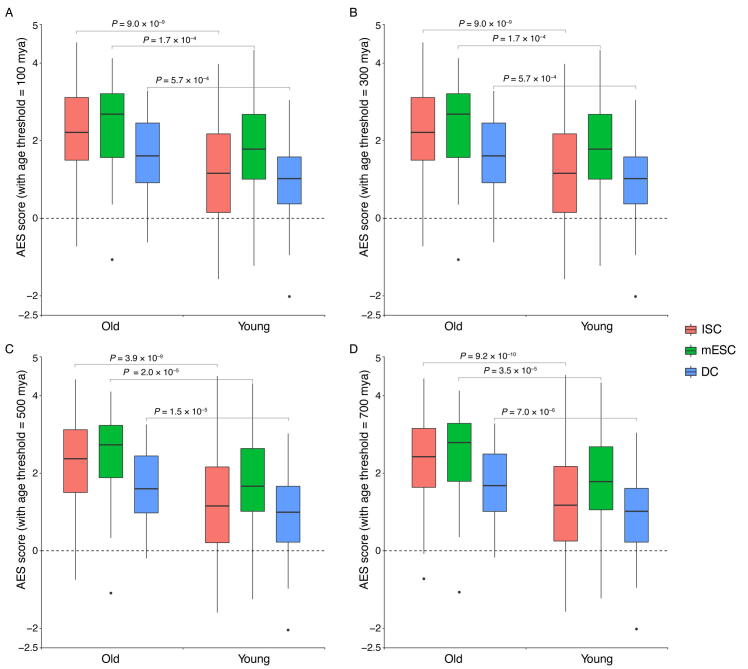
Supplementary figure 16 The older miRNA families have shown a stronger effect in noise reduction than the younger miRNA. Box plots quantifying the ability of de-noising of old and young miRNAs. The unit of miRNA family age is millions of years ago (mya) and the age of the mouse miRNA family is between 37 and 1036 mya. The miRNA families whose age is less than the threshold are defined as the young miRNA families and the remaining miRNA families are defined as the old miRNA families. For different age thresholds, Mann–Whitney U test is used to quantify the difference in noise reduction between young and older miRNA families., and the age threshold is 100, 300, 500, 700 for subplots A, B, C, D respectively.
Supplementary figure 16 The older miRNA families have shown a stronger effect in noise reduction than the younger miRNA. Box plots quantifying the ability of de-noising of old and young miRNAs. The unit of miRNA family age is millions of years ago (mya) and the age of the mouse miRNA family is between 37 and 1036 mya. The miRNA families whose age is less than the threshold are defined as the young miRNA families and the remaining miRNA families are defined as the old miRNA families. For different age thresholds, Mann–Whitney U test is used to quantify the difference in noise reduction between young and older miRNA families., and the age threshold is 100, 300, 500, 700 for subplots A, B, C, D respectively.CC BY-NC-ND · PubMed Central
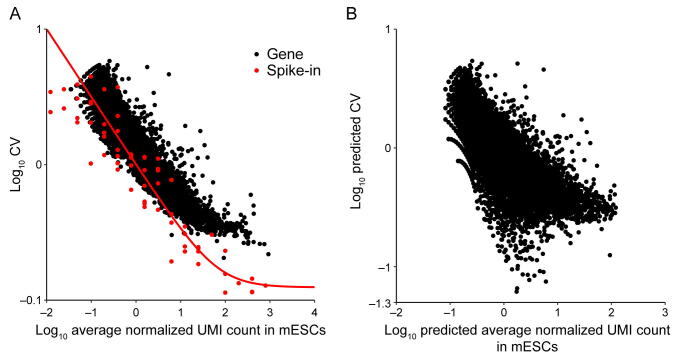
Supplementary figure 17 Noise quantification and normalization for transcripts in mESCs. A. CV of transcript counts versus average transcript count for all detected genes in raw data from a scRNA-seq experiment in mESCs. Black dots and red dots indicate true genes and spike-ins, respectively. B. Predicted CV of transcript counts versus predicted average transcript count for all detected genes after removing technical noise with the help of spike-ins.
Supplementary figure 17 Noise quantification and normalization for transcripts in mESCs. A. CV of transcript counts versus average transcript count for all detected genes in raw data from a scRNA-seq experiment in mESCs. Black dots and red dots indicate true genes and spike-ins, respectively. B. Predicted CV of transcript counts versus predicted average transcript count for all detected genes after removing technical noise with the help of spike-ins.CC BY-NC-ND · PubMed Central
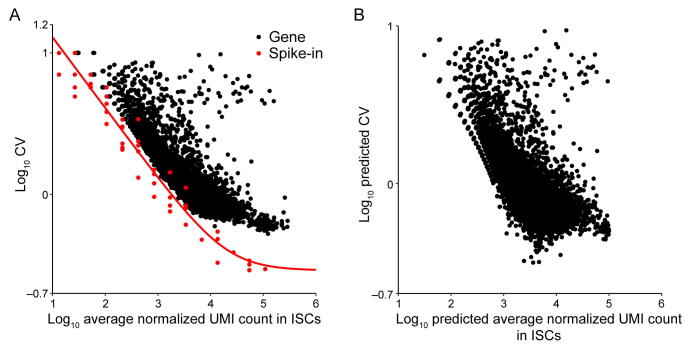
Supplementary figure 18 Noise quantification and normalization for transcripts in ISCs. A. CV of transcript counts versus average transcript count for all detected genes in raw data from a scRNA-seq experiment in ISCs. Black dots and red dots indicate true genes and spike-ins, respectively. B. Predicted CV of transcript counts versus predicted average transcript count for all detected genes after removing technical noise with the help of spike-ins.
Supplementary figure 18 Noise quantification and normalization for transcripts in ISCs. A. CV of transcript counts versus average transcript count for all detected genes in raw data from a scRNA-seq experiment in ISCs. Black dots and red dots indicate true genes and spike-ins, respectively. B. Predicted CV of transcript counts versus predicted average transcript count for all detected genes after removing technical noise with the help of spike-ins.CC BY-NC-ND · PubMed Central
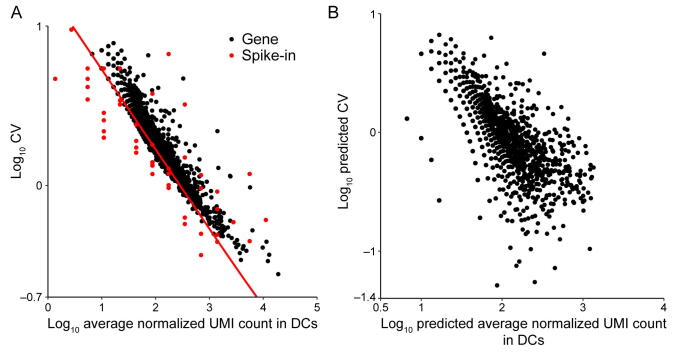
Supplementary figure 19 Noise quantification and normalization for transcripts in DCs. A. CV of transcript counts versus average transcript count for all detected genes in raw data from a scRNA-seq experiment in DCs. Black dots and red dots indicate true genes and spike-ins, respectively. B. Predicted CV of transcript counts versus predicted average transcript count for all detected genes after removing technical noise with the help of spike-ins.
Supplementary figure 19 Noise quantification and normalization for transcripts in DCs. A. CV of transcript counts versus average transcript count for all detected genes in raw data from a scRNA-seq experiment in DCs. Black dots and red dots indicate true genes and spike-ins, respectively. B. Predicted CV of transcript counts versus predicted average transcript count for all detected genes after removing technical noise with the help of spike-ins.CC BY-NC-ND · PubMed Central
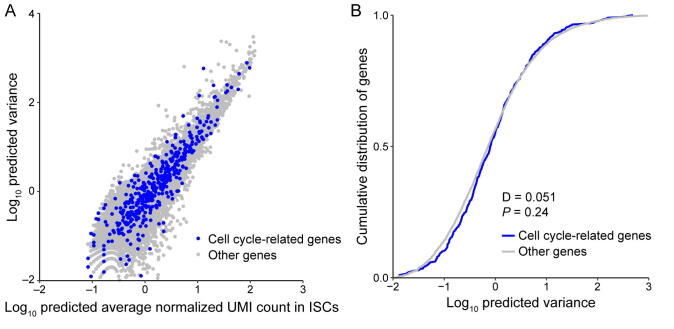
Supplementary figure 20 Comparison of variance between cell cycle-related genes and other genes for mouse embryonic stem cells. A. The predicted variance of transcript count versus mean transcript counts across the entire detected genes for mESCs. Cell cycle related genes are highlighted as blue circles. This set of genes consist of all genes containing the “cell cycle” term in whole Gene Ontology terms of “biological process”. B. Compared to the predicted variance cumulative distribution of cell cycle related genes with other genes, cell cycle related genes did not show increased variability and were thus not to lead to false results in the downstream noise analysis.
Supplementary figure 20 Comparison of variance between cell cycle-related genes and other genes for mouse embryonic stem cells. A. The predicted variance of transcript count versus mean transcript counts across the entire detected genes for mESCs. Cell cycle related genes are highlighted as blue circles. This set of genes consist of all genes containing the “cell cycle” term in whole Gene Ontology terms of “biological process”. B. Compared to the predicted variance cumulative distribution of cell cycle related genes with other genes, cell cycle related genes did not show increased variability and were thus not to lead to false results in the downstream noise analysis.CC BY-NC-ND · PubMed Central
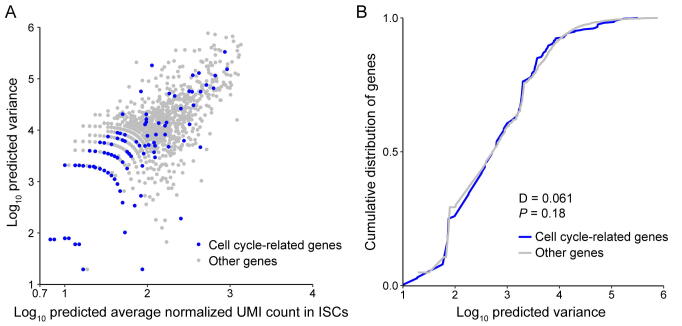
Supplementary figure 21 Comparison of variance between cell cycle related genes and other genes for ISCs. A. The predicted variance of transcript count versus mean transcript counts across the entire detected genes for ISCs. Cell cycle related genes are highlighted as blue circles. This set of genes consist of all genes containing the “cell cycle” term in whole Gene Ontology terms of “biological process”. B. Compared to the predicted variance cumulative distribution of cell cycle related genes with other genes, cell cycle related genes did not show increased variability and were thus not to lead to false results in the downstream noise analysis.
Supplementary figure 21 Comparison of variance between cell cycle related genes and other genes for ISCs. A. The predicted variance of transcript count versus mean transcript counts across the entire detected genes for ISCs. Cell cycle related genes are highlighted as blue circles. This set of genes consist of all genes containing the “cell cycle” term in whole Gene Ontology terms of “biological process”. B. Compared to the predicted variance cumulative distribution of cell cycle related genes with other genes, cell cycle related genes did not show increased variability and were thus not to lead to false results in the downstream noise analysis.CC BY-NC-ND · PubMed Central
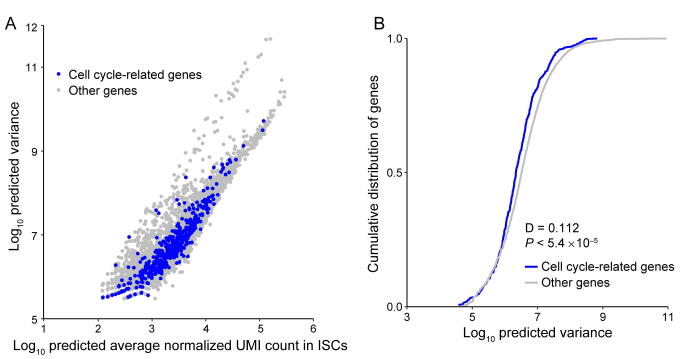
Supplementary figure 22 Comparison of variance between cell cycle related genes and other genes for DCs. A. The predicted variance of transcript count versus mean transcript counts across the entire detected genes for DCs. Cell cycle related genes are highlighted as blue circles. This set of genes consist of all genes containing the “cell cycle” term in whole Gene Ontology terms of “biological process”. B. Compared to the predicted variance cumulative distribution of cell cycle related genes with other genes, cell cycle related genes did not show increased variability and were thus not to lead to false results in the downstream noise analysis.
Supplementary figure 22 Comparison of variance between cell cycle related genes and other genes for DCs. A. The predicted variance of transcript count versus mean transcript counts across the entire detected genes for DCs. Cell cycle related genes are highlighted as blue circles. This set of genes consist of all genes containing the “cell cycle” term in whole Gene Ontology terms of “biological process”. B. Compared to the predicted variance cumulative distribution of cell cycle related genes with other genes, cell cycle related genes did not show increased variability and were thus not to lead to false results in the downstream noise analysis.CC BY-NC-ND · PubMed Central
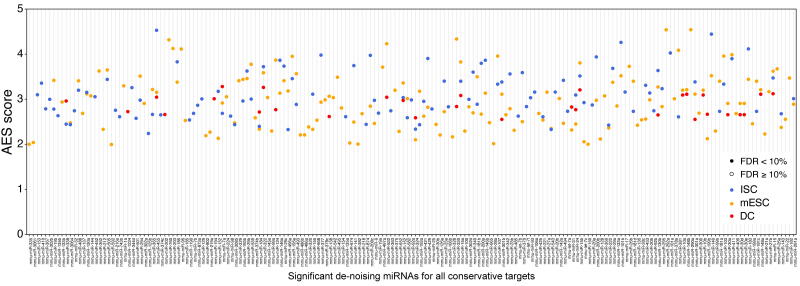
Supplementary figure 23 The significant de-noising miRNAs for all conservative targets. Define the miRNA target genes as all conserved miRNA targets; 149, 108, 30 miRNAs with significant positive AES scores were identified in mESCs, ISCs, and DCs, respectively.
Supplementary figure 23 The significant de-noising miRNAs for all conservative targets. Define the miRNA target genes as all conserved miRNA targets; 149, 108, 30 miRNAs with significant positive AES scores were identified in mESCs, ISCs, and DCs, respectively.CC BY-NC-ND · PubMed Central
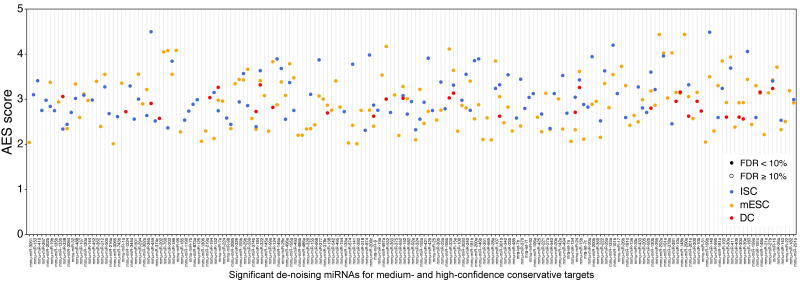
Supplementary figure 24 The significant de-noising miRNAs for medium- and high-confidence conservative targets. Define the miRNA target genes as the conserved targets whose cumulative context score ++ larger than 30%; 145, 108, and 29 miRNAs with significant positive AES scores were identified in mESCs, ISCs, and DCs, respectively.
Supplementary figure 24 The significant de-noising miRNAs for medium- and high-confidence conservative targets. Define the miRNA target genes as the conserved targets whose cumulative context score ++ larger than 30%; 145, 108, and 29 miRNAs with significant positive AES scores were identified in mESCs, ISCs, and DCs, respectively.CC BY-NC-ND · PubMed Central
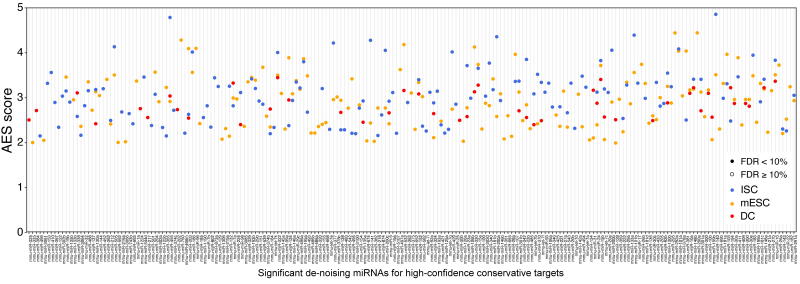
Supplementary figure 25 The significant de-noising miRNAs for high-confidence conservative targets. Define the miRNA target genes as conserved miRNA targets whose cumulative context score ++ is larger than 60%; 150, 132, and 46 miRNAs with significant positive AES scores were identified in mESCs, ISCs, and DCs, respectively.
Supplementary figure 25 The significant de-noising miRNAs for high-confidence conservative targets. Define the miRNA target genes as conserved miRNA targets whose cumulative context score ++ is larger than 60%; 150, 132, and 46 miRNAs with significant positive AES scores were identified in mESCs, ISCs, and DCs, respectively.CC BY-NC-ND · PubMed Central

Verification

Claims the paper makes

The claims and statistics of this paper haven’t been checked yet.

Run the check — free, no account needed. It reads the open-access text and checks the sources it cites.

A few free checks a day · papers already verified open instantly · results are public

Claims other papers make about this one

Each is checked against this paper’s own text: does it say what the citing paper says it does?

Self-check

Percentages, sums and reported differences re-computed from the paper’s own numbers.

The self-check needs the paper’s full text.

Citations

Cites

Show all 11 references

Research works printed but not linked: 63

  1. Munsky, 2012, Using gene expression noise to understand gene regulation, Science, 336, 183, 10.1126/science.1216379 · DOI · Paper page
  2. Swain, 2002, Intrinsic and extrinsic contributions to stochasticity in gene expression, Proc Natl Acad Sci U S A, 99, 12795, 10.1073/pnas.162041399 · DOI · Paper page
  3. Elowitz, 2002, Stochastic gene expression in a single cell, Science, 297, 1183, 10.1126/science.1070919 · DOI · Paper page
  4. Eldar, 2010, Functional roles for noise in genetic circuits, Nature, 467, 167, 10.1038/nature09326 · DOI
  5. Del Giudice, 2018, On the role of extrinsic noise in microRNA-mediated bimodal gene expression, PLoS Comput Biol, 14, e1006063, 10.1371/journal.pcbi.1006063 · DOI
  6. Janes, 2015, Cell-to-cell transcript variability: seeing signal in the noise, Cell, 163, 1566, 10.1016/j.cell.2015.12.010 · DOI
  7. Yang, 2018, Noise transmission during the dynamic pattern formation in fly embryos, Quant Biol, 6, 15, 10.1007/s40484-018-0135-8 · DOI
  8. Battich, 2015, Control of transcript variability in single mammalian cells, Cell, 163, 1596, 10.1016/j.cell.2015.11.018 · DOI · Paper page
  9. Hoffman, 2015, MicroRNAs silence the noisy genome, Science, 348, 41, 10.1126/science.aaa9841 · DOI
  10. Seitz, 2009, Redefining microRNA targets, Curr Biol, 19, 870, 10.1016/j.cub.2009.03.059 · DOI
  11. Wu, 2018, MicroRNA, noise, and gene expression regulation, Methods Mol Biol, 1699, 91, 10.1007/978-1-4939-7435-1_7 · DOI
  12. Ebert, 2012, Roles for microRNAs in conferring robustness to biological processes, Cell, 149, 515, 10.1016/j.cell.2012.04.005 · DOI · Paper page
  13. Martirosyan, 2017, ceRNA crosstalk stabilizes protein expression and affects the correlation pattern of interacting proteins, Sci Rep, 7, 1, 10.1038/srep43673 · DOI
  14. Blake, 2003, Noise in eukaryotic gene expression, Nature, 422, 633, 10.1038/nature01546 · DOI
  15. Kærn, 2005, Stochasticity in gene expression: from theories to phenotypes, Nat Rev Genet, 6, 451, 10.1038/nrg1615 · DOI
  16. Tay, 2014, The multilayered complexity of ceRNA crosstalk and competition, Nature, 505, 344, 10.1038/nature12986 · DOI · Paper page
  17. Bosson, 2014, Endogenous miRNA and target concentrations determine susceptibility to potential ceRNA competition, Mol Cell, 56, 347, 10.1016/j.molcel.2014.09.018 · DOI
  18. Raj, 2008, Imaging individual mRNA molecules using multiple singly labeled probes, Nat Methods, 5, 877, 10.1038/nmeth.1253 · DOI · Paper page
  19. Li, 2017, Network embedding-based representation learning for single cell RNA-seq data, Nucleic Acids Res, 45, 10.1093/nar/gkx750 · DOI
  20. Wang, 2018, Gene expression distribution deconvolution in single-cell RNA sequencing, Proc Natl Acad Sci U S A, 115, E6437
  21. Miao, 2018, DEsingle for detecting three types of differential expression in single-cell RNA-seq data, Bioinformatics, 1, 3223, 10.1093/bioinformatics/bty332 · DOI
  22. Huang, 2018, SAVER: gene expression recovery for single-cell RNA sequencing, Nat Methods, 15, 539, 10.1038/s41592-018-0033-z · DOI
  23. Faure, 2017, Systematic analysis of the determinants of gene expression noise in embryonic stem cells, Cell Syst, 5, 471, 10.1016/j.cels.2017.10.003 · DOI
  24. Li, 2017, RNA helicase DDX5 inhibits reprogramming to pluripotency by miRNA-based repression of RYBP and its PRC1-dependent and-independent functions, Cell Stem Cell, 20, 462, 10.1016/j.stem.2016.12.002 · DOI
  25. Baek, 2008, The impact of microRNAs on protein output, Nature, 455, 64, 10.1038/nature07242 · DOI · Paper page
  26. Krek, 2005, Combinatorial microRNA target predictions, Nat Genet, 37, 495, 10.1038/ng1536 · DOI · Paper page
  27. Vejnar, 2012, MiRmap: comprehensive prediction of microRNA target repression strength, Nucleic Acids Res, 40, 11673, 10.1093/nar/gks901 · DOI
  28. Bosia, 2017, RNAs competing for microRNAs mutually influence their fluctuations in a highly non-linear microRNA-dependent manner in single cells, Genome Biol, 18, 37, 10.1186/s13059-017-1162-x · DOI
  29. Wei, 2019, Regulation by competition: a hidden layer of gene regulatory network, Quant Biol, 7, 110, 10.1007/s40484-018-0162-5 · DOI
  30. Wu, 2013, Dissection of miRNA–miRNA interaction in esophageal squamous cell carcinoma, PLoS ONE, 8, e73191, 10.1371/journal.pone.0073191 · DOI
  31. Xu, 2011, miRNA–miRNA synergistic network: construction via co-regulating functional modules and disease miRNA topological features, Nucleic Acids Res, 39, 825, 10.1093/nar/gkq832 · DOI
  32. Pons, 2005, Computing communities in large networks using random walks, International Symposium on Computer and Information Sciences, 284
  33. Heine, 1973, Distance between sets as an objective measure of retrieval effectiveness, Inf Stor Ret, 9, 181, 10.1016/0020-0271(73)90066-1 · DOI
  34. Pedraza, 2008, Effects of molecular memory and bursting on fluctuations in gene expression, Science, 319, 339, 10.1126/science.1144331 · DOI · Paper page
  35. Raser, 2005, Noise in gene expression: origins, consequences, and control, Science, 309, 2010, 10.1126/science.1105891 · DOI
  36. Friedel, 2009, Conserved principles of mammalian transcriptional regulation revealed by RNA half-life, Nucleic Acids Res, 37, 10.1093/nar/gkp542 · DOI · Paper page
  37. Yuan, 2015, Model-guided quantitative analysis of microRNA-mediated regulation on competing endogenous RNAs using a synthetic gene circuit, Proc Natl Acad Sci U S A, 112, 3158, 10.1073/pnas.1413896112 · DOI
  38. Lei, 2009, Stochasticity in single gene expression with both intrinsic noise and fluctuation in kinetic parameters, J Theor Biol, 256, 485, 10.1016/j.jtbi.2008.10.028 · DOI
  39. Li, 2015, Modular construction of mammalian gene circuits using TALE transcriptional repressors, Nat Chem Biol, 11, 207, 10.1038/nchembio.1736 · DOI
  40. Hu, 2019, HeLa-CCL2 cell heterogeneity studied by single-cell DNA and RNA sequencing, PLoS ONE, 14, e0225466, 10.1371/journal.pone.0225466 · DOI
  41. Schmiedel, 2017, Noise control is a primary function of microRNAs and post-transcriptional regulation, bioRxiv
  42. Li, 2009, A microRNA imparts robustness against environmental fluctuation during development, Cell, 137, 273, 10.1016/j.cell.2009.01.058 · DOI · Paper page
  43. Kasper, 2017, MicroRNAs establish uniform traits during the architecture of vertebrate embryos, Dev Cell, 40, 552, 10.1016/j.devcel.2017.02.021 · DOI
  44. Chen, 2019, Gene regulatory network stabilized by pervasive weak repressions: microRNA functions revealed by the May–Wigner theory, Nat Sci Rev, 16, 1176, 10.1093/nsr/nwz076 · DOI
  45. Selbach, 2008, Widespread changes in protein synthesis induced by microRNAs, Nature, 455, 58, 10.1038/nature07228 · DOI · Paper page
  46. Roux, 2012, Comparative analysis of human and mouse expression data illuminates tissue-specific evolutionary patterns of miRNAs, Nucleic Acids Res, 40, 5890, 10.1093/nar/gks279 · DOI
  47. Juzenas, 2017, A comprehensive, cell specific microRNA catalogue of human peripheral blood, Nucleic Acids Res, 45, 9290, 10.1093/nar/gkx706 · DOI · Paper page
  48. Alberti, 2018, Cell-type specific sequencing of microRNAs from complex animal tissues, Nat Methods, 15, 283, 10.1038/nmeth.4610 · DOI
  49. Hagemann-Jensen, 2018, Small-seq for single-cell small-RNA sequencing, Nat Protoc, 13, 2407, 10.1038/s41596-018-0049-y · DOI
  50. Jaitin, 2014, Massively parallel single-cell RNA-seq for marker-free decomposition of tissues into cell types, Science, 343, 776, 10.1126/science.1247651 · DOI · Paper page
  51. Su, 2013, miRNomes of haematopoietic stem cells and dendritic cells identify miR-30b as a regulator of Notch1, Nat Commun, 4, 10.1038/ncomms3903 · DOI
  52. Nakaoka, 2017, Cluster microRNAs miR-194 and miR-215 suppress the tumorigenicity of intestinal tumor organoids, Cancer Sci, 108, 678, 10.1111/cas.13165 · DOI
  53. Guo, 2017, Multiscale modeling of inflammation-induced tumorigenesis reveals competing oncogenic and oncoprotective roles for inflammation, Cancer Res, 77, 6429, 10.1158/0008-5472.CAN-17-1662 · DOI
  54. Fan, 2016, Characterizing transcriptional heterogeneity through pathway and gene set overdispersion analysis, Nat Methods, 13, 241, 10.1038/nmeth.3734 · DOI
  55. Ambros, 2003, A uniform system for microRNA annotation, RNA, 9, 277, 10.1261/rna.2183803 · DOI · Paper page
  56. Fromm, 2020, MirGeneDB2.0: the metazoan microRNA complement, Nucleic Acids Res, 48, D132, 10.1093/nar/gkz885 · DOI · Paper page
  57. Lewis, 2003, Prediction of mammalian microRNA targets, Cell, 115, 787, 10.1016/S0092-8674(03)01018-3 · DOI · Paper page
  58. Lewis, 2005, Conserved seed pairing, often flanked by adenosines, indicates that thousands of human genes are microRNA targets, Cell, 120, 15, 10.1016/j.cell.2004.12.035 · DOI · Paper page
  59. Mann, 1947, On a test of whether one of two random variables is stochastically larger than the other, Ann Math Statist, 18, 50, 10.1214/aoms/1177730491 · DOI · Paper page
  60. Kelley, 2012, On effect size, Psychol Methods, 17, 137, 10.1037/a0028086 · DOI
  61. Mason, 2002, Areas beneath the relative operating characteristics (ROC) and relative operating levels (ROL) curves: statistical significance and interpretation, Q J R Meteorol Soc, 128, 2145, 10.1256/003590002320603584 · DOI
  62. Yu, 2014, DOSE: an R/Bioconductor package for disease ontology semantic and enrichment analysis, Bioinformatics, 31, 608, 10.1093/bioinformatics/btu684 · DOI
  63. Wei, 2021, Characterizing microRNA-mediated modulation of gene expression noise and its effect on synthetic gene circuits, Cell Rep, 36, 109573, 10.1016/j.celrep.2021.109573 · DOI

Cited by

Sorted by citations

Metadata

Authors
Hu, T., Wei, L., Li, S., Cheng, T., Zhang, X., & Wang, X.
Affiliations
Ministry of Education Key Laboratory of Bioinformatics, Center for Synthetic and Systems Biology, Bioinformatics Division, Beijing National Research Center for Information Science and Technology, Department of Automation, Tsinghua University , Beijing 100084 , China
Venue
Genomics, Proteomics & Bioinformatics
Published
2021-06-01
Volume
19
Issue
3
Pages
394-407
ISSN
  • 1672-0229
  • 2210-3244
Cited by
12
References
11
Language
en
Funders
  • National Science Foundation of China (61773230, 61721003)
  • NSFC

About these checks

Registry, retraction, Cites and statistics results are computed, not judged, with one exception: a printed reference that no index lists is read once by a model before it counts as a citation error. Claims are extracted by a model and kept only when their quote appears verbatim in the text; each cited source is then checked, with a model’s help, for whether it says what the claim relies on. Those verdicts can be wrong — read the claim’s quote and the cited source before relying on one.

Statistics and arithmetic are recomputed, not judged.

Confidence bands are shown only for fields calibrated on our annotated test set. None is calibrated yet, so no band is shown.

What counts as a claim ›How we measure confidence ›How we check this ›

Are you an author, or do you see a problem with this page? Request a review