

The DOI matches its Crossref record; 8 of the 8 references it cites were found in a registry or an index.
A comprehensive, cell specific microRNA catalogue of human peripheral blood.
Overview
The claims and statistics of this paper haven’t been checked yet.
Run the check — free, no account needed. It reads the open-access text and checks the sources it cites.
Integrity signals
Registry
Cites
Statistics
Figures
Verification
Claims the paper makes
The claims and statistics of this paper haven’t been checked yet.
Run the check — free, no account needed. It reads the open-access text and checks the sources it cites.
Claims other papers make about this one
Each is checked against this paper’s own text: does it say what the citing paper says it does?
In the citing paper
“suggesting that blood may contain exosomes derived from RBC and serum may contain miRNAs released by RBC”
From Red Blood Cells as Potential Repositories of MicroRNAs in the Circulatory System (2020) · cites this paper as Juzenas et al., 2017
In the citing paper
“Juzenas et al. (2017) compared the miRNA content of RBCs with that of serum and exosomes and found a considerable overlap between all three fractions.”
From Red Blood Cells as Potential Repositories of MicroRNAs in the Circulatory System (2020) · cites this paper as Juzenas et al., 2017
In the citing paper
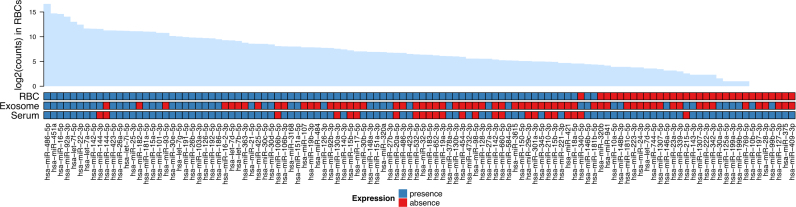
“Their results showed that 38 miRNA species are shared by serum, exosomes, and RBCs, suggesting that blood may contain exosomes derived from RBC and serum may contain miRNAs released by RBC”
From Red Blood Cells as Potential Repositories of MicroRNAs in the Circulatory System (2020) · cites this paper as Juzenas et al., 2017
Self-check
Percentages, sums and reported differences re-computed from the paper’s own numbers.
The self-check needs the paper’s full text.
Citations
Cites
Cutadapt removes adapter sequences from high-throughput sequencing reads
Martin, M. (2011) · EMBnet.journal · doi:10.14806/ej.17.1.200 · Cited by 33,889
BLAST+: architecture and applications
Camacho, C., Coulouris, G., Avagyan, V., Ma, N., Papadopoulos, J., Bealer, K., & Madden, T. L. (2009) · BMC Bioinformatics · doi:10.1186/1471-2105-10-421 · Cited by 22,074
ggplot2: Elegant Graphics for Data Analysis
Wickham, H. (2009) · doi:10.1007/978-0-387-98141-3 · Cited by 14,447
Gene Expression Omnibus: NCBI gene expression and hybridization array data repository
Edgar, R. (2002) · Nucleic Acids Research · doi:10.1093/nar/30.1.207 · Cited by 13,288
Most mammalian mRNAs are conserved targets of microRNAs
Friedman, R. C., Farh, K. K.-H., Burge, C. B., & Bartel, D. P. (2009) · Genome Research · doi:10.1101/gr.082701.108 · Cited by 8,462
O'Leary, N. A., Wright, M. W., Brister, J. R., Ciufo, S., Haddad, D., McVeigh, R., Rajput, B., Robbertse, B., Smith-White, B., Ako-Adjei, D., et al. (2016) · Nucleic Acids Research · doi:10.1093/nar/gkv1189 · Cited by 6,357
Tumour invasion and metastasis initiated by microRNA-10b in breast cancer
Ma, L., Teruya-Feldstein, J., & Weinberg, R. A. (2007) · Nature · doi:10.1038/nature06174 · Cited by 2,605
Blood Cell Origin of Circulating MicroRNAs: A Cautionary Note for Cancer Biomarker Studies
Pritchard, C. C., Kroh, E., Wood, B., Arroyo, J. D., Dougherty, K. J., Miyaji, M. M., Tait, J. F., & Tewari, M. (2012) · Cancer Prevention Research · doi:10.1158/1940-6207.capr-11-0370 · Cited by 879
Research works printed but not linked: 58
- 2004, MicroRNAs: genomics, biogenesis, mechanism, and function, Cell, 116, 281, 10.1016/S0092-8674(04)00045-5 · DOI
- 2014, miRBase: annotating high confidence microRNAs using deep sequencing data, Nucleic Acids Res., 42, D68, 10.1093/nar/gkt1181 · DOI · Paper page
- 2005, Conserved seed pairing, often flanked by adenosines, indicates that thousands of human genes are microRNA targets, Cell, 120, 15, 10.1016/j.cell.2004.12.035 · DOI · Paper page
- 2005, MicroRNA gene expression deregulation in human breast cancer, Cancer Res., 65, 7065, 10.1158/0008-5472.CAN-05-1783 · DOI · Paper page
- 2005, MicroRNA expression profiles classify human cancers, Nature, 435, 834, 10.1038/nature03702 · DOI
- 2006, MicroRNA signatures in human cancers, Nat. Rev. Cancer, 6, 857, 10.1038/nrc1997 · DOI
- 2007, Altered microRNA expression in human heart disease, Physiol. Genomics, 31, 367, 10.1152/physiolgenomics.00144.2007 · DOI
- 2010, Complexity of the microRNA repertoire revealed by next-generation sequencing, RNA, 16, 2170, 10.1261/rna.2225110 · DOI
- 2017, Knowledge about the presence or absence of miRNA isoforms (isomiRs) can successfully discriminate amongst 32 TCGA cancer types, Nucleic Acids Res., 45, 2973, 10.1093/nar/gkx082 · DOI
- 2012, IsomiRs—the overlooked repertoire in the dynamic microRNAome, Trends Genet., 28, 544, 10.1016/j.tig.2012.07.005 · DOI · Paper page
- 2014, IsomiR expression profiles in human lymphoblastoid cell lines exhibit population and gender dependencies, Oncotarget, 5, 8790, 10.18632/oncotarget.2405 · DOI · Paper page
- 2017, Knowledge about the presence or absence of miRNA isoforms (isomiRs) can successfully discriminate amongst 32 TCGA cancer types, Nucleic Acids Res., 6, 20707
- 2015, Beyond the one-locus-one-miRNA paradigm: microRNA isoforms enable deeper insights into breast cancer heterogeneity, Nucleic Acids Res., 43, 9158, 10.1093/nar/gkv922 · DOI
- 2014, Conserved microRNA editing in mammalian evolution, development and disease, Genome Biol., 15, R83, 10.1186/gb-2014-15-6-r83 · DOI
- 2013, A highly expressed miR-101 isomiR is a functional silencing small RNA, BMC Genomics, 14, 104, 10.1186/1471-2164-14-104 · DOI
- 2014, 5′ isomiR variation is of functional and evolutionary importance, Nucleic Acids Res., 42, 9424, 10.1093/nar/gku656 · DOI · Paper page
- 2008, Circulating microRNAs as stable blood-based markers for cancer detection, Proc. Natl. Acad. Sci., 105, 10513, 10.1073/pnas.0804549105 · DOI · Paper page
- 2008, Detection of elevated levels of tumour-associated microRNAs in serum of patients with diffuse large B-cell lymphoma, Br. J. Haematol., 141, 672, 10.1111/j.1365-2141.2008.07077.x · DOI
- 2008, Characterization of microRNAs in serum: a novel class of biomarkers for diagnosis of cancer and other diseases, Cell Res., 18, 997, 10.1038/cr.2008.282 · DOI · Paper page
- 2010, Serum microRNAs as non-invasive biomarkers for cancer, Mol. Cancer, 9, 306, 10.1186/1476-4598-9-306 · DOI
- 2011, Circulating microRNAs in cardiovascular disease, Circulation, 124, 1908, 10.1161/CIRCULATIONAHA.111.062117 · DOI
- 2013, Circulating microRNAs as potential new biomarkers for prostate cancer, Br. J. Cancer, 108, 1925, 10.1038/bjc.2013.192 · DOI
- 2012, Expression profiling of human immune cell subsets identifies miRNA-mRNA regulatory relationships correlated with cell type specific expression, PLoS One, 7, e29979, 10.1371/journal.pone.0029979 · DOI
- 2015, A comprehensive joint analysis of the long and short RNA transcriptomes of human erythrocytes, BMC Genomics, 16, 952, 10.1186/s12864-015-2156-2 · DOI · Paper page
- 2014, The human miRNA repertoire of different blood compounds, BMC Genomics, 15, 474, 10.1186/1471-2164-15-474 · DOI · Paper page
- 2015, A multi-omic analysis of human naïve CD4+ T cells, BMC Syst. Biol., 9, 75, 10.1186/s12918-015-0225-4 · DOI
- 2014, Nontemplated nucleotide additions distinguish the small RNA composition in cells from exosomes, Cell Rep., 8, 1649, 10.1016/j.celrep.2014.08.027 · DOI · Paper page
- 2017, 3′ Uridylation controls mature microRNA turnover during CD4 T-cell activation, RNA, 23, 882, 10.1261/rna.060095.116 · DOI
- 2014, Design and analysis for studying microRNAs in human disease: a primer on -Omic technologies, Am. J. Epidemiol., 180, 140, 10.1093/aje/kwu135 · DOI
- 2012, MicroRNA profiling: approaches and considerations, Nat. Rev. Genet., 13, 358, 10.1038/nrg3198 · DOI · Paper page
- 2016, Can circulating miRNAs live up to the promise of being minimal invasive biomarkers in clinical settings?, Wiley Interdiscip. Rev. RNA, 7, 148, 10.1002/wrna.1320 · DOI
- 2012, Barcoded cDNA library preparation for small RNA profiling by next-generation sequencing, Methods, 58, 164, 10.1016/j.ymeth.2012.07.030 · DOI
- 2010, SeqBuster, a bioinformatic tool for the processing and analysis of small RNAs datasets, reveals ubiquitous miRNA modifications in human embryonic cells, Nucleic Acids Res., 38, e34, 10.1093/nar/gkp1127 · DOI
- 2014, Moderated estimation of fold change and dispersion for RNA-seq data with DESeq2, Genome Biol., 15, 550, 10.1186/s13059-014-0550-8 · DOI · Paper page
- 1995, Controlling the false discovery rate: a practical and powerful approach to multiple testing, J. R. Stat. Soc. Ser. B, 57, 289, 10.1111/j.2517-6161.1995.tb02031.x · DOI · Paper page
- 2016, Complex heatmaps reveal patterns and correlations in multidimensional genomic data, Bioinformatics, 32, 2847, 10.1093/bioinformatics/btw313 · DOI
- 2015, Computational prediction of miRNA genes from small RNA sequencing data, Front. Bioeng. Biotechnol., 3, 7
- 2003, Rfam: an RNA family database, Nucleic Acids Res., 31, 439, 10.1093/nar/gkg006 · DOI
- 2009, Ultrafast and memory-efficient alignment of short DNA sequences to the human genome, Genome Biol., 10, R25, 10.1186/gb-2009-10-3-r25 · DOI · Paper page
- 2012, miRDeep2 accurately identifies known and hundreds of novel microRNA genes in seven animal clades, Nucleic Acids Res., 40, 37, 10.1093/nar/gkr688 · DOI · Paper page
- 2014, Ensembl 2015, Nucleic Acids Res., 43, D662
- 2013, Dfam: a database of repetitive DNA based on profile hidden Markov models, Nucleic Acids Res., 41, D70
- 2016, Prioritizing and selecting likely novel miRNAs from NGS data, Nucleic Acids Res., 44, e53, 10.1093/nar/gkv1335 · DOI
- 2013, Comparison of analysis tools for miRNA high throughput sequencing using nerve crush as a model, Front. Genet., 4, 20
- 2017, Web-based NGS data analysis using miRMaster: a large-scale meta-analysis of human miRNAs, Nucleic Acids Res., 13, 1084
- 2014, Transcriptional diversity during lineage commitment of human blood progenitors, Science, 345, 1251033, 10.1126/science.1251033 · DOI
- 2010, Comprehensive microRNA expression profiling of the hematopoietic hierarchy, Proc. Natl. Acad. Sci. U.S.A., 107, 15443, 10.1073/pnas.1009320107 · DOI
- 2016, High-resolution analysis of the human retina miRNome reveals isomiR variations and novel microRNAs, Nucleic Acids Res., 44, 1525, 10.1093/nar/gkw039 · DOI
- 2010, A comprehensive survey of 3′ animal miRNA modification events and a possible role for 3′ adenylation in modulating miRNA targeting effectiveness, Genome Res., 20, 1398, 10.1101/gr.106054.110 · DOI
- 2017, MiRNA profiling of gastrointestinal stromal tumors by next generation sequencing, Oncotarget, 5, 37225
- 2016, General rules for functional microRNA targeting, Nat. Genet., 48, 1517, 10.1038/ng.3694 · DOI
- 2013, A biophysical miRNA-mRNA interaction model infers canonical and noncanonical targets, Nat. Methods, 10, 253, 10.1038/nmeth.2341 · DOI
- 2015, MicroRNA transcriptomes of distinct human NK cell populations identify miR-362-5p as an essential regulator of NK cell function, Sci. Rep., 5, 9993, 10.1038/srep09993 · DOI
- 2010, Deep sequencing of the small RNA transcriptome of normal and malignant human B cells identifies hundreds of novel microRNAs, Blood, 116, e118, 10.1182/blood-2010-05-285403 · DOI
- 2014, Evaluation of quantitative miRNA expression platforms in the microRNA quality control (miRQC) study, Nat. Methods, 11, 809, 10.1038/nmeth.3014 · DOI · Paper page
- 2016, Deep characterization of blood cell miRNomes by NGS, Cell. Mol. Life Sci., 73, 3169, 10.1007/s00018-016-2154-9 · DOI
- 2015, Improving reference epigenome catalogs by computational prediction, Nat. Biotechnol., 33, 354, 10.1038/nbt.3194 · DOI
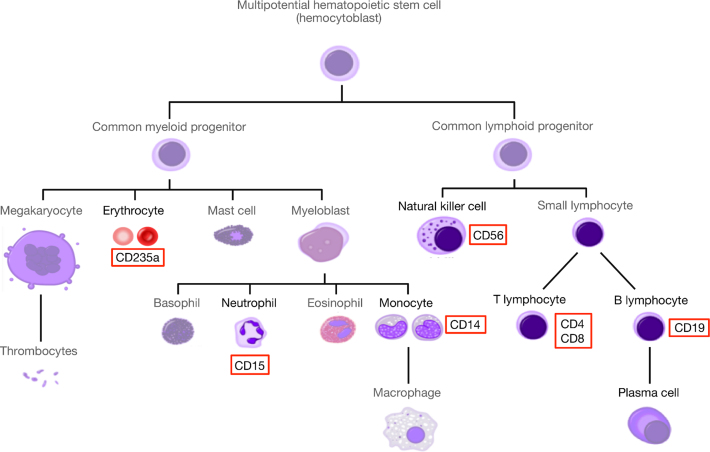
- Simplified hematopoiesis, Wikimedia Commons
Cited by
Sorted by citations
Red Blood Cells as Potential Repositories of MicroRNAs in the Circulatory System
Sun, L., Yu, Y., Niu, B., & Wang, D. (2020) · Frontiers in Genetics · doi:10.3389/fgene.2020.00442 · Cited by 83
Moszyńska, A., Jaśkiewicz, M., Serocki, M., Cabaj, A., Crossman, D. K., Bartoszewska, S., Gebert, M., Dąbrowski, M., Collawn, J. F., & Bartoszewski, R. (2022) · The FASEB Journal · doi:10.1096/fj.202101987r · Cited by 53
A curated human cellular microRNAome based on 196 primary cell types
Patil, A. H., Baran, A., Brehm, Z. P., McCall, M. N., & Halushka, M. K. (2022) · GigaScience · doi:10.1093/gigascience/giac083 · Cited by 30
Juzenas, S., Lindqvist, C. M., Ito, G., Dolshanskaya, Y., Halfvarson, J., Franke, A., & Hemmrich-Stanisak, G. (2020) · NAR Genomics and Bioinformatics · doi:10.1093/nargab/lqaa008 · Cited by 17
Self-citation
Metadata
- Authors
- Juzenas, S., Venkatesh, G., Hübenthal, M., Hoeppner, M. P., Du, Z. G., Paulsen, M., Rosenstiel, P., Senger, P., Hofmann-Apitius, M., Keller, A., Kupcinskas, L., Franke, A., & Hemmrich-Stanisak, G.
- Venue
- Nucleic Acids Research
- Publisher
- Oxford University Press (OUP)
- Published
- 2017-08-11
- Volume
- 45
- Issue
- 16
- Pages
- 9290-9301
- ISSN
- 0305-1048
- 1362-4962
- PMC
- PMC5766192
- Cited by
- 181
- References
- 8
- Language
- en
About these checks
Registry, retraction, Cites and statistics results are computed, not judged, with one exception: a printed reference that no index lists is read once by a model before it counts as a citation error. Claims are extracted by a model and kept only when their quote appears verbatim in the text; each cited source is then checked, with a model’s help, for whether it says what the claim relies on. Those verdicts can be wrong — read the claim’s quote and the cited source before relying on one.
Statistics and arithmetic are recomputed, not judged.
Confidence bands are shown only for fields calibrated on our annotated test set. None is calibrated yet, so no band is shown.
What counts as a claim ›How we measure confidence ›How we check this ›
Are you an author, or do you see a problem with this page? Request a review
How to cite
Cite CoChat for the checks on this page, and the paper for its own findings.
- This page
- CoChat. (2026). Citation check: A comprehensive, cell specific microRNA catalogue of human peripheral blood. https://app.cochat.ai/papers/10.1093/nar/gkx706
- The paper
- Juzenas, S., Venkatesh, G., Hübenthal, M., Hoeppner, M. P., Du, Z. G., Paulsen, M., Rosenstiel, P., Senger, P., Hofmann-Apitius, M., Keller, A., Kupcinskas, L., Franke, A., & Hemmrich-Stanisak, G. (2017). A comprehensive, cell specific microRNA catalogue of human peripheral blood. Nucleic Acids Research. https://doi.org/10.1093/nar/gkx706
