

The DOI matches its Crossref record; 54 of the 54 references it cites were found in a registry or an index.
Human dermal CD14(+) cells are a transient population of monocyte-derived macrophages
Open accessAbstract
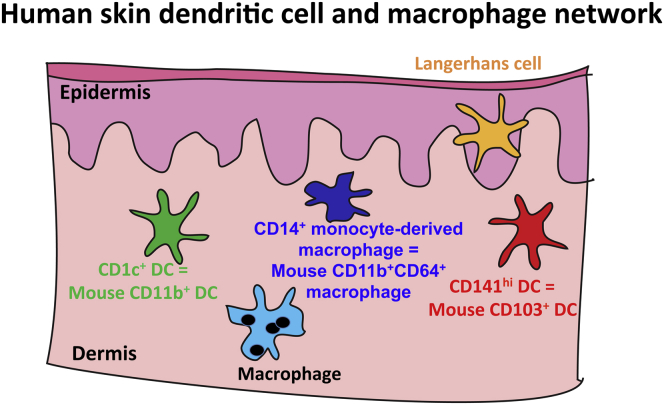
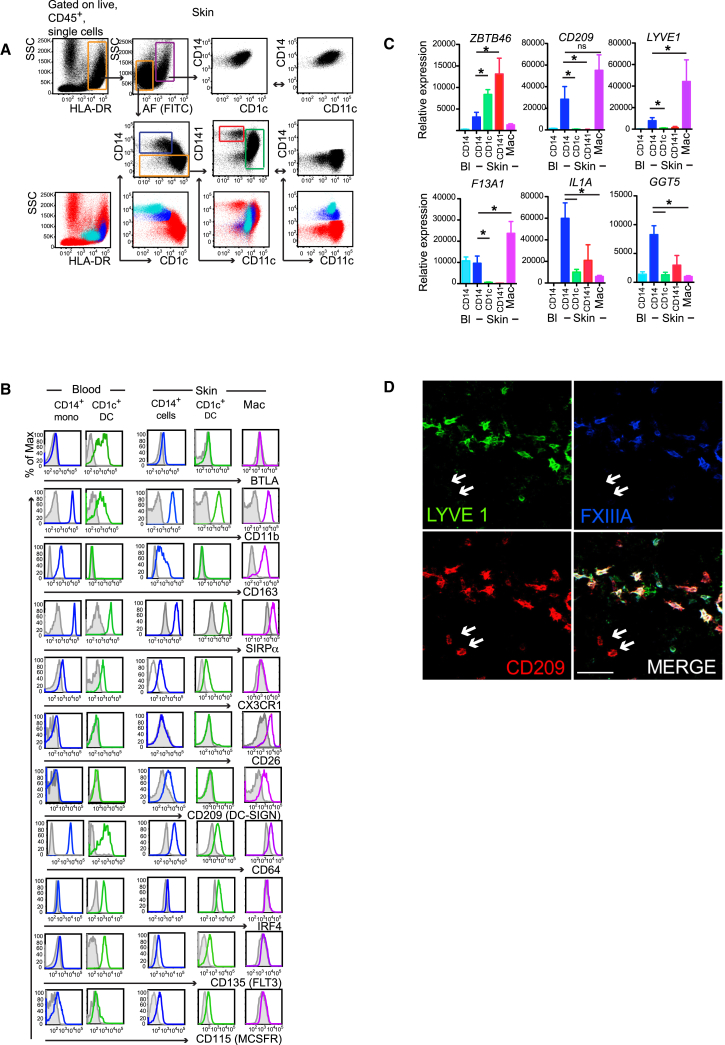
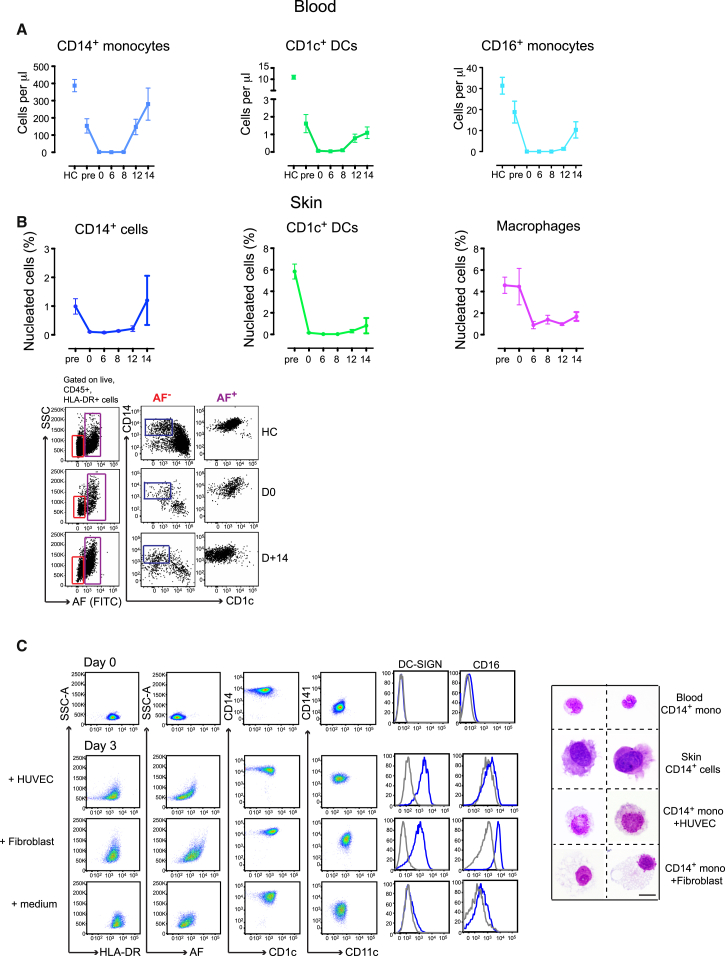
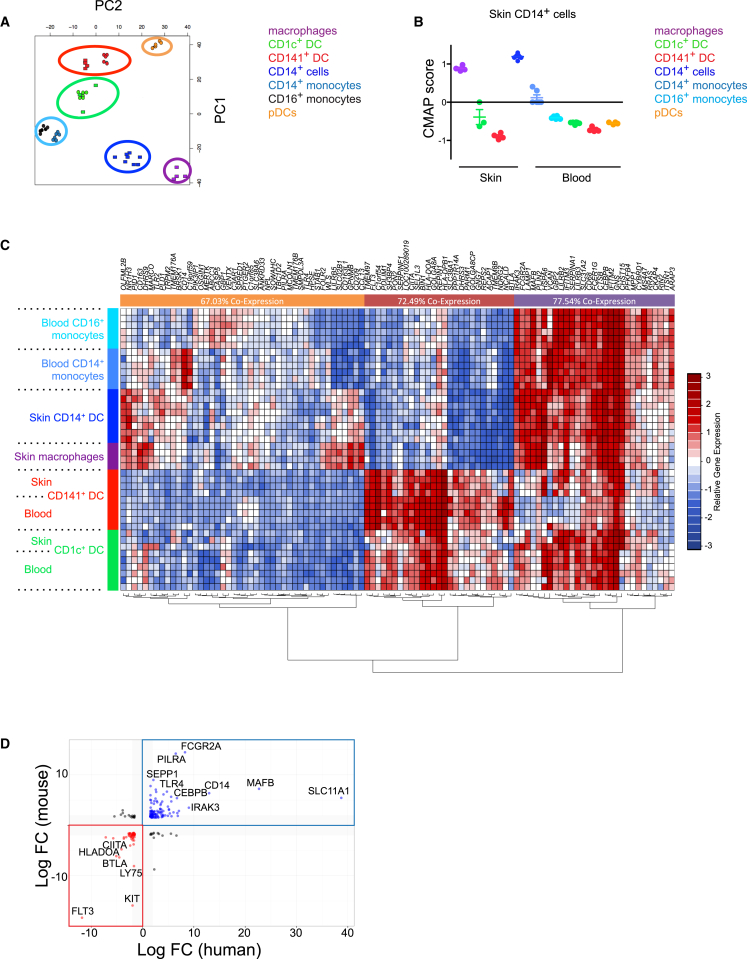
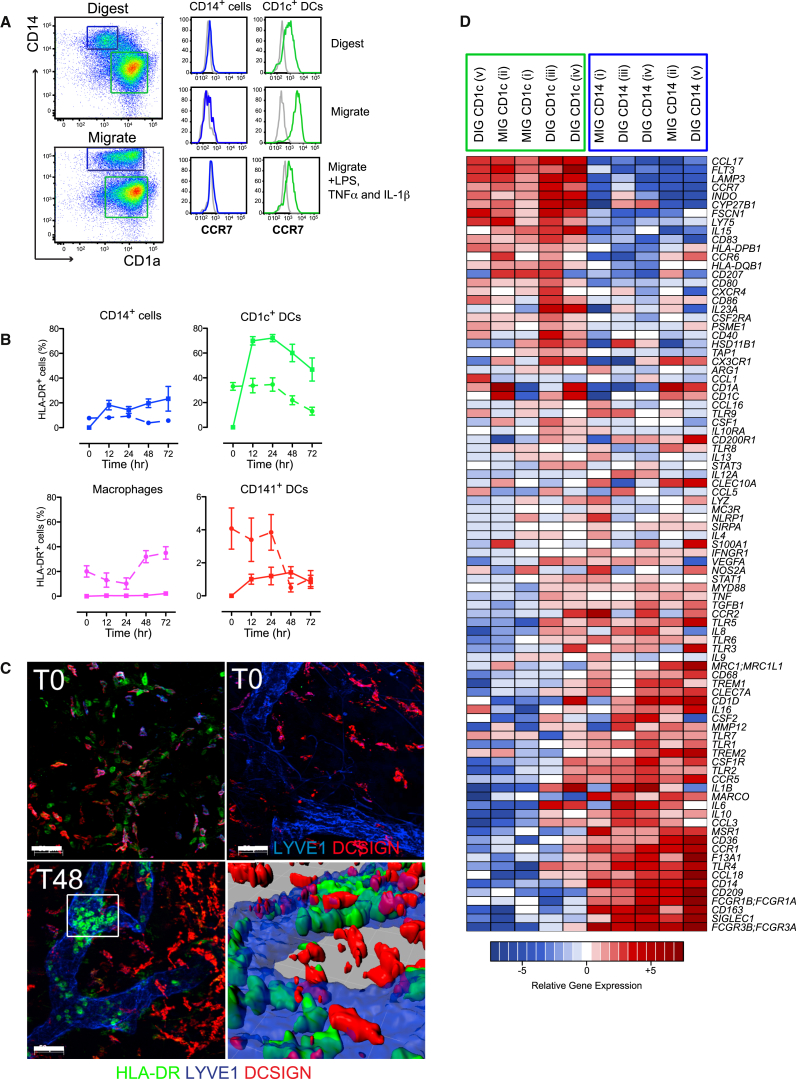
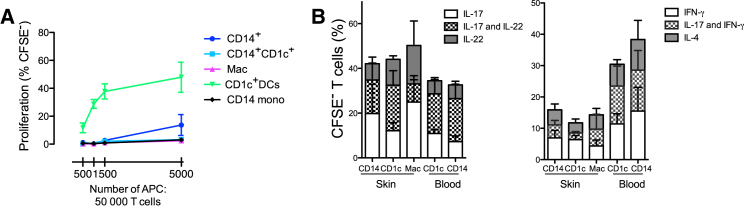
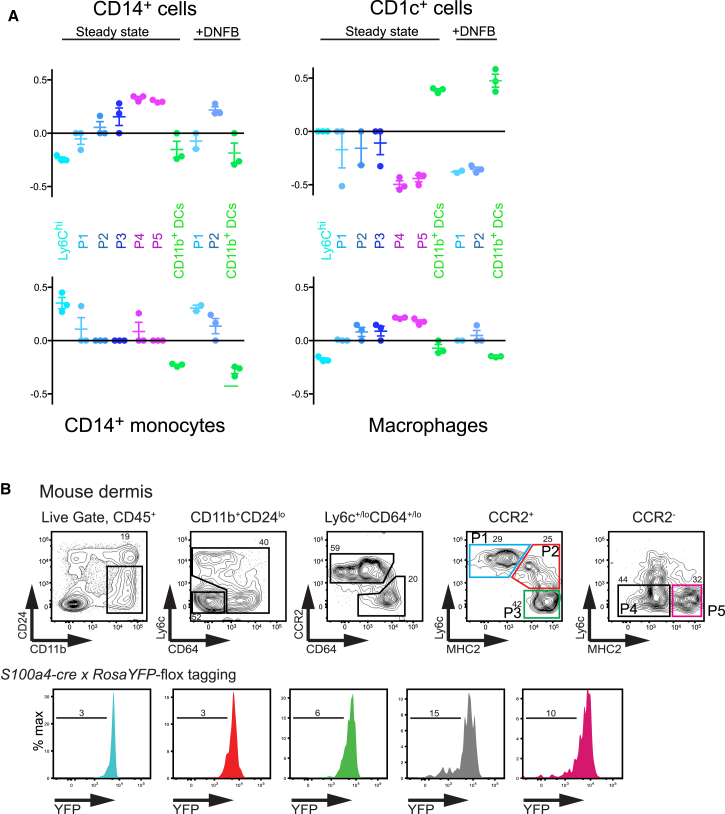
Dendritic cells (DCs), monocytes, and macrophages are leukocytes with critical roles in immunity and tolerance. The DC network is evolutionarily conserved; the homologs of human tissue CD141(hi)XCR1⁺ CLEC9A⁺ DCs and CD1c⁺ DCs are murine CD103⁺ DCs and CD64⁻ CD11b⁺ DCs. In addition, human tissues also contain CD14⁺ cells, currently designated as DCs, with an as-yet unknown murine counterpart. Here we have demonstrated that human dermal CD14⁺ cells are a tissue-resident population of monocyte-derived macrophages with a short half-life of <6 days. The decline and reconstitution kinetics of human blood CD14⁺ monocytes and dermal CD14⁺ cells in vivo supported their precursor-progeny relationship. The murine homologs of human dermal CD14⁺ cells are CD11b⁺ CD64⁺ monocyte-derived macrophages. Human and mouse monocytes and macrophages were defined by highly conserved gene transcripts, which were distinct from DCs. The demonstration of monocyte-derived macrophages in the steady state in human tissue supports a conserved organization of human and mouse mononuclear phagocyte system.
Overview
The claims and statistics of this paper haven’t been checked yet.
Run the check — free, no account needed. It reads the open-access text and checks the sources it cites.
Integrity signals
Registry
Cites
Statistics
Figures
Verification
Claims the paper makes
The claims and statistics of this paper haven’t been checked yet.
Run the check — free, no account needed. It reads the open-access text and checks the sources it cites.
Claims other papers make about this one
Each is checked against this paper’s own text: does it say what the citing paper says it does?
In the citing paper
“This does indeed happen, for example in the gut or the dermis (53,54).”
From The impact of ageing on monocytes and macrophages (2021) · cites this paper as [54]
Self-check
Percentages, sums and reported differences re-computed from the paper’s own numbers.
The self-check needs the paper’s full text.
Citations
Cites
Fate Mapping Reveals Origins and Dynamics of Monocytes and Tissue Macrophages under Homeostasis
Yona, S., Kim, K.-W., Wolf, Y., Mildner, A., Varol, D., Breker, M., Strauss-Ayali, D., Viukov, S., Guilliams, M., Misharin, A., et al. (2013) · Immunity · doi:10.1016/j.immuni.2012.12.001 · Cited by 3,245
A Lineage of Myeloid Cells Independent of Myb and Hematopoietic Stem Cells
Schulz, C., Perdiguero, E. G., Chorro, L., Szabo-Rogers, H., Cagnard, N., Kierdorf, K., Prinz, M., Wu, B., Jacobsen, S. E. W., Pollard, J. W., et al. (2012) · Science · doi:10.1126/science.1219179 · Cited by 2,578
Hashimoto, D., Chow, A., Noizat, C., Teo, P., Beasley, M. B., Leboeuf, M., Becker, C. D., See, P., Price, J., Lucas, D., et al. (2013) · Immunity · doi:10.1016/j.immuni.2013.04.004 · Cited by 2,311
Self-citationthe Immunological Genome Consortium, Gautier, E. L., Shay, T., Miller, J., Greter, M., Jakubzick, C., Ivanov, S., Helft, J., Chow, A., Elpek, K. G., et al. (2012) · Nature Immunology · doi:10.1038/ni.2419 · Cited by 1,972 · cited 6×
“The extension of human DC, monocyte, and macrophage map- ping further enhances the utility of the ImmGen data repository.”
BackgroundMethodInfluentialYoshida, H., Hayashi, S.-I., Kunisada, T., Ogawa, M., Nishikawa, S., Okamura, H., Sudo, T., Shultz, L. D., & Nishikawa, S.-I. (1990) · Nature · doi:10.1038/345442a0 · Cited by 1,789
THE ORIGIN AND KINETICS OF MONONUCLEAR PHAGOCYTES
van Furth, R., & Cohn, Z. A. (1968) · The Journal of Experimental Medicine · doi:10.1084/jem.128.3.415 · Cited by 1,564
Dai, X.-M., Ryan, G. R., Hapel, A. J., Dominguez, M. G., Russell, R. G., Kapp, S., Sylvestre, V., & Stanley, E. R. (2002) · Blood · doi:10.1182/blood.v99.1.111 · Cited by 1,184
CCR7 governs skin dendritic cell migration under inflammatory and steady-state conditions
Ohl, L., Mohaupt, M., Czeloth, N., Hintzen, G., Kiafard, Z., Zwirner, J., Blankenstein, T., Henning, G., & Förster, R. (2004) · Immunity · doi:10.1016/j.immuni.2004.06.014 · Cited by 1,086
Jongbloed, S. L., Kassianos, A. J., McDonald, K. J., Clark, G. J., Ju, X., Angel, C. E., Chen, C. J., Dunbar, P. R., Wadley, R. B., Jeet, V., et al. (2010) · The Journal of Experimental Medicine · doi:10.1084/jem.20092140 · Cited by 1,019
McKenna, H. J., Stocking, K. L., Miller, R. E., Brasel, K., Smedt, T. D., Maraskovsky, E., Maliszewski, C. R., Lynch, D. H., Smith, J., Pulendran, B., et al. (2000) · Blood · doi:10.1182/blood.v95.11.3489 · Cited by 966
Caux, C., Vanbervliet, B., Massacrier, C., Dezutter‐Dambuyant, C., de Saint-Vis, B., Jacquet, C., Yoneda, K., Imamura, S., Schmitt, D., & Banchereau, J. (1996) · The Journal of Experimental Medicine · doi:10.1084/jem.184.2.695 · Cited by 920
IL-6 switches the differentiation of monocytes from dendritic cells to macrophages
Chomarat, P., Banchereau, J., Davoust, J. M., & Palucka, K. (2000) · Nature Immunology · doi:10.1038/82763 · Cited by 906
Plantinga, M., Guilliams, M., Vanheerswynghels, M., Deswarte, K., Branco-Madeira, F., Toussaint, W., Vanhoutte, L., Neyt, K., Killeen, N., Malissen, B., et al. (2013) · Immunity · doi:10.1016/j.immuni.2012.10.016 · Cited by 893
Schlitzer, A., McGovern, N. N., Teo, P., Zelante, T., Atarashi, K., Low, D., Ho, A. W. S., See, P., Shin, A., Wasan, P. S., et al. (2013) · Immunity · doi:10.1016/j.immuni.2013.04.011 · Cited by 884
Self-citationChen, C.-J., Kono, H., Golenbock, D., Reed, G., Akira, S., & Rock, K. L. (2007) · Nature Medicine · doi:10.1038/nm1603 · Cited by 876
Origin of the Lamina Propria Dendritic Cell Network
Bogunovic, M., Ginhoux, F., Helft, J., Shang, L., Hashimoto, D., Greter, M., Liu, K., Jakubzick, C., Ingersoll, M. A., Leboeuf, M., et al. (2009) · Immunity · doi:10.1016/j.immuni.2009.08.010 · Cited by 859
Self-citationBachem, A., Güttler, S., Hartung, E., Ebstein, F., Schaefer, M., Tannert, A., Salama, A., Movassaghi, K., Opitz, C., Mages, H. W., et al. (2010) · The Journal of Experimental Medicine · doi:10.1084/jem.20100348 · Cited by 821
Differentiation of Monocytes into Dendritic Cells in a Model of Transendothelial Trafficking
Randolph, G. J., Beaulieu, S., Lebecque, S., Steinman, R. M., & Müller, W. A. (1998) · Science · doi:10.1126/science.282.5388.480 · Cited by 809
Deciphering the transcriptional network of the dendritic cell lineage
Miller, J. C., Brown, B. D., Shay, T., Gautier, E. L., Jojic, V., Cohain, A. T., Pandey, G. S., Leboeuf, M., Elpek, K. G., Helft, J., et al. (2012) · Nature Immunology · doi:10.1038/ni.2370 · Cited by 802
Hoeffel, G., Wang, Y., Greter, M., See, P., Teo, P., Malleret, B., Leboeuf, M., Low, D., Oller, G., Almeida, F., et al. (2012) · Journal of Experimental Medicine · doi:10.1084/jem.20120340 · Cited by 786
Self-citationHaniffa, M. A., Shin, A., Bigley, V., McGovern, N. N., Teo, P., See, P., Wasan, P. S., Wang, X.-N., Malinarich, F., Malleret, B., et al. (2012) · Immunity · doi:10.1016/j.immuni.2012.04.012 · Cited by 786
Self-citationTamoutounour, S., Guilliams, M., Montanana Sanchis, F., Liu, H., Terhorst, D., Malosse, C., Pollet, E., Ardouin, L., Luche, H., Sanchez, C., et al. (2013) · Immunity · doi:10.1016/j.immuni.2013.10.004 · Cited by 783
Zigmond, E., Varol, C., Farache, J., Elmaliah, E., Satpathy, A. T., Friedlander, G., Mack, M., Shpigel, N. Y., Boneca, I. G., MURPHY, K. M. M., et al. (2012) · Immunity · doi:10.1016/j.immuni.2012.08.026 · Cited by 768
Jakubzick, C. V., Gautier, E., Gibbings, S. L., Sojka, D. K., Schlitzer, A., Johnson, T. E., Ivanov, S., Duan, Q., Bala, S., Condon, T., et al. (2013) · Immunity · doi:10.1016/j.immuni.2013.08.007 · Cited by 762
Self-citationIntestinal Lamina Propria Dendritic Cell Subsets Have Different Origin and Functions
Varol, C., Vallon-Eberhard, A., Elinav, E., Aychek, T., Shapira, Y., Luche, H., Fehling, H. J., Hardt, W., Shakhar, G., & Jung, S. (2009) · Immunity · doi:10.1016/j.immuni.2009.06.025 · Cited by 710
Poulin, L. F., Salio, M., Griessinger, E., Anjos‐Afonso, F., Craciun, L., Chen, J., Keller, A. M., Joffre, O. P., Zelenay, S., Nye, E. L., et al. (2010) · The Journal of Experimental Medicine · doi:10.1084/jem.20092618 · Cited by 708
Human Inflammatory Dendritic Cells Induce Th17 Cell Differentiation
Segura, É., Touzot, M., Bohineust, A., Cappuccio, A., Chiocchia, G., Hosmalin, A., Dalod, M., Soumelis, V., & Amigorena, S. (2013) · Immunity · doi:10.1016/j.immuni.2012.10.018 · Cited by 677
Crozat, K., Guiton, R., Contreras, V., Feuillet, V., Dutertre, C., Ventre, E., Manh, T. V., Baranek, T., Storset, A. K., Marvel, J., et al. (2010) · The Journal of Experimental Medicine · doi:10.1084/jem.20100223 · Cited by 628
Functional Specializations of Human Epidermal Langerhans Cells and CD14+ Dermal Dendritic Cells
Klechevsky, E., Morita, R., Liu, M., Cao, Y., Coquery, S., Thompson-Snipes, L., Brière, F., Chaussabel, D., Zurawski, G., Palucka, K., et al. (2008) · Immunity · doi:10.1016/j.immuni.2008.07.013 · Cited by 616
IRF8 Mutations and Human Dendritic-Cell Immunodeficiency
Hambleton, S., Salem, S., Bustamante, J. C., Bigley, V., Boisson‐Dupuis, S., Azevedo, J., Fortin, A., Haniffa, M. A., Ceron‐Gutierrez, L., Bacon, C. M., et al. (2011) · New England Journal of Medicine · doi:10.1056/nejmoa1100066 · Cited by 604
Self-citationRobbins, S. H., Walzer, T., Dembélé, D., Thibault-Carpentier, C., Defays, A., Bessou, G., Xu, H., Vivier, É., Sellars, M., Pierre, P., et al. (2008) · Genome biology · doi:10.1186/gb-2008-9-1-r17 · Cited by 582
Tamoutounour, S., Henri, S., Lelouard, H., de Bovis, B., de Haar, C. G., van der Woude, C. J., Woltman, A. M., Reyal, Y., Bonnet, D. A., Sichien, D., et al. (2012) · European Journal of Immunology · doi:10.1002/eji.201242847 · Cited by 526
Blood-derived dermal langerin+ dendritic cells survey the skin in the steady state
Ginhoux, F., Collin, M. P., Bogunovic, M., Abel, M., Leboeuf, M., Helft, J., Ochando, J., Kissenpfennig, A., MALISSEN, B., Grisotto, M. A. G., et al. (2007) · The Journal of Experimental Medicine · doi:10.1084/jem.20071733 · Cited by 432
Self-citationNestle, F. O., Zheng, X., Thompson, C. B., Turka, L. A., & Nickoloff, B. J. (1994) · The Journal of Immunology · doi:10.4049/jimmunol.152.1.376 · Cited by 389
Nestle, F. O., Zheng, X. G., Thompson, C. B., Turka, L. A., & Nickoloff, B. J. (1993) · The Journal of Immunology · doi:10.4049/jimmunol.151.11.6535 · Cited by 366
Dendritic cells: versatile controllers of the immune system
Steinman, R. M. (2007) · Nature Medicine · doi:10.1038/nm1643 · Cited by 316
Zaba, L. C., Fuentes‐Duculan, J., Steinman, R. M., Krueger, J. G., & Lowes, M. A. (2007) · Journal of Clinical Investigation · doi:10.1172/jci32282 · Cited by 311
The human syndrome of dendritic cell, monocyte, B and NK lymphoid deficiency
Bigley, V., Haniffa, M. A., Doulatov, S. R., Wang, X., Dickinson, R. E., McGovern, N. N., Jardine, L., Pagan, S., Dimmick, I., Chua, I. C., et al. (2011) · The Journal of Experimental Medicine · doi:10.1084/jem.20101459 · Cited by 304
Self-citationLanglet, C., Tamoutounour, S., Henri, S., Luche, H., Ardouin, L., Grégoire, C., MALISSEN, B., & Guilliams, M. (2012) · The Journal of Immunology · doi:10.4049/jimmunol.1102744 · Cited by 284
Lenz, A., Heine, M., Schuler, G., & Romani, N. (1993) · Journal of Clinical Investigation · doi:10.1172/jci116873 · Cited by 275
Haniffa, M. A., Ginhoux, F., Wang, X., Bigley, V., Abel, M., Dimmick, I., Bullock, S., Grisotto, M. A. G., Booth, T. A., Taub, P. J., et al. (2009) · The Journal of Experimental Medicine · doi:10.1084/jem.20081633 · Cited by 268
Self-citationWatchmaker, P. B., Lahl, K., Lee, M., Baumjohann, D., Morton, J. M., Kim, S. J., Zeng, R., Dent, A. L., Ansel, K. M., Diamond, B., et al. (2013) · Nature Immunology · doi:10.1038/ni.2768 · Cited by 267
Chu, C.-C., Ali, N., Karagiannis, P., Meglio, P. D., Skowera, A., Napolitano, L., Barinaga, G., Grys, K., Sharif‐Paghaleh, E., Karagiannis, S. N., et al. (2012) · The Journal of Experimental Medicine · doi:10.1084/jem.20112583 · Cited by 247
Ontogeny and Functional Specialization of Dendritic Cells in Human and Mouse
Haniffa, M. A., Collin, M. P., & Ginhoux, F. (2013) · Advances in immunology · doi:10.1016/b978-0-12-417028-5.00001-6 · Cited by 199
Self-citationA Three-Dimensional Atlas of Human Dermal Leukocytes, Lymphatics, and Blood Vessels
Wang, X., McGovern, N. N., Gunawan, M., Richardson, C. D., Windebank, M., Siah, T. W., Lim, H. Y., Fink, K., Li, J. L. Y., Ng, L. G., et al. (2013) · Journal of Investigative Dermatology · doi:10.1038/jid.2013.481 · Cited by 140
Self-citationCutting Edge: CD1a+ Antigen-Presenting Cells in Human Dermis Respond Rapidly to CCR7 Ligands1
Angel, C. E., George, E., Brooks, A., Ostrovsky, L., Brown, T. P. L. H., & Dunbar, P. (2006) · Journal of Immunology · doi:10.4049/jimmunol.176.10.5730 · Cited by 127
Stoitzner, P., Zanella, M., Ortner, U., Lukas, M., Tagwerker, A., Janke, K., Lutz, M. B., Schuler, G., Echtenacher, B., Ryffel, B., et al. (1999) · Journal of Leukocyte Biology · doi:10.1002/jlb.66.3.462 · Cited by 119
CD4+ T Cell Responses Elicited by Different Subsets of Human Skin Migratory Dendritic Cells
Morelli, A. E., Rubin, J. P., Erdös, G., Tkacheva, O. A., Mathers, A. R., Zahorchak, A. F., Thomson, A. W., Falo, L. D., & Larregina, A. T. (2005) · The Journal of Immunology · doi:10.4049/jimmunol.175.12.7905 · Cited by 108
de Gruijl, T. D., Sombroek, C. C., Lougheed, S. M., Oosterhoff, D., Buter, J., van den Eertwegh, A. J. M., Scheper, R. J., & Pinedo, H. M. (2006) · The Journal of Immunology · doi:10.4049/jimmunol.176.12.7232 · Cited by 66
Autissier, P., Soulas, C., Burdo, T. H., & Williams, K. C. (2010) · Journal of Immunological Methods · doi:10.1016/j.jim.2010.06.017 · Cited by 62
Han, B., Luo, G., Shi, Z.-Z., Barrios, R. J., Atwood, D., Liu, W., Habib, G. M., Sifers, R. N., Corry, D. B., & Lieberman, M. W. (2002) · American Journal Of Pathology · doi:10.1016/s0002-9440(10)64204-6 · Cited by 56
Matthews, K., Chung, N. P. Y., Klasse, P. J., Moore, J. P., & Sanders, R. W. (2012) · The Journal of Immunology · doi:10.4049/jimmunol.1200601 · Cited by 40
Penel-Sotirakis, K., Simonazzi, E., Navarro, J., & Rozières, A. (2012) · PLoS ONE · doi:10.1371/journal.pone.0045680 · Cited by 40
Jardine, L., Barge, D., Ames-Draycott, A., Pagan, S., Cookson, S., Spickett, G., Haniffa, M. A., Collin, M. P., & Bigley, V. (2013) · Frontiers in Immunology · doi:10.3389/fimmu.2013.00495 · Cited by 37
Self-citation
Cited by
Sorted by citations
Tissue-Resident Macrophage Ontogeny and Homeostasis
Ginhoux, F., & Guilliams, M. (2016) · Immunity · doi:10.1016/j.immuni.2016.02.024 · Cited by 1,884
Self-citationMacrophages and Therapeutic Resistance in Cancer
Ruffell, B., & Coussens, L. M. (2015) · Cancer Cell · doi:10.1016/j.ccell.2015.02.015 · Cited by 1,474
Human dendritic cell subsets: an update
Collin, M., & Bigley, V. (2018) · Immunology · doi:10.1111/imm.12888 · Cited by 1,301
Self-citationDendritic cell-based immunotherapy
Sabado, R. L., Balan, S., & Bhardwaj, N. (2016) · Cell Research · doi:10.1038/cr.2016.157 · Cited by 942
Unsupervised High-Dimensional Analysis Aligns Dendritic Cells across Tissues and Species
Guilliams, M., Dutertre, C., Scott, C. L., McGovern, N. N., Sichien, D., Chakarov, S., Gassen, S. V., Chen, J., Poidinger, M., Prijck, S. D., et al. (2016) · Immunity · doi:10.1016/j.immuni.2016.08.015 · Cited by 824
Self-citation
Metadata
- Authors
- McGovern, N., Schlitzer, A., Gunawan, M., Jardine, L., Shin, A., Poyner, E., Green, K., Dickinson, R., Wang, X.-N., Low, D., Best, K., Covins, S., Milne, P., Pagan, S., Aljefri, K., Windebank, M., Miranda-Saavedra, D., Larbi, A., Wasan, P. S., Duan, K., Poidinger, M., Bigley, V., Ginhoux, F., Collin, M., & Haniffa, M.
- Affiliations
- Agency for Science, Technology and Research (SG)
- Newcastle University (GB)
- Corresponding author
- Collin, Matthew
- Haniffa, Muzlifah
- ORCID
- Venue
- Immunity
- Publisher
- Elsevier BV
- Published
- 2014-09
- Volume
- 41
- Issue
- 3
- Pages
- 465-477
- ISSN
- 1074-7613 (ISSN-L)
- PMC
- PMC4175180
- OpenAlex
- W2144829409
- Cited by
- 281
- References
- 54
- Citations by year
- 2026: 3 · 2025: 12 · 2024: 13 · 2023: 17 · 2022: 11 · 2021: 24 · 2020: 34 · 2019: 32 · 2018: 25 · 2017: 37 · 2016: 31 · 2015: 36 · 2014: 6
- FWCI
- 16.76
- Type
- journal article
- Language
- en
- Update notices
- erratum (2015-02-17)
- Open access
- hybrid
- doi.org
- Licence
- Locations
- Immunity (publishedVersion, cc-by)
- PubMed Central (publishedVersion, cc-by)
- PubMed (publishedVersion)
- Apollo (University of Cambridge) (submittedVersion, cc-by)
- Apollo (cc-by)
- Funders
- Histiocytosis Association
- Wellcome Trust (101155/Z/13/Z, WT088555MA)
- British Skin Foundation
- Leukaemia and Lymphoma Research
- Newcastle University
- AXA Research Fund
- Topics
- Life Sciences › Immunology and Microbiology › Immunology › Immunotherapy and Immune Responses
- Life Sciences › Immunology and Microbiology › Immunology › Immune cells in cancer
- Life Sciences › Immunology and Microbiology › Immunology › Immune Response and Inflammation
- Keywords
- CD14+ cells, monocyte-derived macrophages, dermal macrophages, monocytes, monocyte-to-macrophage differentiation, tissue-resident macrophages, reticuloendothelial system, CD11b, CD64, dendritic cells, CD1c+ dendritic cells, CD103+ dendritic cells, human-mouse comparison, macrophage turnover
- MeSH terms
- Animals, Cell Differentiation, Cell Movement, Cells, Cultured, Dendritic Cells, Female, Humans, Immunologic Memory, Macrophages, Mice, Transgenic, Skin, T-Lymphocytes, Receptors, IgG, Lipopolysaccharide Receptors, Cell Lineage, CD11b Antigen, Mice
About these checks
Registry, retraction, Cites and statistics results are computed, not judged, with one exception: a printed reference that no index lists is read once by a model before it counts as a citation error. Claims are extracted by a model and kept only when their quote appears verbatim in the text; each cited source is then checked, with a model’s help, for whether it says what the claim relies on. Those verdicts can be wrong — read the claim’s quote and the cited source before relying on one.
Statistics and arithmetic are recomputed, not judged.
Confidence bands are shown only for fields calibrated on our annotated test set. None is calibrated yet, so no band is shown.
What counts as a claim ›How we measure confidence ›How we check this ›
Are you an author, or do you see a problem with this page? Request a review
