

The DOI matches its Crossref record; 47 of the 52 references it cites were found in a registry or an index.
Distinct Early Serological Signatures Track with SARS-CoV-2 Survival
Open accessAbstract
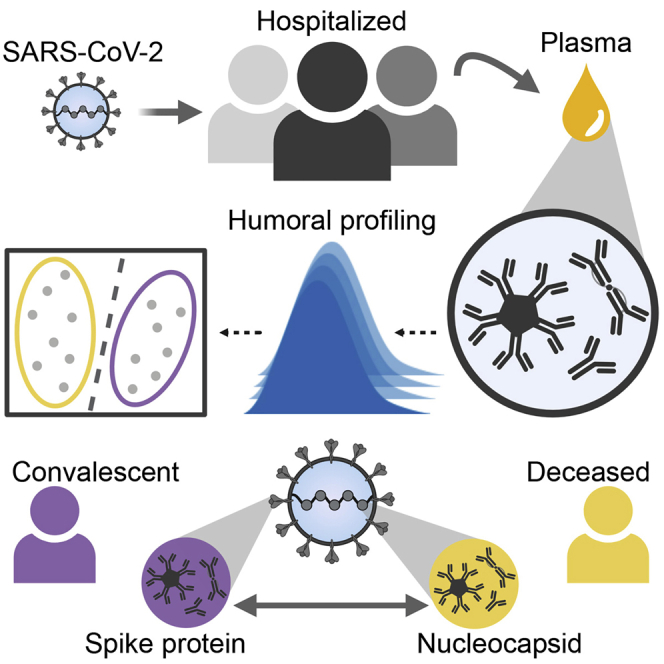
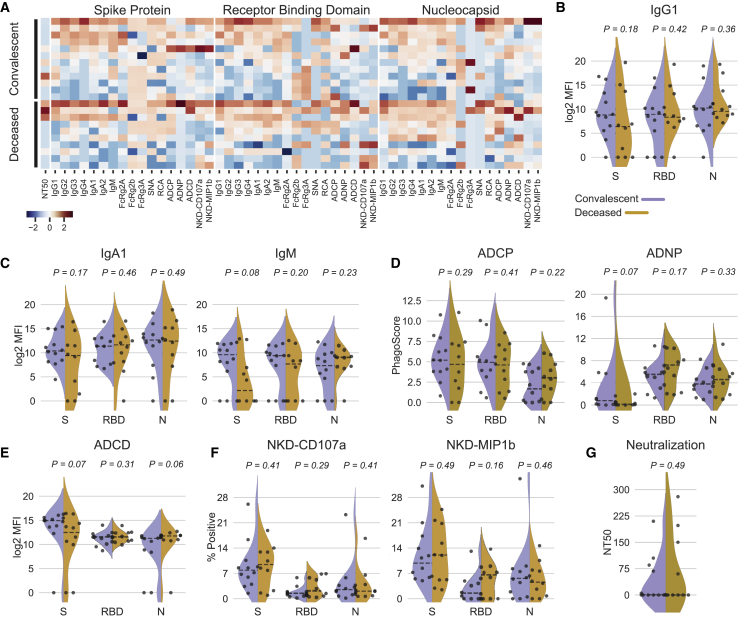
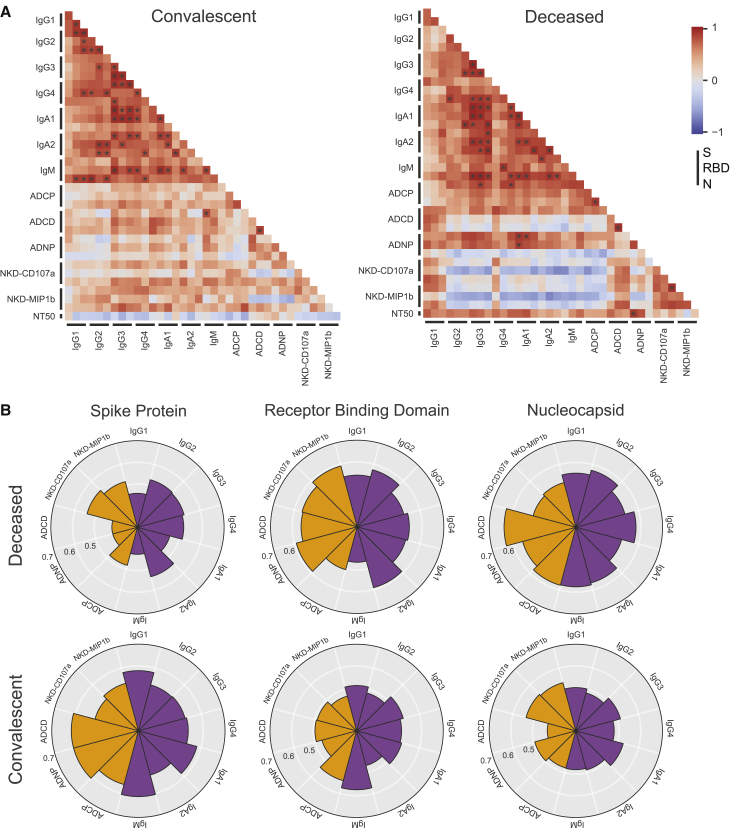
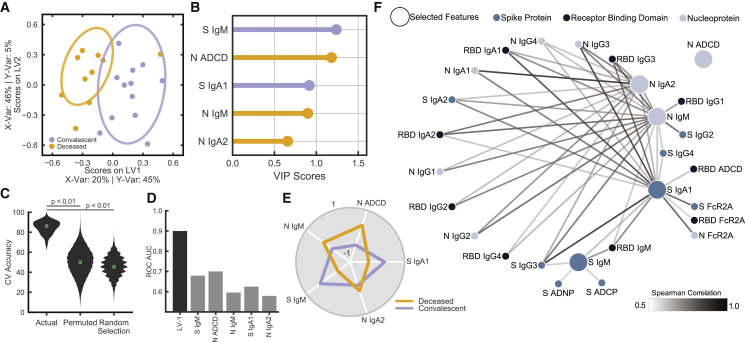
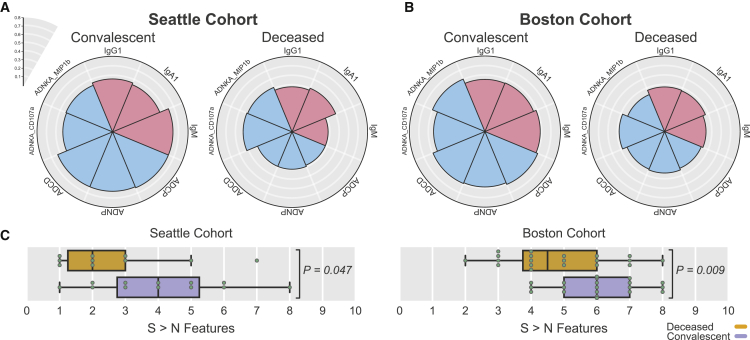
As SARS-CoV-2 infections and death counts continue to rise, it remains unclear why some individuals recover from infection, whereas others rapidly progress and die. Although the immunological mechanisms that underlie different clinical trajectories remain poorly defined, pathogen-specific antibodies often point to immunological mechanisms of protection. Here, we profiled SARS-CoV-2-specific humoral responses in a cohort of 22 hospitalized individuals. Despite inter-individual heterogeneity, distinct antibody signatures resolved individuals with different outcomes. Although no differences in SARS-CoV-2-specific IgG levels were observed, spike-specific humoral responses were enriched among convalescent individuals, whereas functional antibody responses to the nucleocapsid were elevated in deceased individuals. Furthermore, this enriched immunodominant spike-specific antibody profile in convalescents was confirmed in a larger validation cohort. These results demonstrate that early antigen-specific and qualitative features of SARS-CoV-2-specific antibodies point to differences in disease trajectory, highlighting the potential importance of functional antigen-specific humoral immunity to guide patient care and vaccine development.
Overview
The claims and statistics of this paper haven’t been checked yet.
Run the check — free, no account needed. It reads the open-access text and checks the sources it cites.
Integrity signals
Registry
Cites
Statistics
Figures
Verification
Claims the paper makes
The claims and statistics of this paper haven’t been checked yet.
Run the check — free, no account needed. It reads the open-access text and checks the sources it cites.
Claims other papers make about this one
Each is checked against this paper’s own text: does it say what the citing paper says it does?
In the citing paper
“In patients hospitalized with COVID-19, the early presence of broadly functional antibodies directed at the SARS-CoV-2 spike (S) protein (see also Box 1) correlated with survival25”
From Immunological mechanisms of vaccine-induced protection against COVID-19 in humans (2021) · cites this paper as [25]
In the citing paper
“Non-NAbs can also have an important role in protection, however, via Fc-mediated effector functions including antibody-dependent phagocytosis, antibody-dependent cellular cytotoxicity and antibody-dependent natural killer cell activation10,25,31.”
From Immunological mechanisms of vaccine-induced protection against COVID-19 in humans (2021) · cites this paper as [25]
In the citing paper
“A bias toward nucleocapsid antibodies over Spike antibodies in fatal cases was observed in a pair of studies (Atyeo et al., 2020; Zohar et al., 2020), which is consistent with a role for Spike antibodies in reducing viral loads.”
From Adaptive immunity to SARS-CoV-2 and COVID-19 (2021) · cites this paper as Atyeo et al., 2020
Self-check
Percentages, sums and reported differences re-computed from the paper’s own numbers.
The self-check needs the paper’s full text.
Citations
Cites
Scikit-learn: Machine Learning in Python
Pedregosa, F., Varoquaux, G., Gramfort, A., Michel, V., Thirion, B., Grisel, O., Blondel, M., Müller, A., Nothman, J., Louppe, G., et al. (2012) · arXiv · doi:10.48550/arxiv.1201.0490 · Cited by 71,016
A novel coronavirus from patients with pneumonia in China, 2019
Zhu, N., Zhang, D., Wang, W., Li, X., Yang, B., Song, J., Zhao, X., Huang, B., Shi, W., Lu, R., et al. (2020) · New England Journal of Medicine · doi:10.1056/nejmoa2001017 · Cited by 28,244
A new coronavirus associated with human respiratory disease in China
Wu, F., Zhao, S., Yu, B., Chen, Y.-M., Wang, W., Song, Z.-G., Hu, Y., Tao, Z.-W., Tian, J.-H., Pei, Y.-Y., et al. (2020) · Nature · doi:10.1038/s41586-020-2008-3 · Cited by 11,688
An introduction to variable and feature selection
GuyonIsabelle, & ElisseeffAndré (2003) · Journal of Machine Learning Research · doi:10.5555/944919.944968 · Cited by 8,354
An Introduction to Variable and Feature Selection.
Guyon, I., & Elisseeff, A. (2003) · Cited by 6,576
First case of 2019 novel coronavirus in the United States
Holshue, M. L., DeBolt, C., Lindquist, S., Lofy, K. H., Wiesman, J., Bruce, H., Spitters, C., Ericson, K., Wilkerson, S., Tural, A., et al. (2020) · New England Journal of Medicine · doi:10.1056/nejmoa2001191 · Cited by 6,030
Clinical and immunological features of severe and moderate coronavirus disease 2019
Chen, G., Wu, D., Guo, W., Cao, Y., Huang, D., Wang, H., Wang, T., Zhang, X., Chen, H., Yu, H., et al. (2020) · Journal of Clinical Investigation · doi:10.1172/jci137244 · Cited by 4,750
Li, R., Pei, S., Chen, B., Song, Y., Zhang, T., Yang, W., & Shaman, J. (2020) · Science · doi:10.1126/science.abb3221 · Cited by 3,633
SARS and MERS: recent insights into emerging coronaviruses
de Wit, E., van Doremalen, N., Falzarano, D., & Munster, V. J. (2016) · Nature Reviews Microbiology · doi:10.1038/nrmicro.2016.81 · Cited by 3,510
Covid-19 in Critically Ill Patients in the Seattle Region — Case Series
Bhatraju, P. K., Ghassemieh, B. J., Nichols, M., Kim, R., Jerome, K. R., Nalla, A. K., Greninger, A. L., Pipavath, S. N. J., Wurfel, M. M., Evans, L., et al. (2020) · New England Journal of Medicine · doi:10.1056/nejmoa2004500 · Cited by 2,588
Research works printed but not linked: 1
- Wang, 2020, Neutralizing Antibodies Responses to SARS-CoV-2 in COVID-19 Inpatients and Convalescent Patients, Clin. Infect. Dis.
Cited by
Sorted by citations
Adaptive immunity to SARS-CoV-2 and COVID-19
Sette, A., & Crotty, S. (2021) · Cell · doi:10.1016/j.cell.2021.01.007 · Cited by 1,860
SARS-CoV-2 501Y.V2 escapes neutralization by South African COVID-19 donor plasma
Wibmer, C. K., Ayres, F., Hermanus, T., Madzivhandila, M., Kgagudi, P., Oosthuysen, B., Lambson, B. E., de Oliveira, T., Vermeulen, M., van der Berg, K., et al. (2021) · Nature Medicine · doi:10.1038/s41591-021-01285-x · Cited by 1,147
The biological and clinical significance of emerging SARS-CoV-2 variants
Tao, K., Tzou, P. L., Nouhin, J., Gupta, R. K., de Oliveira, T., Kosakovsky Pond, S. L., Fera, D., & Shafer, R. W. (2021) · Nature Reviews Genetics · doi:10.1038/s41576-021-00408-x · Cited by 1,009
Tan, A. T., Linster, M., Tan, C. W., Le Bert, N., Chia, W. N., Kunasegaran, K., Zhuang, Y., Tham, C. Y. L., Chia, A., Smith, G. J. D., et al. (2021) · Cell Reports · doi:10.1016/j.celrep.2021.108728 · Cited by 740
Ewer, K., Barrett, J. R., Belij‐Rammerstorfer, S., Sharpe, H., Makinson, R., Morter, R., Flaxman, A. L., Wright, D., Bellamy, D. G., Bittaye, M., et al. (2020) · Nature Medicine · doi:10.1038/s41591-020-01194-5 · Cited by 587
Metadata
- Authors
- Atyeo, C., Fischinger, S., Zohar, T., Slein, M. D., Burke, J., Loos, C., McCulloch, D. J., Newman, K. L., Wolf, C., Yu, J., Shuey, K., Feldman, J., Hauser, B. M., Caradonna, T., Schmidt, A. G., Suscovich, T. J., Linde, C., Cai, Y., Barouch, D., Ryan, E. T., Charles, R. C., Lauffenburger, D., Chu, H., & Alter, G.
- Affiliations
- Harvard University (US)
- Ragon Institute of MGH, MIT and Harvard (US)
- University of Washington (US)
- Beth Israel Deaconess Medical Center (US)
- Boston Children's Hospital (US)
- Massachusetts General Hospital (US)
- Massachusetts Institute of Technology (US)
- Corresponding author
- Chu, Helen
- Alter, Galit
- ORCID
- Atyeo, Caroline
- Fischinger, Stephanie
- Zohar, Tomer
- Slein, Matthew D.
- Burke, John
- Loos, Carolin
- McCulloch, Denise J.
- Newman, Kira L.
- Wolf, Caitlin
- Yu, Jingyou
- Shuey, Kiel
- Feldman, Jared
- Hauser, Blake Marie
- Caradonna, Tim
- Schmidt, Aaron G.
- Suscovich, Todd J.
- Linde, Caitlyn
- Cai, Yongfei
- Barouch, Dan
- Ryan, Edward T.
- Charles, Richelle C.
- Lauffenburger, Douglas
- Chu, Helen
- Alter, Galit
- Venue
- Immunity
- Publisher
- Elsevier BV
- Published
- 2020-09
- Volume
- 53
- Issue
- 3
- Pages
- 524-532.e4
- ISSN
- 1074-7613 (ISSN-L)
- PMC
- PMC7392190
- OpenAlex
- W3045933491
- Cited by
- 349
- References
- 52
- Citations by year
- 2026: 7 · 2025: 20 · 2024: 30 · 2023: 41 · 2022: 69 · 2021: 138 · 2020: 44
- FWCI
- 9.58
- Type
- journal article
- Language
- en
- Open access
- hybrid
- doi.org
- Licence
- Locations
- Immunity (publishedVersion, cc-by)
- PubMed Central (publishedVersion, cc-by)
- PubMed (publishedVersion)
- Universitätsbibliographie, Universität Duisburg-Essen (submittedVersion)
- DSpace@MIT (Massachusetts Institute of Technology) (submittedVersion, cc-by-nc)
- Funders
- National Institute of Allergy and Infectious Diseases
- Centers for Disease Control and Prevention
- Bill and Melinda Gates Foundation
- Topics
- Health Sciences › Medicine › Infectious Diseases › SARS-CoV-2 and COVID-19 Research
- Health Sciences › Medicine › Infectious Diseases › COVID-19 Clinical Research Studies
- Health Sciences › Medicine › Infectious Diseases › SARS-CoV-2 detection and testing
- Keywords
- SARS-CoV-2, COVID-19 pandemic, humoral immunity, spike-specific antibodies, nucleocapsid antibodies, disease outcome prediction, convalescence, hospitalized patients, immunodominant epitopes
- MeSH terms
- Betacoronavirus, COVID-19, SARS-CoV-2, Coronavirus Nucleocapsid Proteins, Adult, Aged, Aged, 80 and over, Antibodies, Viral, Female, Humans, Immunoglobulin G, Male, Middle Aged, Phosphoproteins, Pneumonia, Viral, Coronavirus Infections, Nucleocapsid Proteins, Immunity, Humoral, Pandemics, Spike Glycoprotein, Coronavirus
About these checks
Registry, retraction, Cites and statistics results are computed, not judged, with one exception: a printed reference that no index lists is read once by a model before it counts as a citation error. Claims are extracted by a model and kept only when their quote appears verbatim in the text; each cited source is then checked, with a model’s help, for whether it says what the claim relies on. Those verdicts can be wrong — read the claim’s quote and the cited source before relying on one.
Statistics and arithmetic are recomputed, not judged.
Confidence bands are shown only for fields calibrated on our annotated test set. None is calibrated yet, so no band is shown.
What counts as a claim ›How we measure confidence ›How we check this ›
Are you an author, or do you see a problem with this page? Request a review
