

The DOI matches its Crossref record; 85 of the 85 references it cites were found in a registry or an index; 29 of the 55 sources its claims cite were checked for support.
Enabling country-scale land cover mapping with meter-resolution satellite imagery
Open accessAbstract
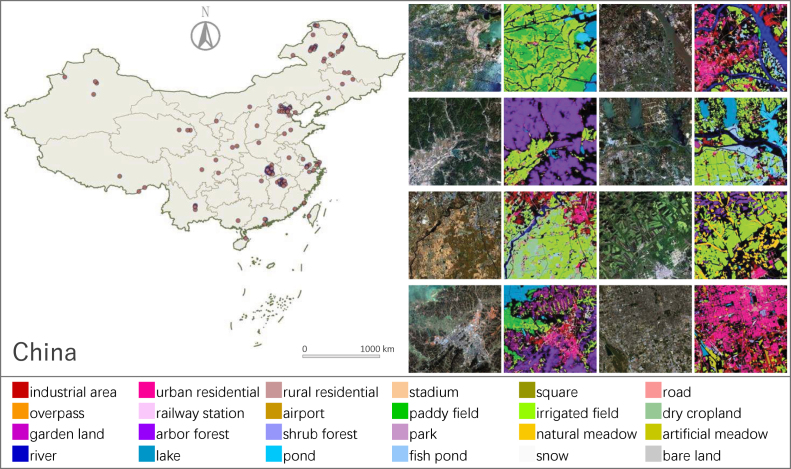
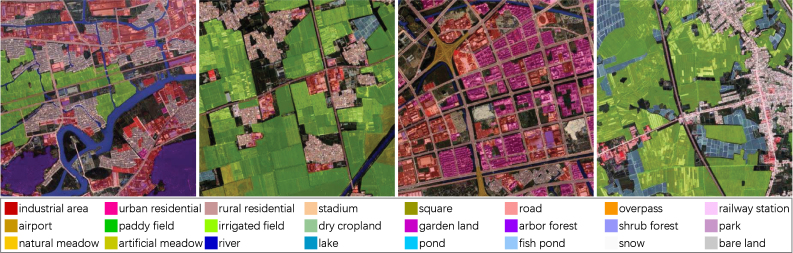
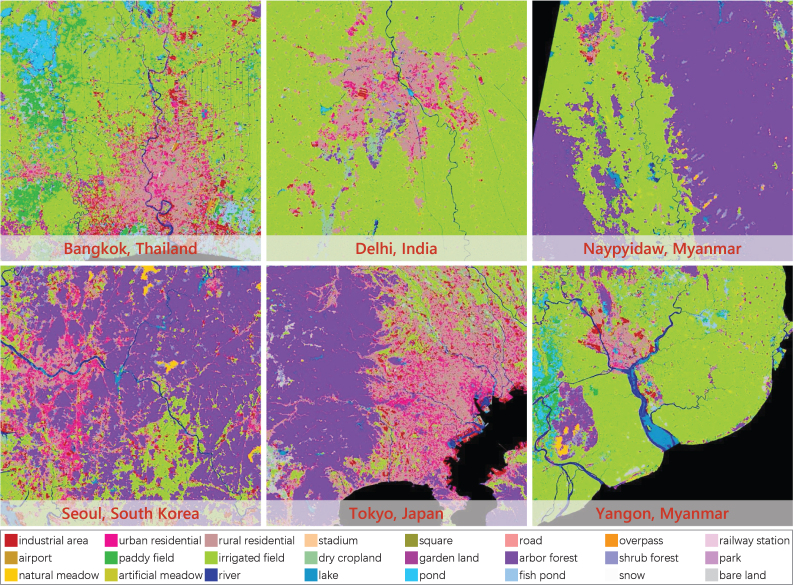
High-resolution satellite images can provide abundant, detailed spatial information for land cover classification, which is particularly important for studying the complicated built environment. However, due to the complex land cover patterns, the costly training sample collections, and the severe distribution shifts of satellite imageries caused by, e.g., geographical differences or acquisition conditions, few studies have applied high-resolution images to land cover mapping in detailed categories at large scale. To fill this gap, we present a large-scale land cover dataset, Five-Billion-Pixels. It contains more than 5 billion labeled pixels of 150 high-resolution Gaofen-2 (4 m) satellite images, annotated in a 24-category system covering artificial-constructed, agricultural, and natural classes. In addition, we propose a deep-learning-based unsupervised domain adaptation approach that can transfer classification models trained on labeled dataset (referred to as the source domain) to unlabeled data (referred to as the target domain) for large-scale land cover mapping. Specifically, we introduce an end-to-end Siamese network employing dynamic pseudo-label assignment and class balancing strategy to perform adaptive domain joint learning. To validate the generalizability of our dataset and the proposed approach across different sensors and different geographical regions, we carry out land cover mapping on five megacities in China and six cities in other five Asian countries severally using: PlanetScope (3 m), Gaofen-1 (8 m), and Sentinel-2 (10 m) satellite images. Over a total study area of 60,000 km2, the experiments show promising results even though the input images are entirely unlabeled. The proposed approach, trained with the Five-Billion-Pixels dataset, enables high-quality and detailed land cover mapping across the whole country of China and some other Asian countries at meter-resolution.
Overview
AI snapshot
Written from the paper’s full text.
TL;DR
The paper introduces Five-Billion-Pixels, a 24-class, 4 m Gaofen-2 land cover dataset with more than 5 billion labeled pixels over 50,000 km² in China, and proposes a Siamese-network unsupervised domain adaptation method with dynamic pseudo-label assignment and class balancing for large-scale mapping. Experiments on five Chinese megacities and six additional Asian cities over 60,000 km² show the approach can map detailed land cover from unlabeled PlanetScope, Gaofen-1, and Sentinel-2 imagery.
Key findings
- Five-Billion-Pixels contains more than 5 billion labeled pixels from 150 GF-2 images, covers over 50,000 km², and uses 24 categories spanning artificial-constructed, agricultural, and natural classes.
- On the Five-Billion-Pixels benchmark, U-Net achieved OA 80.35%, mF1 57.34%, and mIOU 44.51%; DeepLabv3+ achieved OA 79.87%, mF1 54.84%, and mIOU 42.12%, outperforming object-oriented deep models and spectral–spatial methods.
- For five Chinese megacities, the proposed approach reached sparse-label OA 74.08%, mF1 53.87%, mIOU 43.14%, and dense-label OA 81.28%, mF1 46.79%, mIOU 37.36%, outperforming DS-only and compared UDA methods.
- For six additional Asian cities, the proposed approach reached sparse-label OA 81.14%, mF1 51.20%, mIOU 40.81%, and dense-label OA 80.85%, mF1 55.33%, mIOU 43.99%, with adversarial UDA methods showing severe negative adaptation.
Methods
- The dataset was manually annotated in four phases—coarse labeling, fine labeling, fine checking, and spot checking—using GF-2 4 m multispectral imagery; 120 images were used for training and 30 for testing in the benchmark.
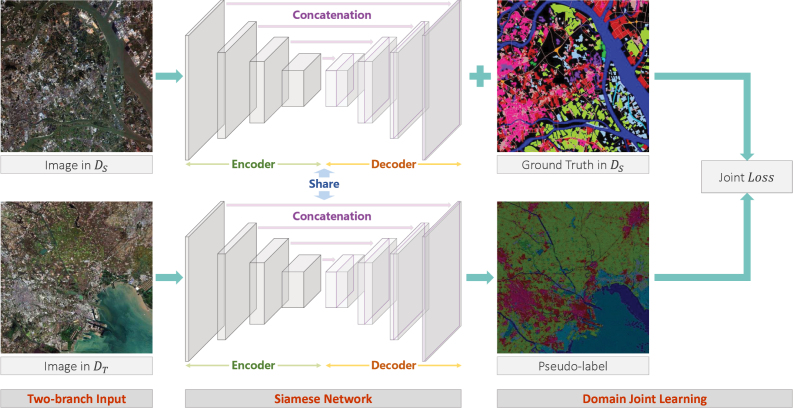
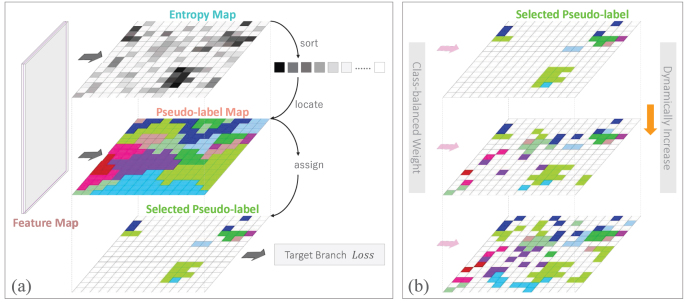
- The UDA approach pre-trains U-Net on Five-Billion-Pixels, builds a Siamese network with shared parameters for source and target branches, assigns pseudo-labels to target pixels selected by lowest Shannon entropy, dynamically increases the number of selected pixels over training, and weights the joint loss by source-domain class distribution.
- Land cover mapping was tested on five Chinese megacities using PlanetScope, Gaofen-1, and Sentinel-2 images and six additional Asian cities using Sentinel-2 images, with evaluation by OA, mF1, mIOU, and UA on sparse and dense labels.
Limitations
- The paper states that obvious errors occur in forested mountains and at mosaic borders, that natural-class classification relies heavily on spectral information and can accumulate pseudo-label errors under spectral shifts, and that lake/river are heavily confused in the additional Asian cities while roads are less refined and discontinuous.
- The paper states that pseudo-labels are difficult to capture contextual information, causing some local misclassifications such as park into pond and garden land in Chengdu, and that λ = 0.9 introduces too many pseudo-label errors while 150 epochs gives limited improvement over 100.
- The text makes evident that the study covers only 11 cities rather than full country-scale mapping, that dense annotation was impossible for entire test images, and that comparison with Dynamic World and World Cover is only an approximate visual comparison due to different acquisition times.
Model-written summary. Check it against the paper before relying on it.
Integrity signals
Registry
Cites
Statistics
Figures
Verification
Claims the paper makes
49 No basis given · 42 Own interpretation · 31 Own result · 16 Partly supported · 5 Sources not found · 4 Supported · 4 Own method · 3 No full text of the sources · 2 Supported so far · 1 Not checked yet · accuracy not yet measured
Every source the paper cites for this claim was checked and supports it.
In the paper
“we propose the Five-Billion-Pixels dataset, which extends the land cover dataset GID (Tong et al., 2020, Yang et al., 2022).”
§ Enabling country-scale land cover mapping with meter-resolution satellite imagery > Introduction > Contribution of this paper
What the sources say
- Supportedcites Tong et al., 2020 source
The Introduction identifies GID as the land-cover classification dataset presented by Tong et al., and Section 4 describes its construction. The citation identifies the dataset that the citing authors say their own Five-Billion-Pixels dataset extends; it does not attribute that extension to Tong et al. (LLM, conf=0.92)
- Supportedcites Yang et al., 2022 source
The citation identifies the GID land-cover dataset that the citing authors say their new dataset extends; it does not attribute Five-Billion-Pixels to Yang et al. The Introduction and Section IV of our copy describe GID-5 and its expansion into GID-15. (LLM, conf=0.88)
plaindirect- Asserted: passes — The authors put it forward as true.
- Checkable: passes — It can be checked against evidence.
- Load-bearing: passes — The paper’s conclusions depend on it.
- Based: passes — The paper gives a reason why it holds.
- Supported
The cited sources support only part of this claim — read each source’s verdict below.
In the paper
“In this context, a rigid alignment of two dispersive domains may further accumulate intra-domain variance (Tsai et al., 2018, Yan et al., 2019).”
§ Enabling country-scale land cover mapping with meter-resolution satellite imagery > Introduction > Related work
What the sources say
- Partly supportedcites Tsai et al., 2018 sourceExperimental — accuracy not yet measured
The Introduction says feature alignment across domains can be difficult for semantic segmentation because high-dimensional features encode diverse visual cues. Section 6.1 (GTA5) also reports that feature-space adaptation can fail to match source and target distributions effectively. Neither passage says rigid alignment of dispersive domains accumulates intra-domain variance; no page numbers are available in our copy. (LLM, conf=0.79)
- Not checked — no full text of the sourcecites Yan et al., 2019 source
hedgedconditional- Asserted: passes — The authors put it forward as true.
- Checkable: passes — It can be checked against evidence.
- Load-bearing: passes — The paper’s conclusions depend on it.
- Based: passes — The paper gives a reason why it holds.
- Partly supported
The cited sources support only part of this claim — read each source’s verdict below.
In the paper
“Thus, compared with conventional land cover classification methods, deep models can accurately characterize complex contextual information contained in high-resolution images (Tong et al., 2020, Huang et al., 2018a, Zhang et al., 2019, Srivastava et al., 2019, Zhong et al., 2020).”
§ Enabling country-scale land cover mapping with meter-resolution satellite imagery > Introduction > Related work
What the sources say
- Supportedcites Tong et al., 2020 source
The Introduction says conventional spectral and spectral-spatial features struggle to describe contextual information in high-resolution images, while CNNs can depict high-level image features. Related work says deep approaches learn discriminative features, and the Conclusion reports that the proposed model uses multi-scale contextual information for classification. (LLM, conf=0.92)
- Not matchedcites Huang et al., 2018a
Couldn’t be matched to a paper in Crossref, so it can’t be checked.
- Supportedcites Zhang et al., 2019 source
The Introduction (page not provided) contrasts conventional methods’ hand-crafted features with deep learning’s higher-level feature representations and notes the difficulty of describing complex spatial context with rules. Section 4.1 says the proposed deep model automatically extracts spatial and hierarchical features, and the Discussion reports accurate classification on very fine spatial resolution imagery. Together, these support the citing sentence’s broad comparison. (LLM, conf=0.88)
plaindirect- Asserted: passes — The authors put it forward as true.
- Checkable: passes — It can be checked against evidence.
- Load-bearing: passes — The paper’s conclusions depend on it.
- Based: passes — The paper gives a reason why it holds.
- Supported
The cited sources support only part of this claim — read each source’s verdict below.
In the paper
“The current approaches are empirically choosing a confidence threshold (Xu et al., 2020, Peng et al., 2021) or setting a fixed proportion for sample collection (Tong et al., 2020, Zhang et al., 2021a, Yan et al., 2019, Wang et al., 2022), which is hard to guarantee the accuracy of pseudo-labels assigned by the prediction model to its unknown domain.”
§ Enabling country-scale land cover mapping with meter-resolution satellite imagery > Introduction > Related work
What the sources say
- Not matchedcites Xu et al., 2020
Couldn’t be matched to a paper in Crossref, so it can’t be checked.
- Not checked — no full text of the sourcecites Peng et al., 2021 source
- Partly supportedcites Tong et al., 2020 sourceExperimental — accuracy not yet measured
Section 3.2.2 says the method selects the top µ target samples in each category and acknowledges that pseudo-labels may be inaccurate. But µ is a fixed number, not a fixed proportion, and the method additionally checks pseudo-labels against labeled source samples before using them. The copy provides no page number for these passages. (LLM, conf=0.88)
plaindirect- Asserted: passes — The authors put it forward as true.
- Checkable: passes — It can be checked against evidence.
- Load-bearing: passes — The paper’s conclusions depend on it.
- Based: passes — The paper gives a reason why it holds.
- Not matched
The cited sources support only part of this claim — read each source’s verdict below.
In the paper
“their performance strongly relies on the quality and quantity of training data (LeCun et al., 2015, Xia et al., 2017, Ding et al., 2021)”
§ Enabling country-scale land cover mapping with meter-resolution satellite imagery > Introduction > Related work
What the sources say
- Not checked — no full text of the sourcecites LeCun et al., 2015 source
- Partly supportedcites Xia et al., 2017 sourceExperimental — accuracy not yet measured
Section 2.3 says that training large deep networks on aerial datasets with only hundreds or thousands of images can lead to overfitting and lower accuracy, supporting the importance of training-data quantity. The paper discusses dataset diversity and image relevance, but the cited passages do not establish a comparable dependence of model performance on training-data quality. (LLM, conf=0.84)
- Not matchedcites Ding et al., 2021
Couldn’t be matched to a paper in Crossref, so it can’t be checked.
boosteddirect- Asserted: passes — The authors put it forward as true.
- Checkable: passes — It can be checked against evidence.
- Load-bearing: passes — The paper’s conclusions depend on it.
- Based: passes — The paper gives a reason why it holds.
The cited sources support only part of this claim — read each source’s verdict below.
In the paper
“an incomplete category system will make the model unable to meet the actual mapping requirements (Long et al., 2021, Xiong et al., 2022).”
§ Enabling country-scale land cover mapping with meter-resolution satellite imagery > Introduction > Related work
What the sources say
- Partly supportedcites Long et al., 2021 sourceExperimental — accuracy not yet measured
In “Categories Involved in Interpretation” (page unavailable), the paper says datasets with limited scene categories cannot capture the varied semantic content of remote-sensing images. In “IV. An Example: Million-AID” (page unavailable), it says models trained on such datasets usually have weak generalization and emphasizes category completeness for practical applications. It does not establish that an incomplete category system necessarily makes a model unable to meet actual mapping requirements. (LLM, conf=0.82)
- Not checked yetcites Xiong et al., 2022 source
Checked before — its earlier verdict is held back until a new check runs.
plaindirect- Asserted: passes — The authors put it forward as true.
- Checkable: passes — It can be checked against evidence.
- Load-bearing: passes — The paper’s conclusions depend on it.
- Based: passes — The paper gives a reason why it holds.
- Partly supported
The cited sources support only part of this claim — read each source’s verdict below.
In the paper
“Even if a practicable deep model is already trained on a well-annotated dataset, it may not be valid for other geographical areas or sensors because of the feature distribution shifts between the source and target domains (Tuia et al., 2016, Tong et al., 2020, Huang et al., 2023).”
§ Enabling country-scale land cover mapping with meter-resolution satellite imagery > Introduction > Related work
What the sources say
- Partly supportedcites Tuia et al., 2016 sourceExperimental — accuracy not yet measured
The Introduction says a pre-trained model may not transfer accurately to a new image, and the Transfer Learning and Domain Adaptation section describes different geographical areas and shifts in feature distributions. The discussion of mosaicking also explains why a model trained for one sensor may not work with another. These passages concern classifiers generally, however; they do not establish the claim specifically for deep models. (LLM, conf=0.84)
- Supportedcites Tong et al., 2020 source
The Introduction states that deep models trained on annotated remote-sensing images may not be effective for images from different sensors or geographic locations because object distributions and spectral properties differ. Section 3.2 likewise says changes in acquisition conditions can prevent satisfactory classification of multi-source images. (LLM, conf=0.94)
- Supportedcites Huang et al., 2023 source
The Introduction explains that labeled source datasets may not transfer well to target datasets because of domain shifts, including shifts associated with different capturing equipment. The feature-distribution visualization describes a cross-domain gap and the need for feature alignment. Together, these support the citing sentence’s hedged claim; the copy does not specifically name geographical areas. (LLM, conf=0.88)
hedgedconditional- Asserted: passes — The authors put it forward as true.
- Checkable: passes — It can be checked against evidence.
- Load-bearing: passes — The paper’s conclusions depend on it.
- Based: passes — The paper gives a reason why it holds.
- Partly supported
The cited sources support only part of this claim — read each source’s verdict below.
In the paper
“To adapt DCNNs to a new domain, there is no better way than having examples of its feature distribution (Tuia et al., 2016).”
§ Enabling country-scale land cover mapping with meter-resolution satellite imagery > Methodology > Domain joint learning for unsupervised domain adaptation
What the sources say
- Partly supportedcites Tuia et al., 2016 sourceExperimental — accuracy not yet measured
The section “Adaptation of the classifier by active learning” says that labeled examples from the target domain can efficiently help adapt a classifier. It does not address DCNNs specifically or establish that having examples of the target feature distribution is the best way to adapt them. Page numbers are unavailable in our copy. (LLM, conf=0.85)
boosteddirect- Asserted: passes — The authors put it forward as true.
- Checkable: passes — It can be checked against evidence.
- Load-bearing: passes — The paper’s conclusions depend on it.
- Based: passes — The paper gives a reason why it holds.
- Partly supported
The cited sources support only part of this claim — read each source’s verdict below.
In the paper
“In contrast, semantic segmentation models can predict dense classification maps for arbitrary-sized images in an end-to-end, pixels-to-pixels manner (Wurm et al., 2019, Chen et al., 2020, Mou et al., 2019).”
§ Enabling country-scale land cover mapping with meter-resolution satellite imagery > Methodology > Semantic segmentation model for land cover classification
What the sources say
- Not checked — no full text of the sourcecites Wurm et al., 2019 source
- Partly supportedcites Chen et al., 2020 sourceExperimental — accuracy not yet measured
The Introduction says semantic segmentation models provide dense labels within an image patch, and §3.4.2 describes a pixel-labeling architecture whose output has the same dimensions as its input. The paper does not establish that the models accept arbitrary-sized images or explicitly describe prediction as end-to-end; §3.4.3 instead discusses testing specific patch sizes. Page numbers are unavailable in our copy. (LLM, conf=0.82)
- Partly supportedcites Mou et al., 2019 sourceExperimental — accuracy not yet measured
Section 3.1 (Overview; page unavailable) describes a fully convolutional network that upsamples feature maps to full resolution to produce segmentation maps. Section 2 (Related Work; page unavailable) also describes deep CNNs as enabling end-to-end aerial image parsing. Our copy does not establish that the model accepts arbitrary-sized images, so that part of the claim is unsupported. (LLM, conf=0.84)
plaindirect- Asserted: passes — The authors put it forward as true.
- Checkable: passes — It can be checked against evidence.
- Load-bearing: passes — The paper’s conclusions depend on it.
- Based: passes — The paper gives a reason why it holds.
A result the paper reports from its own data — it cites no other source for it, so there is none to check. The quote shows it is in the paper.
In the paper
“It contains more than 5 billion labeled pixels of 150 high-resolution Gaofen-2 (4 m) satellite images, annotated in a 24-category system covering artificial-constructed, agricultural, and natural classes.”
- Also stated in: § Study data · plain
“Our new dataset, named Five-Billion-Pixels, consists of 150 GF-2 satellite images annotated in a more complete category system (see Fig. 1).”
§ Enabling country-scale land cover mapping with meter-resolution satellite imagery > Abstract
plain- Asserted: passes — The authors put it forward as true.
- Checkable: passes — It can be checked against evidence.
- Load-bearing: passes — The paper’s conclusions depend on it.
- Based: passes — The paper gives a reason why it holds.
- Also stated in: § Study data · plain
- Probably not a substantial claim. 41
- It may state two separate claims as one. 55
- The quote only partly states this claim. 1
The cited sources support only part of this claim — read each source’s verdict below.
In the paper
“An insufficient amount of data may lead to overfitting of the model”
§ Enabling country-scale land cover mapping with meter-resolution satellite imagery > Introduction > Related work
What the sources say
- Supportedcites Long et al., 2021 source
The “Diversity” section explicitly says that insufficient images and samples are more likely to cause overfitting during model training, particularly for data-driven interpretation methods. This supports the citing sentence’s hedged claim. (LLM, conf=0.94)
- Not matchedcites Xiong et al., 2022
Couldn’t be matched to a paper in Crossref, so it can’t be checked.
hedgedconditional- Asserted: passes — The authors put it forward as true.
- Checkable: passes — It can be checked against evidence.
- Load-bearing: fails — The paper’s conclusions may not depend on it.
- Based: passes — The paper gives a reason why it holds.
Probably not a substantial claim. The paper’s conclusions may not depend on it.
- Supported
Every source the paper cites for this claim was checked and supports it.
In the paper
“The attendant problem is that diverse imaging conditions will lead to shifts in feature distributions of ground objects, which causes the classification method optimal for certain annotated images (referred to as the source domain) to drop drastically in performance on newly acquired images (referred to as the target domain) (Tuia et al., 2016, Tong et al., 2020).”
§ Enabling country-scale land cover mapping with meter-resolution satellite imagery > Introduction > Motivation
What the sources say
- Supportedcites Tuia et al., 2016 source
The Target domain section says that source and target distributions may differ because of changes in image-acquisition conditions. The Selecting invariant features section reports that features selected for source-domain accuracy achieved 92.7% accuracy on the source but only 64.4% on the target. Page numbers were not supplied in the passages. (LLM, conf=0.93)
- Supportedcites Tong et al., 2020 source
The Introduction says that different acquisition conditions cause shifts in object distributions and spectral responses, making models trained on annotated images less effective on images from other sensors or locations. It also says that classification models learned from annotated images quickly lose effectiveness on new images. (LLM, conf=0.94)
plaindirect- Asserted: passes — The authors put it forward as true.
- Checkable: passes — It can be checked against evidence.
- Load-bearing: passes — The paper’s conclusions depend on it.
- Based: passes — The paper gives a reason why it holds.
It may state two separate claims as one.
- Supported
The sources with a verdict support this claim; the rest weren’t checked yet, have no full text we could read, or their verdicts aren’t rated yet.
In the paper
“The essential idea of these two types of UDA methods is to align the feature distributions of the source and target domains (Sun and Saenko, 2016, Ganin et al., 2016, Wang et al., 2021).”
§ Enabling country-scale land cover mapping with meter-resolution satellite imagery > Introduction > Related work
What the sources say
- Not checked — no full text of the sourcecites Sun and Saenko, 2016 source
- Not matchedcites Ganin et al., 2016
Couldn’t be matched to a paper in Crossref, so it can’t be checked.
- Supportedcites Wang et al., 2021 source
Section 2.2 says discrepancy-based studies minimize differences between feature distributions to extract domain-invariant features. It also describes adversarial training as learning domain-invariant features and gives examples that align class-level features. (LLM, conf=0.91)
plaindirect- Asserted: passes — The authors put it forward as true.
- Checkable: passes — It can be checked against evidence.
- Load-bearing: fails — The paper’s conclusions may not depend on it.
- Based: passes — The paper gives a reason why it holds.
Probably not a substantial claim. The paper’s conclusions may not depend on it.
The cited sources support only part of this claim — read each source’s verdict below.
In the paper
“insufficient data diversity may lead to low generalization capability of the model”
§ Enabling country-scale land cover mapping with meter-resolution satellite imagery > Introduction > Related work
What the sources say
- Supportedcites Long et al., 2021 source
The Discussion states that dataset diversity is important for training interpretation algorithms with strong generalization ability. The Diversity section likewise says that varied annotated objects help train models with greater application generalization. The claim is a hedged paraphrase of that relationship in the paper’s aerial-image interpretation context. (LLM, conf=0.91)
- Not matchedcites Xiong et al., 2022
Couldn’t be matched to a paper in Crossref, so it can’t be checked.
hedgedconditional- Asserted: passes — The authors put it forward as true.
- Checkable: passes — It can be checked against evidence.
- Load-bearing: passes — The paper’s conclusions depend on it.
- Based: passes — The paper gives a reason why it holds.
Probably not a substantial claim.
- Supported
The sources with a verdict support this claim; the rest weren’t checked yet, have no full text we could read, or their verdicts aren’t rated yet.
In the paper
“But most of them have geographical coverage areas below 10 km2 and are located in concentrated regions, such as ISPRS Potsdam (ISPRS-Contest, 2018), ISPRS Vaihingen (ISPRS-Contest, 2018), Zurich Summer (Volpi and Ferrari, 2015), RIT-18 (Kemker et al., 2018), and Zeebruges (Marcos et al., 2018).”
§ Enabling country-scale land cover mapping with meter-resolution satellite imagery > Introduction > Related work
What the sources say
- Not matchedcites ISPRS-Contest, 2018
Couldn’t be matched to a paper in Crossref, so it can’t be checked.
- Not checked — no full text of the sourcecites Volpi and Ferrari, 2015 source
- Supportedcites Kemker et al., 2018 source
The citation identifies RIT-18 as an example, rather than attributing the claim about most datasets to this paper alone. Section 4.3 (p. 19) gives three labeled orthomosaics whose dimensions, at the paper’s 0.047 m ground sample distance (Section 2.4, p. 9), imply a combined area well below 10 km². Section 4.1 (p. 19) places all three within Hamlin Beach State Park, though the test imagery comes from a different location in the park. (LLM, conf=0.92)
plaincorrelational- Asserted: passes — The authors put it forward as true.
- Checkable: passes — It can be checked against evidence.
- Load-bearing: passes — The paper’s conclusions depend on it.
- Based: passes — The paper gives a reason why it holds.
It may state two separate claims as one.
- Not matched
The cited sources support only part of this claim — read each source’s verdict below.
In the paper
“Although they are highly accurate and real-time, they cover only basic land cover categories (11 and 9 classes) and have limited ability to depict urban environments.”
§ Enabling country-scale land cover mapping with meter-resolution satellite imagery > Introduction > Motivation
What the sources say
- Not matchedcites Zanaga et al., 2021
Couldn’t be matched to a paper in Crossref, so it can’t be checked.
- Partly supportedcites Brown et al., 2022 sourceExperimental — accuracy not yet measured
The Methods taxonomy (page unavailable) lists nine broad Dynamic World classes, including a single built-area class. Usage Notes says built area, as a mixed class, had lower accuracy in one derived-product assessment, but Technical Validation reports high agreement for built area in single-image predictions. The paper does not establish WorldCover’s 11-class count or assess its ability to depict urban environments, so it supports only the Dynamic World portion of the claim. (LLM, conf=0.85)
plain- Asserted: passes — The authors put it forward as true.
- Checkable: passes — It can be checked against evidence.
- Load-bearing: passes — The paper’s conclusions depend on it.
- Based: passes — The paper gives a reason why it holds.
It may state two separate claims as one.
- Not matched
The cited sources support only part of this claim — read each source’s verdict below.
In the paper
“There are two general strategies for deep-learning-based land cover classification: object-oriented approaches based on DCNNs and semantic segmentation approaches based on end-to-end DCNNs.”
§ Enabling country-scale land cover mapping with meter-resolution satellite imagery > Methodology > Semantic segmentation model for land cover classification
What the sources say
- Not matchedcites Huang et al., 2018a
Couldn’t be matched to a paper in Crossref, so it can’t be checked.
- Partly supportedcites Zhang et al., 2019 sourceExperimental — accuracy not yet measured
Section 2.3 describes an object-based CNN, but uses it for land-use rather than land-cover classification. Section 4.2 also discusses fully convolutional networks for semantic segmentation. The paper does not present these as the two general strategies for deep-learning-based land-cover classification. (LLM, conf=0.85)
- Partly supportedcites Srivastava et al., 2019 sourceExperimental — accuracy not yet measured
The Introduction and Related Work distinguishes CNN-based patch classification from classifying all pixels in one forward pass, and the Methods contrasts urban-object classification with pixel-level semantic segmentation. It does not frame these as the two general strategies for deep-learning-based land-cover classification, or specify the claimed object-oriented DCNN versus end-to-end DCNN division. Page numbers are not available in our copy. (LLM, conf=0.82)
plain- Asserted: passes — The authors put it forward as true.
- Checkable: passes — It can be checked against evidence.
- Load-bearing: fails — The paper’s conclusions may not depend on it.
- Based: passes — The paper gives a reason why it holds.
Probably not a substantial claim. The paper’s conclusions may not depend on it. It may state two separate claims as one.
- Not matched
Every source the paper cites for this claim was checked and supports it.
In the paper
“Class balancing is a common strategy for the training of semantic segmentation models (Long et al., 2015), but it is rarely used in UDA approaches because the category information in the target domain is unknown.”
§ Enabling country-scale land cover mapping with meter-resolution satellite imagery > Methodology > Domain joint learning for unsupervised domain adaptation
What the sources say
- Supportedcites Long et al., 2015 source
The citation attaches to the claim that class balancing is a strategy for training semantic segmentation models, not to the later explanation about UDA. The Experimental framework (p. 6) describes balancing classes by weighting or sampling the loss, and Results (p. 8) identifies a prior segmentation model trained on class-balanced samples. Long et al. found balancing unnecessary for their own data; the citing sentence does not claim they used it. (LLM, conf=0.86)
plaindirect- Asserted: passes — The authors put it forward as true.
- Checkable: passes — It can be checked against evidence.
- Load-bearing: passes — The paper’s conclusions depend on it.
- Based: passes — The paper gives a reason why it holds.
Probably not a substantial claim. It may state two separate claims as one.
- Supported
The cited sources support only part of this claim — read each source’s verdict below.
In the paper
“Siamese network has two branches, each of which have an input and an output (Zagoruyko and Komodakis, 2015). The two branches have an identical architecture and share the same parameters during both initialization and training, which allows the Siamese network to learn information from two distributions simultaneously, as presented in Fig. 7.”
§ Enabling country-scale land cover mapping with meter-resolution satellite imagery > Methodology > Domain joint learning for unsupervised domain adaptation
What the sources say
- Partly supportedcites Zagoruyko and Komodakis, 2015 sourceExperimental — accuracy not yet measured
Section 3.1 (page not provided) describes a Siamese network with two branches that have identical architecture and share weights; each branch takes one image patch as input and produces an output. It does not say that this arrangement lets the network learn from two distributions simultaneously, or discuss parameter sharing specifically during initialization. (LLM, conf=0.86)
plaindirect- Asserted: passes — The authors put it forward as true.
- Checkable: passes — It can be checked against evidence.
- Load-bearing: passes — The paper’s conclusions depend on it.
- Based: passes — The paper gives a reason why it holds.
Probably not a substantial claim.
- Partly supported
The cited sources support only part of this claim — read each source’s verdict below.
In the paper
“The built environment and the quality of people’s lives are under the combined effects of various land categories (Zhu et al., 2022)”
§ Enabling country-scale land cover mapping with meter-resolution satellite imagery > Discussion > What information is important for land cover classification?
What the sources say
- Partly supportedcites Zhu et al., 2022 sourceExperimental — accuracy not yet measured
The Perspectives and discussions section says that how cities are physically built shapes quality of life, and the Experimental results section describes different built-up land classes and possible inequality in living conditions. The paper does not establish that various land categories have a combined effect on both the built environment and quality of life. (LLM, conf=0.82)
plaindirect- Asserted: passes — The authors put it forward as true.
- Checkable: fails — It may be too vague to check against evidence.
- Load-bearing: fails — The paper’s conclusions may not depend on it.
- Based: passes — The paper gives a reason why it holds.
Probably not a substantial claim. It may be too vague to check against evidence. The paper’s conclusions may not depend on it.
- Partly supported
Every source the paper cites for this claim was checked and supports it.
In the paper
“It is worth noting that U-Net specially achieves concatenation of each corresponding encoding and decoding stages using skip connection of feature maps, as illustrated in Fig. 7, so that more raw information of the input image is retained and added to the decoding path.”
§ Enabling country-scale land cover mapping with meter-resolution satellite imagery > Methodology > Semantic segmentation model for land cover classification
What the sources say
- Supportedcites Ronneberger et al., 2015 source
The Network Architecture section (p. 4) describes each expansive-path step concatenating its upsampled feature map with the corresponding cropped feature map from the contracting path. The Introduction (p. 2) explains that combining high-resolution contracting-path features with the upsampled output helps localization. The claim's ‘raw information’ refers to those carried-over features, not a separate transfer of raw input pixels. (LLM, conf=0.90)
plaindirect- Asserted: passes — The authors put it forward as true.
- Checkable: passes — It can be checked against evidence.
- Load-bearing: fails — The paper’s conclusions may not depend on it.
- Based: passes — The paper gives a reason why it holds.
Probably not a substantial claim. The paper’s conclusions may not depend on it.
- Supported
The cited sources support only part of this claim — read each source’s verdict below.
In the paper
“The recognition of these categories relies heavily on textural and spectral information. U-Net has stronger discriminative ability for them because it retains more raw image information through the concatenation structure (Ronneberger et al., 2015).”
§ Enabling country-scale land cover mapping with meter-resolution satellite imagery > Experiments > Benchmark on Five-Billion-Pixels
What the sources say
- Partly supportedcites Ronneberger et al., 2015 sourceExperimental — accuracy not yet measured
The Network Architecture section (p. 4) describes concatenating feature maps from the contracting path with upsampled features, and Experiments (pp. 6–7) reports strong segmentation results. The paper does not say that the cited categories depend on textural and spectral information, that concatenation retains more raw image information, or that this explains U-Net’s performance on those categories. (LLM, conf=0.88)
boosteddirect- Asserted: passes — The authors put it forward as true.
- Checkable: passes — It can be checked against evidence.
- Load-bearing: unclear — It is unclear whether the paper’s conclusions depend on it.
- Based: passes — The paper gives a reason why it holds.
It may state two separate claims as one.
- Partly supported
The cited sources support only part of this claim — read each source’s verdict below.
In the paper
“Sentinel satellite data are utilized in the state-of-the-art global land cover mapping projects, ESA’s World Cover (Zanaga et al., 2021) and Google’s Dynamic World (Brown et al., 2022).”
§ Enabling country-scale land cover mapping with meter-resolution satellite imagery > Discussion > What can be further done based on our dataset and approach?
What the sources say
- Not matchedcites Zanaga et al., 2021
Couldn’t be matched to a paper in Crossref, so it can’t be checked.
- Supportedcites Brown et al., 2022 source
The Background & Summary section identifies Dynamic World as a global land-use and land-cover dataset generated from Sentinel-2 imagery. The Data Records section confirms that its images are derived from Sentinel-2 assets. Brown et al. is cited for Dynamic World, not ESA’s WorldCover; page numbers are not provided in our copy. (LLM, conf=0.94)
plain- Asserted: passes — The authors put it forward as true.
- Checkable: passes — It can be checked against evidence.
- Load-bearing: fails — The paper’s conclusions may not depend on it.
- Based: passes — The paper gives a reason why it holds.
Probably not a substantial claim. The paper’s conclusions may not depend on it.
- Not matched
The paper states this without a source or data behind it here, so there is nothing to check it against. The quote shows it is in the paper.
In the paper
“agricultural and natural categories that are easier to classify occupy a larger total area in these six cities, and there are fewer complex urban functional classes located in the test areas.”
§ Enabling country-scale land cover mapping with meter-resolution satellite imagery > Experiments > Land cover mapping
plaincorrelational- Asserted: passes — The authors put it forward as true.
- Checkable: passes — It can be checked against evidence.
- Load-bearing: passes — The paper’s conclusions depend on it.
- Based: passes — The paper gives a reason why it holds.
It may state two separate claims as one.
A result the paper reports from its own data — it cites no other source for it, so there is none to check. The quote shows it is in the paper.
In the paper
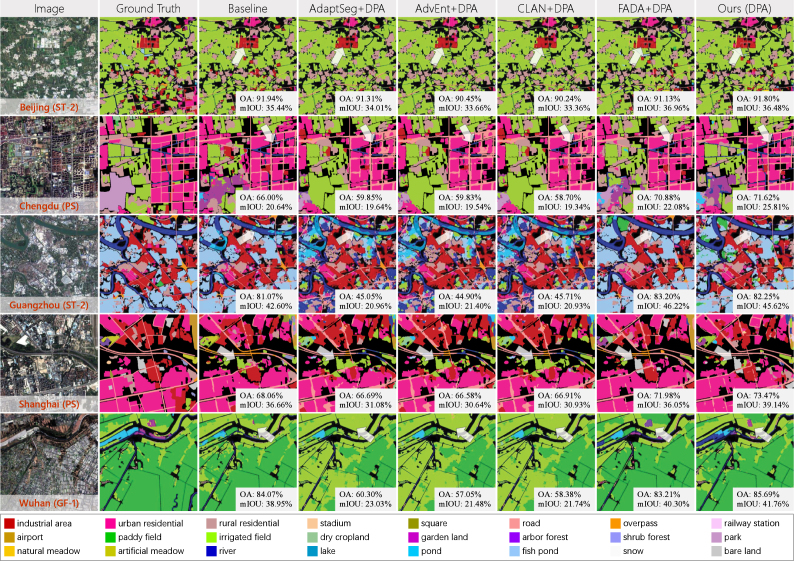
“The adversarial-based UDA methods demonstrate severe negative adaptation; they tend to classify complex areas into common categories when the distributions of the source and target domains are very different.”
§ Enabling country-scale land cover mapping with meter-resolution satellite imagery > Experiments > Land cover mapping
boosteddirect- Asserted: passes — The authors put it forward as true.
- Checkable: passes — It can be checked against evidence.
- Load-bearing: passes — The paper’s conclusions depend on it.
- Based: passes — The paper gives a reason why it holds.
It may state two separate claims as one.
A result the paper reports from its own data — it cites no other source for it, so there is none to check. The quote shows it is in the paper.
In the paper
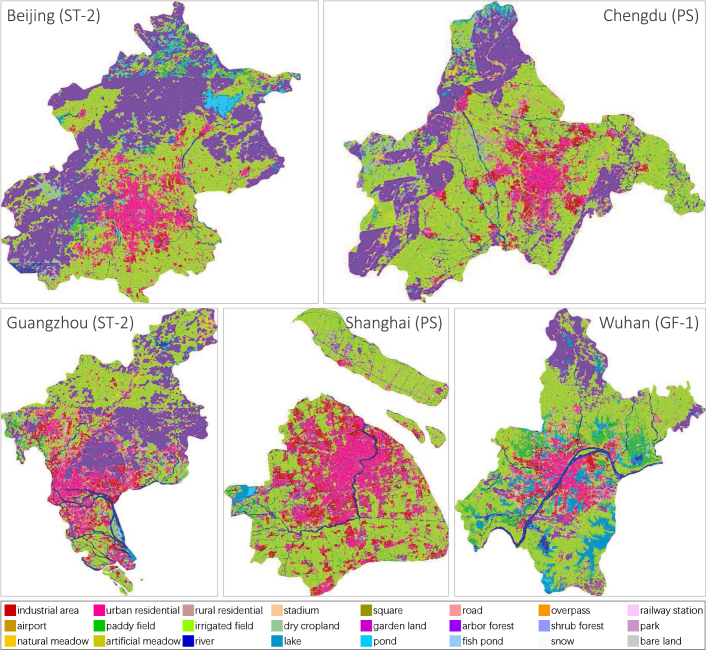
“Fish pond along the coast of Guangzhou and paddy field in the suburbs of Wuhan are correctly identified.”
§ Enabling country-scale land cover mapping with meter-resolution satellite imagery > Experiments > Land cover mapping
plaindirect- Asserted: passes — The authors put it forward as true.
- Checkable: passes — It can be checked against evidence.
- Load-bearing: unclear — It is unclear whether the paper’s conclusions depend on it.
- Based: passes — The paper gives a reason why it holds.
It may state two separate claims as one.
None of the sources cited for this claim have been checked yet.
In the paper
“ResNet101 behaves better than GoogLeNet in overall and has significantly superior results on railway station, airport, shrub forest, natural meadow, and artificial meadow.”
§ Enabling country-scale land cover mapping with meter-resolution satellite imagery > Experiments > Benchmark on Five-Billion-Pixels
plaindirect- Asserted: passes — The authors put it forward as true.
- Checkable: passes — It can be checked against evidence.
- Load-bearing: unclear — It is unclear whether the paper’s conclusions depend on it.
- Based: passes — The paper gives a reason why it holds.
It may state two separate claims as one.
A result the paper reports from its own data — it cites no other source for it, so there is none to check. The quote shows it is in the paper.
In the paper
“DeepLabv3+ performs better on river than U-Net. And U-Net can recognize lake and irrigated field more accurately.”
§ Enabling country-scale land cover mapping with meter-resolution satellite imagery > Experiments > Benchmark on Five-Billion-Pixels
plaincorrelationalSingle case- Asserted: passes — The authors put it forward as true.
- Checkable: passes — It can be checked against evidence.
- Load-bearing: unclear — It is unclear whether the paper’s conclusions depend on it.
- Based: passes — The paper gives a reason why it holds.
It may state two separate claims as one.
A result the paper reports from its own data — it cites no other source for it, so there is none to check. The quote shows it is in the paper.
In the paper
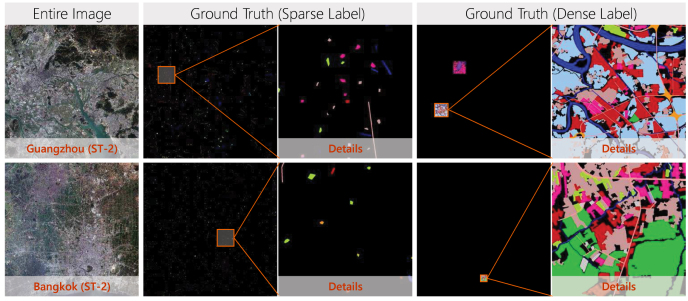
“In total, the five Chinese megacities are sparsely labeled with 5.21×10⁷ pixels and densely labeled with 7.77×10⁶ pixels, and the percentage of each category in test areas is displayed in Table 2.”
§ Enabling country-scale land cover mapping with meter-resolution satellite imagery > Study data > Study areas and data sources
plain- Asserted: passes — The authors put it forward as true.
- Checkable: passes — It can be checked against evidence.
- Load-bearing: fails — The paper’s conclusions may not depend on it.
- Based: passes — The paper gives a reason why it holds.
Probably not a substantial claim. The paper’s conclusions may not depend on it. It may state two separate claims as one.
The paper states this without a source or data behind it here, so there is nothing to check it against. The quote shows it is in the paper.
In the paper
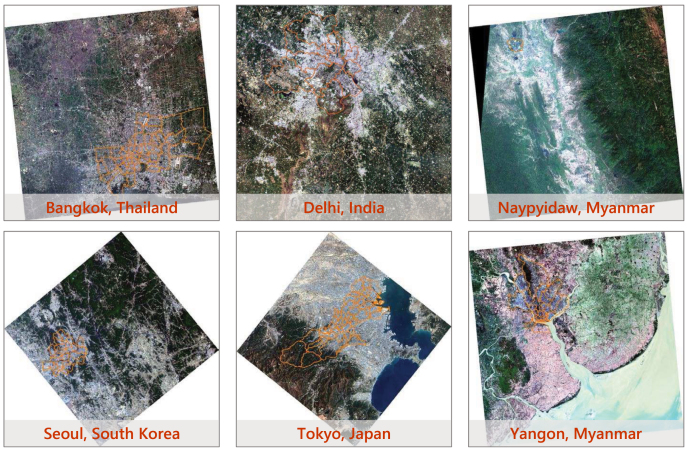
“And the other six Asian cities are located in South, Southeast, and East Asia, respectively.”
§ Enabling country-scale land cover mapping with meter-resolution satellite imagery > Study data
plain- Asserted: passes — The authors put it forward as true.
- Checkable: passes — It can be checked against evidence.
- Load-bearing: fails — The paper’s conclusions may not depend on it.
- Based: passes — The paper gives a reason why it holds.
Probably not a substantial claim. The paper’s conclusions may not depend on it. It may state two separate claims as one.
The paper states this without a source or data behind it here, so there is nothing to check it against. The quote shows it is in the paper.
In the paper
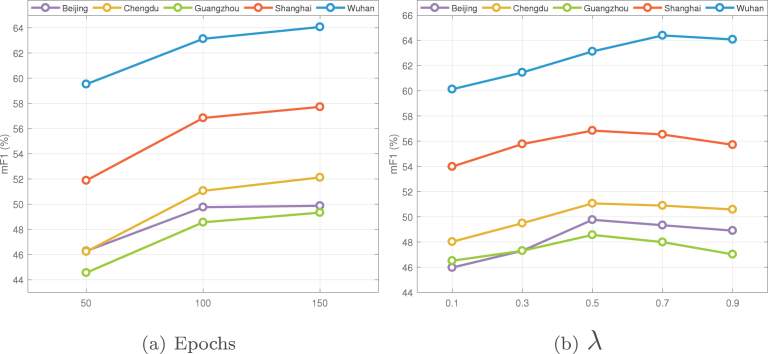
“The highest accuracy of Wuhan is reached when λ value is 0.7, while in other cities it is 0.5.”
§ Enabling country-scale land cover mapping with meter-resolution satellite imagery > Experiments > Land cover mapping
plaindirect- Asserted: passes — The authors put it forward as true.
- Checkable: passes — It can be checked against evidence.
- Load-bearing: unclear — It is unclear whether the paper’s conclusions depend on it.
- Based: passes — The paper gives a reason why it holds.
It may state two separate claims as one.
The paper states this without a source or data behind it here, so there is nothing to check it against. The quote shows it is in the paper.
In the paper
“U-Net behaves best on industrial area, urban residential, rural residential, different agriculture, and different forest classes.”
§ Enabling country-scale land cover mapping with meter-resolution satellite imagery > Experiments > Benchmark on Five-Billion-Pixels
plaincorrelational- Asserted: passes — The authors put it forward as true.
- Checkable: passes — It can be checked against evidence.
- Load-bearing: unclear — It is unclear whether the paper’s conclusions depend on it.
- Based: passes — The paper gives a reason why it holds.
It may state two separate claims as one.
The paper states this without a source or data behind it here, so there is nothing to check it against. The quote shows it is in the paper.
In the paper
“Another issue worth noting is that regardless of the method type, there are high performance discrepancies of different categories. For instance, all methods behave poorly on square, overpass, railway station, airport, garden land, park, and pond.”
§ Enabling country-scale land cover mapping with meter-resolution satellite imagery > Experiments > Benchmark on Five-Billion-Pixels
plain- Asserted: passes — The authors put it forward as true.
- Checkable: passes — It can be checked against evidence.
- Load-bearing: unclear — It is unclear whether the paper’s conclusions depend on it.
- Based: passes — The paper gives a reason why it holds.
It may state two separate claims as one.
A result the paper reports from its own data — it cites no other source for it, so there is none to check. The quote shows it is in the paper.
In the paper
“GoogLeNet and ResNet101 fail in extracting road and misclassify paddy field into fish pond.”
§ Enabling country-scale land cover mapping with meter-resolution satellite imagery > Experiments > Benchmark on Five-Billion-Pixels
plaindirect- Asserted: passes — The authors put it forward as true.
- Checkable: passes — It can be checked against evidence.
- Load-bearing: unclear — It is unclear whether the paper’s conclusions depend on it.
- Based: passes — The paper gives a reason why it holds.
It may state two separate claims as one.
The paper states this without a source or data behind it here, so there is nothing to check it against. The quote shows it is in the paper.
In the paper
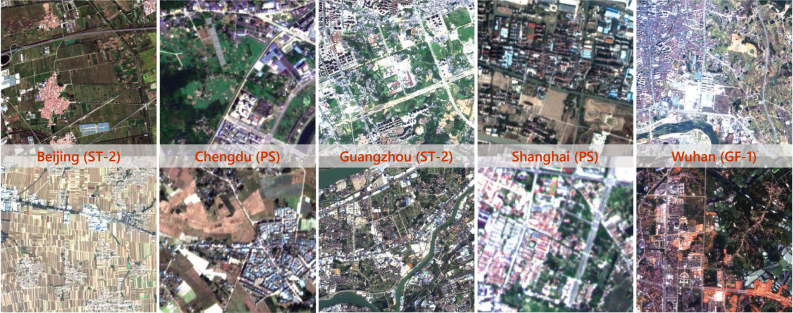
“As a result, not only are there significant differences between data sources, but there are also distribution shifts between images within each city, as displayed in Fig. 4.”
§ Enabling country-scale land cover mapping with meter-resolution satellite imagery > Study data > Study areas and data sources
plaincorrelational- Asserted: passes — The authors put it forward as true.
- Checkable: passes — It can be checked against evidence.
- Load-bearing: passes — The paper’s conclusions depend on it.
- Based: passes — The paper gives a reason why it holds.
It may state two separate claims as one.
The paper states this without a source or data behind it here, so there is nothing to check it against. The quote shows it is in the paper.
In the paper
“As Five-Billion-Pixels are mainly collected from human activity areas (cities, villages, cultivated lands, and mountainous areas around cities), the category system covers all land categories except mangroves, tundra and permanent ice.”
§ Enabling country-scale land cover mapping with meter-resolution satellite imagery > Study data > Five-Billion-Pixels
plaindirect- Asserted: passes — The authors put it forward as true.
- Checkable: passes — It can be checked against evidence.
- Load-bearing: unclear — It is unclear whether the paper’s conclusions depend on it.
- Based: passes — The paper gives a reason why it holds.
It may state two separate claims as one.
A result the paper reports from its own data — it cites no other source for it, so there is none to check. The quote shows it is in the paper.
In the paper
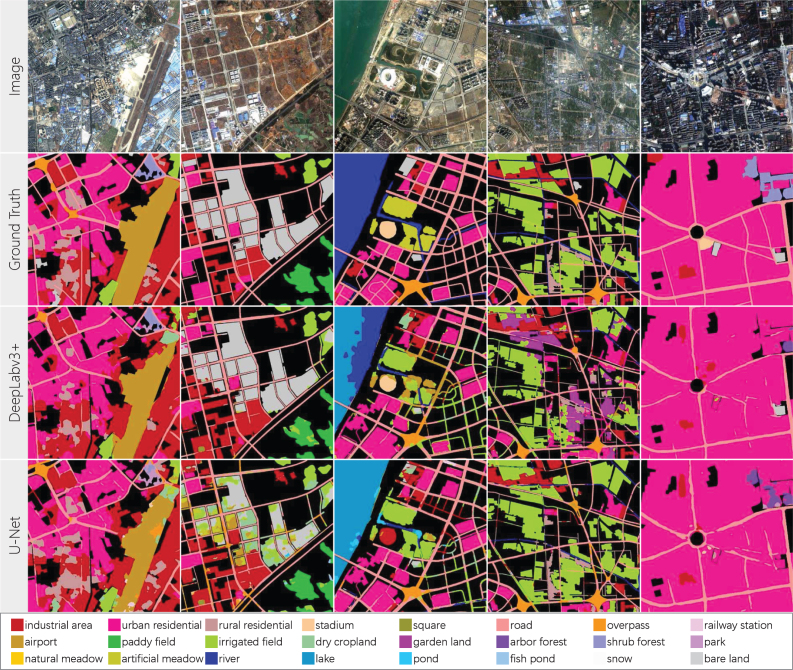
“In columns 1 to 3, DeepLabv3+ can segment more complete and smooth airport, bare land, and stadium, respectively. And the results of U-Net contain a lot of noise.”
§ Enabling country-scale land cover mapping with meter-resolution satellite imagery > Discussion > What information is important for land cover classification?
plaincorrelational- Asserted: passes — The authors put it forward as true.
- Checkable: passes — It can be checked against evidence.
- Load-bearing: unclear — It is unclear whether the paper’s conclusions depend on it.
- Based: passes — The paper gives a reason why it holds.
It may state two separate claims as one.
A result the paper reports from its own data — it cites no other source for it, so there is none to check. The quote shows it is in the paper.
In the paper
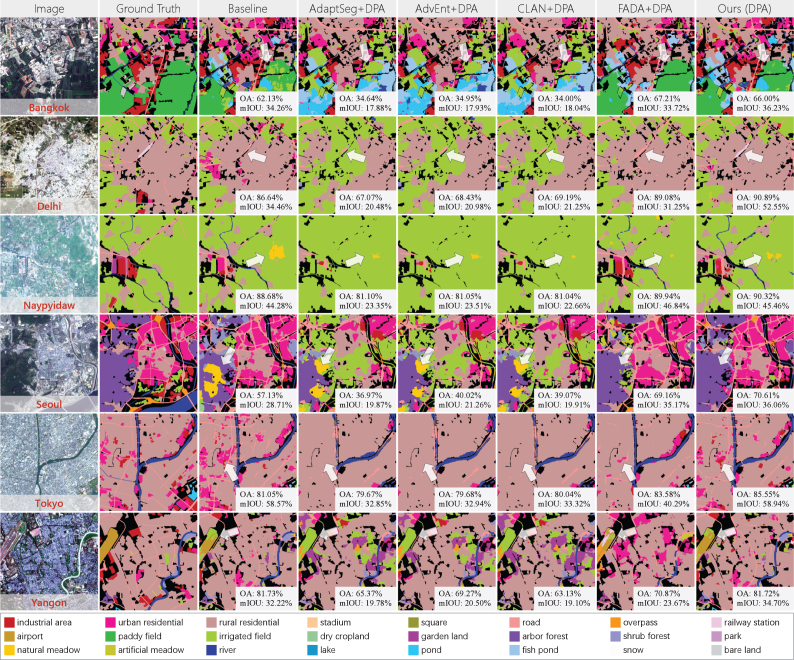
“our approach improves the results of paddy field in Bangkok, railway station in Delhi, irrigated field in Naypyidaw, arbor forest in Seoul, industrial area in Tokyo, and airport in Yangon.”
§ Enabling country-scale land cover mapping with meter-resolution satellite imagery > Experiments > Land cover mapping
plaindirect- Asserted: passes — The authors put it forward as true.
- Checkable: passes — It can be checked against evidence.
- Load-bearing: unclear — It is unclear whether the paper’s conclusions depend on it.
- Based: passes — The paper gives a reason why it holds.
It may state two separate claims as one.
A result the paper reports from its own data — it cites no other source for it, so there is none to check. The quote shows it is in the paper.
In the paper
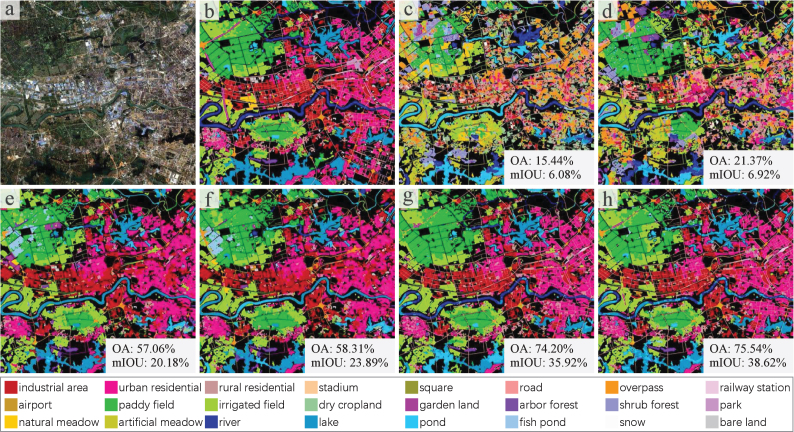
“MLP+Fusion can identify some water areas, RF+Fusion can identify some water, built-up, and paddy field areas, but the rest of the map is heavily confused.”
§ Enabling country-scale land cover mapping with meter-resolution satellite imagery > Experiments > Benchmark on Five-Billion-Pixels
plain- Asserted: passes — The authors put it forward as true.
- Checkable: passes — It can be checked against evidence.
- Load-bearing: unclear — It is unclear whether the paper’s conclusions depend on it.
- Based: passes — The paper gives a reason why it holds.
It may state two separate claims as one.
The paper states this without a source or data behind it here, so there is nothing to check it against. The quote shows it is in the paper.
In the paper
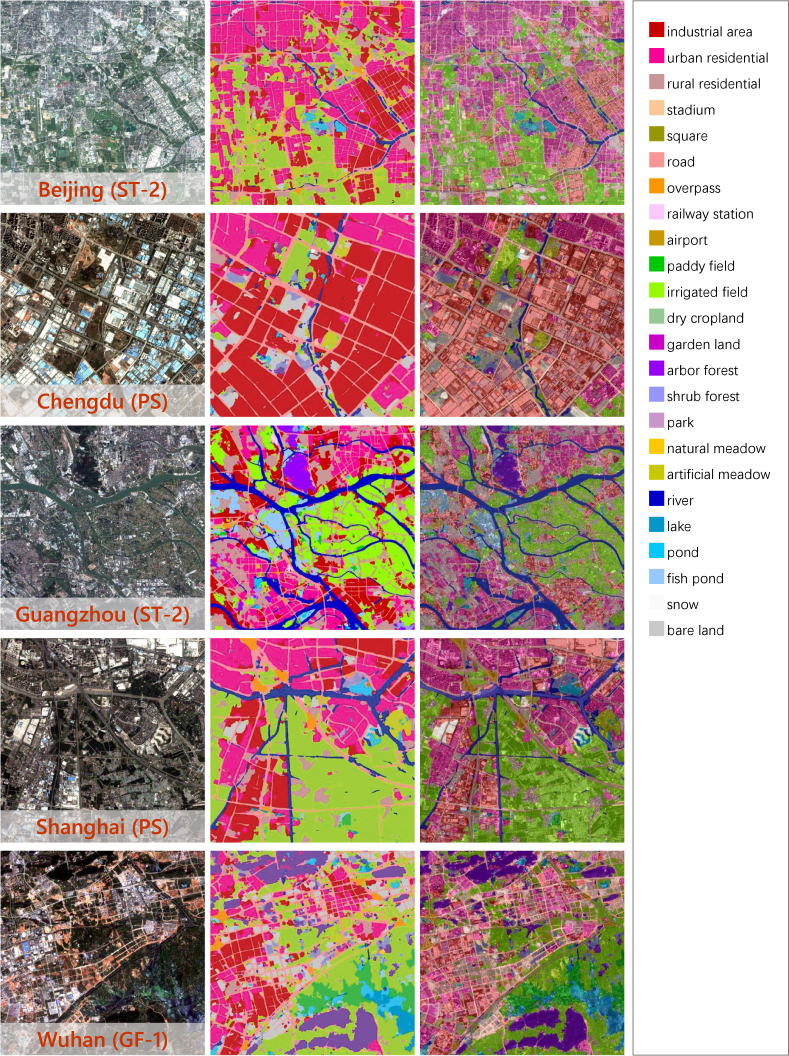
“Although images from different sensors are utilized, and there is no annotated information on them, our approach is able to distinguish industrial area, urban residential in city center, rural residential dispersed in suburb, transportation networks, and river systems for each city.”
§ Enabling country-scale land cover mapping with meter-resolution satellite imagery > Experiments > Land cover mapping
plaindirect- Asserted: passes — The authors put it forward as true.
- Checkable: passes — It can be checked against evidence.
- Load-bearing: passes — The paper’s conclusions depend on it.
- Based: passes — The paper gives a reason why it holds.
It may state two separate claims as one.
A result the paper reports from its own data — it cites no other source for it, so there is none to check. The quote shows it is in the paper.
In the paper
“In contrast, DeepLabv3+ and U-Net can segment clear road networks and different built-up areas.”
§ Enabling country-scale land cover mapping with meter-resolution satellite imagery > Experiments > Benchmark on Five-Billion-Pixels
boosteddirect- Asserted: passes — The authors put it forward as true.
- Checkable: passes — It can be checked against evidence.
- Load-bearing: unclear — It is unclear whether the paper’s conclusions depend on it.
- Based: passes — The paper gives a reason why it holds.
It may state two separate claims as one.
A result the paper reports from its own data — it cites no other source for it, so there is none to check. The quote shows it is in the paper.
In the paper
“Notably, the category system contains a number of land use classes subdivided from land cover classes in GB/T 21010-2017, including: stadium and square from public service land; road, overpass, railway station, and airport from transportation land; park and artificial meadow from artificial non-agricultural vegetated areas.”
§ Enabling country-scale land cover mapping with meter-resolution satellite imagery > Study data > Five-Billion-Pixels
plain- Asserted: passes — The authors put it forward as true.
- Checkable: passes — It can be checked against evidence.
- Load-bearing: fails — The paper’s conclusions may not depend on it.
- Based: passes — The paper gives a reason why it holds.
Probably not a substantial claim. The paper’s conclusions may not depend on it.
A result the paper reports from its own data — it cites no other source for it, so there is none to check. The quote shows it is in the paper.
In the paper
“The additional Asian cities are sparsely labeled with a total of 2.40×10⁶ pixels and densely labeled with a total of 1.29×10⁶ pixels, and the percentage of each category in test areas is listed in Table 3.”
§ Enabling country-scale land cover mapping with meter-resolution satellite imagery > Study data > Study areas and data sources
plain- Asserted: passes — The authors put it forward as true.
- Checkable: passes — It can be checked against evidence.
- Load-bearing: fails — The paper’s conclusions may not depend on it.
- Based: passes — The paper gives a reason why it holds.
Probably not a substantial claim. The paper’s conclusions may not depend on it. It may state two separate claims as one.
The paper states this without a source or data behind it here, so there is nothing to check it against. The quote shows it is in the paper.
In the paper
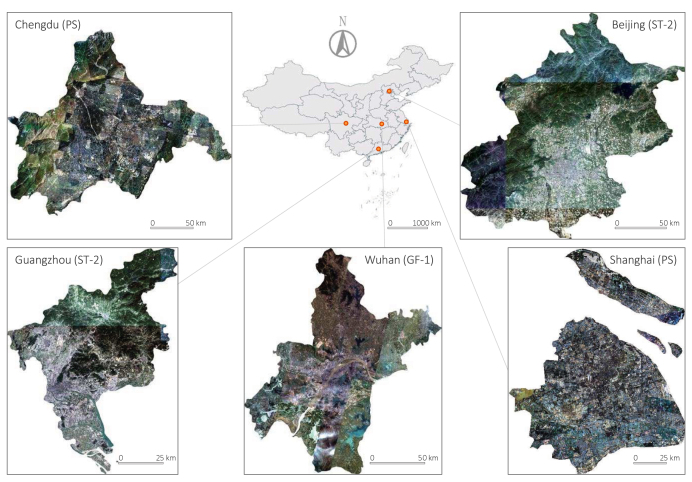
“The Chinese megacities cover a total geographical area of 53,088 km2 and are separately located in the eastern, western, northern, southern, and central regions of China.”
§ Enabling country-scale land cover mapping with meter-resolution satellite imagery > Study data
plain- Asserted: passes — The authors put it forward as true.
- Checkable: passes — It can be checked against evidence.
- Load-bearing: fails — The paper’s conclusions may not depend on it.
- Based: passes — The paper gives a reason why it holds.
Probably not a substantial claim. The paper’s conclusions may not depend on it.
The paper states this without a source or data behind it here, so there is nothing to check it against. The quote shows it is in the paper.
In the paper
“in Delhi, Naypyidaw, and Seoul, the comparison methods classify built-up areas into irrigated field, and in Tokyo, high-rise residential and industrial area are misclassified as low-rise residential.”
§ Enabling country-scale land cover mapping with meter-resolution satellite imagery > Experiments > Land cover mapping
plaindirect- Asserted: passes — The authors put it forward as true.
- Checkable: passes — It can be checked against evidence.
- Load-bearing: unclear — It is unclear whether the paper’s conclusions depend on it.
- Based: passes — The paper gives a reason why it holds.
It may state two separate claims as one.
The paper states this without a source or data behind it here, so there is nothing to check it against. The quote shows it is in the paper.
In the paper
“DeepLabv3+ tends to identify ground objects as independent “instances”, whereas it seems difficult for U-Net to aggregate land information into homogeneous segmented regions.”
§ Enabling country-scale land cover mapping with meter-resolution satellite imagery > Discussion > What information is important for land cover classification?
hedgedcorrelational- Asserted: passes — The authors put it forward as true.
- Checkable: passes — It can be checked against evidence.
- Load-bearing: unclear — It is unclear whether the paper’s conclusions depend on it.
- Based: passes — The paper gives a reason why it holds.
It may state two separate claims as one.
The paper states this without a source or data behind it here, so there is nothing to check it against. The quote shows it is in the paper.
In the paper
“The Chinese megacities cover a total geographical area of 53,088 km2 and are separately located in the eastern, western, northern, southern, and central regions of China.”
§ Enabling country-scale land cover mapping with meter-resolution satellite imagery > Study data
plain- Asserted: passes — The authors put it forward as true.
- Checkable: passes — It can be checked against evidence.
- Load-bearing: fails — The paper’s conclusions may not depend on it.
- Based: passes — The paper gives a reason why it holds.
Probably not a substantial claim. The paper’s conclusions may not depend on it.
The paper states this without a source or data behind it here, so there is nothing to check it against. The quote shows it is in the paper.
In the paper
“It can be seen that the results on dense label are generally better than that on sparse label in OA, while sparse label outperforms dense label in mF1 and mIOU.”
§ Enabling country-scale land cover mapping with meter-resolution satellite imagery > Experiments > Land cover mapping
plaincorrelational- Asserted: passes — The authors put it forward as true.
- Checkable: passes — It can be checked against evidence.
- Load-bearing: unclear — It is unclear whether the paper’s conclusions depend on it.
- Based: passes — The paper gives a reason why it holds.
It may state two separate claims as one.
The paper states this without a source or data behind it here, so there is nothing to check it against. The quote shows it is in the paper.
In the paper
“Obvious errors occur in the forested mountains and at the mosaic borders. Small areas of mountains around Beijing are misclassified as water bodies, and some areas of mountains around Chengdu are misclassified as irrigated field.”
§ Enabling country-scale land cover mapping with meter-resolution satellite imagery > Experiments > Land cover mapping
plain- Asserted: passes — The authors put it forward as true.
- Checkable: passes — It can be checked against evidence.
- Load-bearing: unclear — It is unclear whether the paper’s conclusions depend on it.
- Based: passes — The paper gives a reason why it holds.
It may state two separate claims as one.
A result the paper reports from its own data — it cites no other source for it, so there is none to check. The quote shows it is in the paper.
In the paper
“U-Net shows superior performance in columns 4 to 5, where it correctly classifies irrigated field, which are partially misclassified by DeepLabv3+ as garden land and road, which cannot be clearly extracted by DeepLabv3+ from dense built-up areas.”
§ Enabling country-scale land cover mapping with meter-resolution satellite imagery > Discussion > What information is important for land cover classification?
plaindirect- Asserted: passes — The authors put it forward as true.
- Checkable: passes — It can be checked against evidence.
- Load-bearing: unclear — It is unclear whether the paper’s conclusions depend on it.
- Based: passes — The paper gives a reason why it holds.
It may state two separate claims as one.
The paper states this without a source or data behind it here, so there is nothing to check it against. The quote shows it is in the paper.
In the paper
“new high-rise residential buildings are mixed with old ones, which have the same appearance as rural settlements, creating a special urban landscape.”
§ Enabling country-scale land cover mapping with meter-resolution satellite imagery > Discussion > What can be further done based on our dataset and approach?
plaindirect- Asserted: passes — The authors put it forward as true.
- Checkable: passes — It can be checked against evidence.
- Load-bearing: fails — The paper’s conclusions may not depend on it.
- Based: passes — The paper gives a reason why it holds.
Probably not a substantial claim. The paper’s conclusions may not depend on it. It may state two separate claims as one.
The paper states this without a source or data behind it here, so there is nothing to check it against. The quote shows it is in the paper.
In the paper
“the Five-Billion-Pixels dataset covers a large amount of irrigated field reclaimed in the mountains of northwestern China, and their spectral and texture features may be similar to those of mountainous arbor forest in winter.”
§ Enabling country-scale land cover mapping with meter-resolution satellite imagery > Discussion > How can the performance of land cover mapping be further improved?
hedgedconditional- Asserted: passes — The authors put it forward as true.
- Checkable: passes — It can be checked against evidence.
- Load-bearing: fails — The paper’s conclusions may not depend on it.
- Based: passes — The paper gives a reason why it holds.
Probably not a substantial claim. The paper’s conclusions may not depend on it. It may state two separate claims as one.
A conclusion the paper draws from its own results — it cites no other source for it, so there is none to check. The quote shows it is in the paper.
In the paper
“This category system covers artificial-constructed, agricultural, and natural classes, more closely resembling the distributions of ground objects in the real world.”
§ Enabling country-scale land cover mapping with meter-resolution satellite imagery > Study data > Five-Billion-Pixels
plaincorrelational- Asserted: passes — The authors put it forward as true.
- Checkable: passes — It can be checked against evidence.
- Load-bearing: fails — The paper’s conclusions may not depend on it.
- Based: passes — The paper gives a reason why it holds.
Probably not a substantial claim. The paper’s conclusions may not depend on it. It may state two separate claims as one.
What the paper did — it cites no source for this, so there is none to check. The quote shows it is in the paper.
In the paper
“The labeled areas are double-checked and ensured to be correct.”
§ Enabling country-scale land cover mapping with meter-resolution satellite imagery > Study data > Five-Billion-Pixels
plain- Asserted: passes — The authors put it forward as true.
- Checkable: passes — It can be checked against evidence.
- Load-bearing: fails — The paper’s conclusions may not depend on it.
- Based: passes — The paper gives a reason why it holds.
Probably not a substantial claim. The paper’s conclusions may not depend on it.
The paper states this without a source or data behind it here, so there is nothing to check it against. The quote shows it is in the paper.
In the paper
“Furthermore, the model always tends to select more easy samples, which may exacerbate the category imbalance.”
§ Enabling country-scale land cover mapping with meter-resolution satellite imagery > Introduction > Related work
hedgedconditional- Asserted: passes — The authors put it forward as true.
- Checkable: passes — It can be checked against evidence.
- Load-bearing: passes — The paper’s conclusions depend on it.
- Based: fails — The paper may give no reason why it holds.
Probably not a substantial claim. The paper may give no reason why it holds. It may state two separate claims as one.
The paper states this without a source or data behind it here, so there is nothing to check it against. The quote shows it is in the paper.
In the paper
“However, dense annotation for each newly captured image is not realistic.”
§ Enabling country-scale land cover mapping with meter-resolution satellite imagery > Introduction > Related work
plain- Asserted: passes — The authors put it forward as true.
- Checkable: fails — It may be too vague to check against evidence.
- Load-bearing: passes — The paper’s conclusions depend on it.
- Based: fails — The paper may give no reason why it holds.
Probably not a substantial claim. It may be too vague to check against evidence. The paper may give no reason why it holds.
In the paper
“Deep Convolutional Neural Networks (DCNNs) are able to adaptively approximate the relationship between image information and land information through multi-layer transformations (Zhu et al., 2017).”
§ Enabling country-scale land cover mapping with meter-resolution satellite imagery > Introduction > Related work
What the sources say
- Not checked — no full text of the sourcecites Zhu et al., 2017 source
plaindirect- Asserted: passes — The authors put it forward as true.
- Checkable: passes — It can be checked against evidence.
- Load-bearing: passes — The paper’s conclusions depend on it.
- Based: passes — The paper gives a reason why it holds.
Probably not a substantial claim.
In the paper
“But at the same time, the detailed information brings about much more complicated land structures and patterns (Yuan et al., 2020), which leads to great challenges in land cover classification with high-resolution images.”
§ Enabling country-scale land cover mapping with meter-resolution satellite imagery > Introduction > Motivation
What the sources say
- Not checked — no full text of the sourcecites Yuan et al., 2020 source
plaindirect- Asserted: passes — The authors put it forward as true.
- Checkable: passes — It can be checked against evidence.
- Load-bearing: passes — The paper’s conclusions depend on it.
- Based: passes — The paper gives a reason why it holds.
It may state two separate claims as one.
The paper states this without a source or data behind it here, so there is nothing to check it against. The quote shows it is in the paper.
In the paper
“few studies have applied high-resolution images to land cover mapping in detailed categories at large scale.”
§ Enabling country-scale land cover mapping with meter-resolution satellite imagery > Abstract
plain- Asserted: passes — The authors put it forward as true.
- Checkable: passes — It can be checked against evidence.
- Load-bearing: passes — The paper’s conclusions depend on it.
- Based: fails — The paper may give no reason why it holds.
Probably not a substantial claim. The paper may give no reason why it holds.
The paper states this without a source or data behind it here, so there is nothing to check it against. The quote shows it is in the paper.
In the paper
“However, the quality of pseudo-labels depends on the way they are selected.”
§ Enabling country-scale land cover mapping with meter-resolution satellite imagery > Introduction > Related work
plaindirect- Asserted: passes — The authors put it forward as true.
- Checkable: passes — It can be checked against evidence.
- Load-bearing: passes — The paper’s conclusions depend on it.
- Based: passes — The paper gives a reason why it holds.
Probably not a substantial claim.
A conclusion the paper draws from its own results — it cites no other source for it, so there is none to check. The quote shows it is in the paper.
In the paper
“Its category system covers artificial-constructed, agricultural, and natural classes, which well-reflects the distribution of real-world ground objects and can widely benefit land-cover-related studies.”
§ Enabling country-scale land cover mapping with meter-resolution satellite imagery > Introduction > Contribution of this paper
boostedcorrelational- Asserted: passes — The authors put it forward as true.
- Checkable: passes — It can be checked against evidence.
- Load-bearing: passes — The paper’s conclusions depend on it.
- Based: fails — The paper may give no reason why it holds.
Probably not a substantial claim. The paper may give no reason why it holds. It may state two separate claims as one.
A conclusion the paper draws from its own results — it cites no other source for it, so there is none to check. The quote shows it is in the paper.
In the paper
“In addition, the distinctive characteristic of these categories is that they are composed of multiple basic ground cover types; for example, railway station contains multiple tracks and stadium-like building roof, park includes grass and woods, and airport contains roads and lawns, which causes them to be easily misclassified into other categories.”
§ Enabling country-scale land cover mapping with meter-resolution satellite imagery > Experiments > Benchmark on Five-Billion-Pixels
plaindirect- Asserted: passes — The authors put it forward as true.
- Checkable: passes — It can be checked against evidence.
- Load-bearing: unclear — It is unclear whether the paper’s conclusions depend on it.
- Based: passes — The paper gives a reason why it holds.
It may state two separate claims as one.
A conclusion the paper draws from its own results — it cites no other source for it, so there is none to check. The quote shows it is in the paper.
In the paper
“The performance advantages of deep learning, especially of semantic segmentation models, demonstrate the importance of large-scale, pixel-wise annotated datasets for advancing land cover classification research.”
§ Enabling country-scale land cover mapping with meter-resolution satellite imagery > Experiments > Benchmark on Five-Billion-Pixels
boosteddirect- Asserted: passes — The authors put it forward as true.
- Checkable: passes — It can be checked against evidence.
- Load-bearing: fails — The paper’s conclusions may not depend on it.
- Based: passes — The paper gives a reason why it holds.
Probably not a substantial claim. The paper’s conclusions may not depend on it.
The paper states this without a source or data behind it here, so there is nothing to check it against. The quote shows it is in the paper.
In the paper
“Since object-oriented approaches and semantic segmentation approaches have different requirements for training data, i.e., object-oriented approaches only allow each input sample to have one label, while semantic segmentation approaches require a label for each pixel of input sample, we prepare different training data for them.”
§ Enabling country-scale land cover mapping with meter-resolution satellite imagery > Experiments > Experimental setup
plaincorrelational- Asserted: passes — The authors put it forward as true.
- Checkable: passes — It can be checked against evidence.
- Load-bearing: passes — The paper’s conclusions depend on it.
- Based: passes — The paper gives a reason why it holds.
Probably not a substantial claim. It may state two separate claims as one.
A conclusion the paper draws from its own results — it cites no other source for it, so there is none to check. The quote shows it is in the paper.
In the paper
“when λ is set to 0.9, 90% pixels in the target domain are involved in the last training epoch, too many errors in pseudo-labels, thus, lead to an obvious decrease in the accuracy of each city.”
§ Enabling country-scale land cover mapping with meter-resolution satellite imagery > Experiments > Land cover mapping
plaindirect- Asserted: passes — The authors put it forward as true.
- Checkable: passes — It can be checked against evidence.
- Load-bearing: unclear — It is unclear whether the paper’s conclusions depend on it.
- Based: passes — The paper gives a reason why it holds.
It may state two separate claims as one.
A conclusion the paper draws from its own results — it cites no other source for it, so there is none to check. The quote shows it is in the paper.
In the paper
“This is due to the feature distribution differences caused by the diverse architectural styles and city landscapes in different countries.”
§ Enabling country-scale land cover mapping with meter-resolution satellite imagery > Experiments > Land cover mapping
plaindirect- Asserted: passes — The authors put it forward as true.
- Checkable: passes — It can be checked against evidence.
- Load-bearing: fails — The paper’s conclusions may not depend on it.
- Based: passes — The paper gives a reason why it holds.
Probably not a substantial claim. The paper’s conclusions may not depend on it.
In the paper
“The latest semantic segmentation models typically consist of two main paths: the encoder path that gradually reduces feature map size and captures higher-level information, and the decoder path that gradually recovers spatial resolution as well as clear object boundaries (Chen et al., 2018).”
§ Enabling country-scale land cover mapping with meter-resolution satellite imagery > Methodology > Semantic segmentation model for land cover classification
What the sources say
- Not matchedcites Chen et al., 2018
Couldn’t be matched to a paper in Crossref, so it can’t be checked.
plain- Asserted: passes — The authors put it forward as true.
- Checkable: passes — It can be checked against evidence.
- Load-bearing: fails — The paper’s conclusions may not depend on it.
- Based: passes — The paper gives a reason why it holds.
Probably not a substantial claim. The paper’s conclusions may not depend on it.
- Not matched
In the paper
“Owing to the residual connection structure (He et al., 2016) that enables the combination of different levels of features, ResNet101 can learn low-level features to distinguish natural classes as well as high-level features to identify artificial buildings with complex structures.”
§ Enabling country-scale land cover mapping with meter-resolution satellite imagery > Experiments > Benchmark on Five-Billion-Pixels
What the sources say
- Not matchedcites He et al., 2016
Couldn’t be matched to a paper in Crossref, so it can’t be checked.
plaindirect- Asserted: passes — The authors put it forward as true.
- Checkable: passes — It can be checked against evidence.
- Load-bearing: unclear — It is unclear whether the paper’s conclusions depend on it.
- Based: passes — The paper gives a reason why it holds.
It may state two separate claims as one.
- Not matched
A conclusion the paper draws from its own results — it cites no other source for it, so there is none to check. The quote shows it is in the paper.
In the paper
“Compared to discrepancy-based and adversarial-based UDA methods, which force the two distributions to be aligned in feature space, pseudo-labeling is more flexible and potentially more dependable for complicated real-world situations.”
§ Enabling country-scale land cover mapping with meter-resolution satellite imagery > Methodology > Domain joint learning for unsupervised domain adaptation
hedgedcorrelational- Asserted: passes — The authors put it forward as true.
- Checkable: fails — It may be too vague to check against evidence.
- Load-bearing: passes — The paper’s conclusions depend on it.
- Based: fails — The paper may give no reason why it holds.
Probably not a substantial claim. It may be too vague to check against evidence. The paper may give no reason why it holds.
A conclusion the paper draws from its own results — it cites no other source for it, so there is none to check. The quote shows it is in the paper.
In the paper
“This is because semantic segmentation models can capture contextual information over larger areas and simultaneously maintain more accurate edges for ground objects by assigning labels to each pixel.”
§ Enabling country-scale land cover mapping with meter-resolution satellite imagery > Experiments > Benchmark on Five-Billion-Pixels
plaindirect- Asserted: passes — The authors put it forward as true.
- Checkable: passes — It can be checked against evidence.
- Load-bearing: passes — The paper’s conclusions depend on it.
- Based: passes — The paper gives a reason why it holds.
It may state two separate claims as one.
A conclusion the paper draws from its own results — it cites no other source for it, so there is none to check. The quote shows it is in the paper.
In the paper
“If there are errors in pseudo-labels, a small number of mistakes may eventually lead to a relatively large bias during the iterative training.”
§ Enabling country-scale land cover mapping with meter-resolution satellite imagery > Methodology > Domain joint learning for unsupervised domain adaptation
hedgedconditional- Asserted: passes — The authors put it forward as true.
- Checkable: passes — It can be checked against evidence.
- Load-bearing: passes — The paper’s conclusions depend on it.
- Based: fails — The paper may give no reason why it holds.
Probably not a substantial claim. The paper may give no reason why it holds.
None of the sources cited for this claim could be matched to a paper in Crossref, so there is nothing to check it against.
In the paper
“Due to the atrous convolution (Chen et al., 2017b) and spatial pyramid pooling (Chen et al., 2018) adopted in DeepLabv3+, it can capture multi-level contextual information for these categories.”
§ Enabling country-scale land cover mapping with meter-resolution satellite imagery > Experiments > Benchmark on Five-Billion-Pixels
What the sources say
- Not matchedcites Chen et al., 2017b
Couldn’t be matched to a paper in Crossref, so it can’t be checked.
- Not matchedcites Chen et al., 2018
Couldn’t be matched to a paper in Crossref, so it can’t be checked.
plaindirect- Asserted: passes — The authors put it forward as true.
- Checkable: passes — It can be checked against evidence.
- Load-bearing: passes — The paper’s conclusions depend on it.
- Based: passes — The paper gives a reason why it holds.
It may state two separate claims as one.
- Not matched
A conclusion the paper draws from its own results — it cites no other source for it, so there is none to check. The quote shows it is in the paper.
In the paper
“we propose a UDA approach that can softly correct the domain shifts by adaptively learning the distribution of unlabeled data.”
§ Enabling country-scale land cover mapping with meter-resolution satellite imagery > Methodology
plaindirect- Asserted: passes — The authors put it forward as true.
- Checkable: passes — It can be checked against evidence.
- Load-bearing: passes — The paper’s conclusions depend on it.
- Based: fails — The paper may give no reason why it holds.
Probably not a substantial claim. The paper may give no reason why it holds.
A conclusion the paper draws from its own results — it cites no other source for it, so there is none to check. The quote shows it is in the paper.
In the paper
“To avoid introducing incorrect category information in the training, only a very small number of pseudo-labels are used in the initial iterations of domain joint learning, which leads to two problems: (1) DT can only provide very few training samples at the beginning; (2) the samples selected from DT may be extremely homogeneous.”
§ Enabling country-scale land cover mapping with meter-resolution satellite imagery > Methodology > Domain joint learning for unsupervised domain adaptation
plaindirect- Asserted: passes — The authors put it forward as true.
- Checkable: passes — It can be checked against evidence.
- Load-bearing: passes — The paper’s conclusions depend on it.
- Based: passes — The paper gives a reason why it holds.
It may state two separate claims as one.
What the paper did — it cites no source for this, so there is none to check. The quote shows it is in the paper.
In the paper
“Note that these annotations are only used for accuracy assessment and not for model training.”
§ Enabling country-scale land cover mapping with meter-resolution satellite imagery > Study data > Study areas and data sources
plain- Asserted: passes — The authors put it forward as true.
- Checkable: passes — It can be checked against evidence.
- Load-bearing: fails — The paper’s conclusions may not depend on it.
- Based: passes — The paper gives a reason why it holds.
Probably not a substantial claim. The paper’s conclusions may not depend on it. It may state two separate claims as one.
A conclusion the paper draws from its own results — it cites no other source for it, so there is none to check. The quote shows it is in the paper.
In the paper
“This is because in this scenario, the feature distributions of the source and target domains are more disparate, it is harder for the adversarial-based approaches to find a suitable match between the two distributions, and more intra-domain variance is introduced into the model by the rigid alignment.”
§ Enabling country-scale land cover mapping with meter-resolution satellite imagery > Experiments > Land cover mapping
plaindirect- Asserted: passes — The authors put it forward as true.
- Checkable: passes — It can be checked against evidence.
- Load-bearing: passes — The paper’s conclusions depend on it.
- Based: passes — The paper gives a reason why it holds.
It may state two separate claims as one.
A conclusion the paper draws from its own results — it cites no other source for it, so there is none to check. The quote shows it is in the paper.
In the paper
“An intuitive interpretation of this design is that the network may give reliable predictions for only a small number of pixels when it is not adapted to DT, and as the network gradually learns the distribution of DT, it can make reliable predictions for an increasing number of pixels.”
§ Enabling country-scale land cover mapping with meter-resolution satellite imagery > Methodology > Domain joint learning for unsupervised domain adaptation
hedgedconditional- Asserted: passes — The authors put it forward as true.
- Checkable: passes — It can be checked against evidence.
- Load-bearing: passes — The paper’s conclusions depend on it.
- Based: passes — The paper gives a reason why it holds.
Probably not a substantial claim. It may state two separate claims as one.
The paper states this without a source or data behind it here, so there is nothing to check it against. The quote shows it is in the paper.
In the paper
“Unlike artificial-constructed categories, the classification of natural classes relies more on spectral information.”
§ Enabling country-scale land cover mapping with meter-resolution satellite imagery > Experiments > Land cover mapping
plaincorrelational- Asserted: passes — The authors put it forward as true.
- Checkable: passes — It can be checked against evidence.
- Load-bearing: fails — The paper’s conclusions may not depend on it.
- Based: passes — The paper gives a reason why it holds.
Probably not a substantial claim. The paper’s conclusions may not depend on it.
A conclusion the paper draws from its own results — it cites no other source for it, so there is none to check. The quote shows it is in the paper.
In the paper
“This may be because the sensors of GF-1 and GF-2 have more similar imaging processes, resulting in closer distributions of the source and target domains, and the quality of the pseudo-label can be guaranteed to some extent even if 70% pixels are selected at the end of training, whereas using more pseudo-labels in other cities would introduce more errors.”
§ Enabling country-scale land cover mapping with meter-resolution satellite imagery > Experiments > Land cover mapping
hedgedconditional- Asserted: passes — The authors put it forward as true.
- Checkable: passes — It can be checked against evidence.
- Load-bearing: fails — The paper’s conclusions may not depend on it.
- Based: passes — The paper gives a reason why it holds.
Probably not a substantial claim. The paper’s conclusions may not depend on it. It may state two separate claims as one.
- Rests on an assumption: GF-1 and GF-2 have more similar imaging processes, resulting in closer distributions of the source and target domains.
In the paper
“Shannon Entropy (Xu et al., 2020) is employed as our indicator to quantify the confidence of each image pixel. Lower information entropy represents higher classification confidence.”
§ Enabling country-scale land cover mapping with meter-resolution satellite imagery > Methodology > Domain joint learning for unsupervised domain adaptation
What the sources say
- Not matchedcites Xu et al., 2020
Couldn’t be matched to a paper in Crossref, so it can’t be checked.
plaincorrelational- Asserted: passes — The authors put it forward as true.
- Checkable: passes — It can be checked against evidence.
- Load-bearing: passes — The paper’s conclusions depend on it.
- Based: passes — The paper gives a reason why it holds.
It may state two separate claims as one.
- Not matched
A conclusion the paper draws from its own results — it cites no other source for it, so there is none to check. The quote shows it is in the paper.
In the paper
“This is due to two factors, first, these categories represent small percentages in the Five-Billion-Pixels dataset, and second, they are inherently easier to confuse with other categories.”
§ Enabling country-scale land cover mapping with meter-resolution satellite imagery > Experiments > Benchmark on Five-Billion-Pixels
plaindirect- Asserted: passes — The authors put it forward as true.
- Checkable: passes — It can be checked against evidence.
- Load-bearing: unclear — It is unclear whether the paper’s conclusions depend on it.
- Based: passes — The paper gives a reason why it holds.
It may state two separate claims as one.
A conclusion the paper draws from its own results — it cites no other source for it, so there is none to check. The quote shows it is in the paper.
In the paper
“When the spectral shifts are particularly significant, pseudo-labels inevitably contain errors, which will continuously accumulate in iterative domain adaptation learning.”
§ Enabling country-scale land cover mapping with meter-resolution satellite imagery > Experiments > Land cover mapping
boosteddirect- Asserted: passes — The authors put it forward as true.
- Checkable: passes — It can be checked against evidence.
- Load-bearing: passes — The paper’s conclusions depend on it.
- Based: passes — The paper gives a reason why it holds.
It may state two separate claims as one.
A conclusion the paper draws from its own results — it cites no other source for it, so there is none to check. The quote shows it is in the paper.
In the paper
“the DCNNs model is likely to assign irrigated field pseudo-labels to a small number of arbor forest samples in DT. And these errors will further accumulate in continuous iterative training, eventually leading to misclassification in the land cover mapping results.”
§ Enabling country-scale land cover mapping with meter-resolution satellite imagery > Discussion > How can the performance of land cover mapping be further improved?
hedgeddirect- Asserted: passes — The authors put it forward as true.
- Checkable: passes — It can be checked against evidence.
- Load-bearing: unclear — It is unclear whether the paper’s conclusions depend on it.
- Based: passes — The paper gives a reason why it holds.
It may state two separate claims as one.
- Rests on an assumption: Features of forest and cropland are largely influenced by geographical location and seasonal changes.
A conclusion the paper draws from its own results — it cites no other source for it, so there is none to check. The quote shows it is in the paper.
In the paper
“our approach is proven to be generalizable across images captured by different sensors, especially for ST-2 images that are free and open.”
§ Enabling country-scale land cover mapping with meter-resolution satellite imagery > Discussion > What can be further done based on our dataset and approach?
boosteddirect- Asserted: passes — The authors put it forward as true.
- Checkable: passes — It can be checked against evidence.
- Load-bearing: passes — The paper’s conclusions depend on it.
- Based: fails — The paper may give no reason why it holds.
Probably not a substantial claim. The paper may give no reason why it holds.
A conclusion the paper draws from its own results — it cites no other source for it, so there is none to check. The quote shows it is in the paper.
In the paper
“Since this problem is caused by the inherent constraints of UDA and the intrinsic properties of vegetation categories”
§ Enabling country-scale land cover mapping with meter-resolution satellite imagery > Discussion > How can the performance of land cover mapping be further improved?
plaindirect- Asserted: passes — The authors put it forward as true.
- Checkable: passes — It can be checked against evidence.
- Load-bearing: passes — The paper’s conclusions depend on it.
- Based: fails — The paper may give no reason why it holds.
Probably not a substantial claim. The paper may give no reason why it holds. It may state two separate claims as one.
A conclusion the paper draws from its own results — it cites no other source for it, so there is none to check. The quote shows it is in the paper.
In the paper
“owing to our extensive, fine, and accurate annotating for Five-Billion-Pixels, our results present clear transportation networks and river systems, as well as different agricultural and urban functional areas.”
§ Enabling country-scale land cover mapping with meter-resolution satellite imagery > Discussion > What can be further done based on our dataset and approach?
boosteddirect- Asserted: passes — The authors put it forward as true.
- Checkable: passes — It can be checked against evidence.
- Load-bearing: unclear — It is unclear whether the paper’s conclusions depend on it.
- Based: passes — The paper gives a reason why it holds.
It may state two separate claims as one.
A conclusion the paper draws from its own results — it cites no other source for it, so there is none to check. The quote shows it is in the paper.
In the paper
“Although we studied only 11 cities in this paper, our approach can be easily generalized to other cities, towns, and villages throughout China and even other Asian countries.”
§ Enabling country-scale land cover mapping with meter-resolution satellite imagery > Discussion > What can be further done based on our dataset and approach?
plain- Asserted: passes — The authors put it forward as true.
- Checkable: passes — It can be checked against evidence.
- Load-bearing: passes — The paper’s conclusions depend on it.
- Based: passes — The paper gives a reason why it holds.
It may state two separate claims as one.
A conclusion the paper draws from its own results — it cites no other source for it, so there is none to check. The quote shows it is in the paper.
In the paper
“for other countries and regions with very different land distributions and land category systems than China, it has potential to perform land cover mapping based on Five-Billion-Pixels and, for example, semi-supervised domain adaptation with sparse annotations in the form of patches or polygons.”
§ Enabling country-scale land cover mapping with meter-resolution satellite imagery > Discussion > What can be further done based on our dataset and approach?
hedgedconditional- Asserted: fails — The authors may not put it forward as true.
- Checkable: fails — It may be too vague to check against evidence.
- Load-bearing: fails — The paper’s conclusions may not depend on it.
- Based: passes — The paper gives a reason why it holds.
Probably not a substantial claim. The authors may not put it forward as true. It may be too vague to check against evidence. The paper’s conclusions may not depend on it.
What the paper did — it cites no source for this, so there is none to check. The quote shows it is in the paper.
In the paper
“Due to the different acquisition time of the original images, we can only make an approximate visual comparison.”
§ Enabling country-scale land cover mapping with meter-resolution satellite imagery > Discussion > What can be further done based on our dataset and approach?
plaindirect- Asserted: passes — The authors put it forward as true.
- Checkable: passes — It can be checked against evidence.
- Load-bearing: fails — The paper’s conclusions may not depend on it.
- Based: passes — The paper gives a reason why it holds.
Probably not a substantial claim. The paper’s conclusions may not depend on it. The quote only partly states this claim.
A conclusion the paper draws from its own results — it cites no other source for it, so there is none to check. The quote shows it is in the paper.
In the paper
“our work has the potential to be extended to land cover mapping at country-scale and to contribute to various applications involving land cover information.”
§ Enabling country-scale land cover mapping with meter-resolution satellite imagery > Conclusion
hedgedconditional- Asserted: passes — The authors put it forward as true.
- Checkable: fails — It may be too vague to check against evidence.
- Load-bearing: passes — The paper’s conclusions depend on it.
- Based: passes — The paper gives a reason why it holds.
Probably not a substantial claim. It may be too vague to check against evidence. It may state two separate claims as one.
The paper relies on this without support.
The 10% sample examined in the final spot checking is representative of the entire Five-Billion-Pixels dataset.
“In the final round of spot checking, 10% samples of Five-Billion-Pixels are examined and no obvious errors are observed.”
The paper relies on this without support.
The effective spatial resolution of PS is 3.7–4.1 m.
“Since the 3 m resolution of PS is obtained by resampling the raw data and its effective spatial resolution is 3.7−4.1 m, we use the original image resolution of GF-2 to adapt it.”
The paper relies on this without support.
The Five-Billion-Pixels dataset is representative of the target cities' land cover distributions.
“To adapt deep models to satellite images with different resolutions, we construct a multi-scale source domain using Five-Billion-Pixels.”
The paper relies on this without support.
Land cover mapping at large scale in high resolution remains a challenging task.
“Yet land cover mapping on a large-scale in high-resolution remains a challenging task.”
The paper relies on this without support.
Recognition of heterogeneous ground objects in high-resolution satellite images is difficult.
“the recognition of heterogeneous ground objects in high-resolution satellite images is quite difficult.”
The paper relies on this without support.
Different land cover categories depend on different types of information for identification: urban functional buildings rely more on structure and shape features, dense built-up areas require spatial relationships, and agricultural and natural categories require texture and spectral information.
“classifying independent urban functional buildings relies more on structure and shape features, distinguishing dense built-up areas requires spatial relationships, and the identification of agricultural and natural categories cannot be done without texture and spectral information.”
The paper relies on this without support.
ST-2 has lower spatial resolution than PS and GF-1, and cannot present very fine edges in both ground truth and results.
“the spatial resolution of ST-2 is lower than those of PS and GF-1, and it cannot present very fine edges in both ground truth and results.”
The paper relies on this without support.
GF-1 and GF-2 have more similar imaging processes, resulting in closer distributions of the source and target domains.
“the sensors of GF-1 and GF-2 have more similar imaging processes, resulting in closer distributions of the source and target domains”
The paper relies on this without support.
Features of forest and cropland are largely influenced by geographical location and seasonal changes.
“their features are largely influenced by geographical location and seasonal changes.”
The paper relies on this without support.
Rapid urban development in China causes new high-rise residential buildings to be mixed with old ones, which have the same appearance as rural settlements.
“because of the rapid urban development in China, new high-rise residential buildings are mixed with old ones, which have the same appearance as rural settlements”
Self-check
Percentages, sums and reported differences re-computed from the paper’s own numbers.
Each contradiction between two passages listed here was confirmed by an independent check.
Rated minor: it would not touch a result — a value no result rests on, a p-value that stays on the same side of the significance level, or a conflict that is clerical, resolved elsewhere in the paper, or outside its own findings.
In the paper
§ Enabling country-scale land cover mapping with meter-resolution satellite imagery > Methodology > Domain joint learning for unsupervised domain adaptation
“In the DT branch, entropy map ExT∈R^(H×W) is calculated as (1) ExT^(h,w)=(−1)/(log(K))∑k=1KFxT^(h,w,k)log(FxT^(h,w,k)),where ExT^(h,w)∈[0,1] is the value of ExT at pixel (h,w).”
§ Enabling country-scale land cover mapping with meter-resolution satellite imagery > Methodology > Domain joint learning for unsupervised domain adaptation
“where FxT^(h,w)∈R^K is the feature vector of pixel located at (h,w), and PxT^(h,w)∈R^K, of which the kth element represents the probability that this pixel belongs to class k.”
Rated minor: it would not touch a result — a value no result rests on, a p-value that stays on the same side of the significance level, or a conflict that is clerical, resolved elsewhere in the paper, or outside its own findings.
In the paper
§ Enabling country-scale land cover mapping with meter-resolution satellite imagery > Experiments > Land cover mapping
“| AdaptSeg+DPA | | 64.46 | 32.35 | 19.21 | | 60.80 | 34.94 | 22.37 |”
§ Enabling country-scale land cover mapping with meter-resolution satellite imagery > Experiments > Experimental setup
“mF1 is the category mean of F1-score. mIOU is the category mean of the intersection over union (IOU)”
Citations
Cites
Deep Residual Learning for Image Recognition
He, K., Zhang, X., Ren, S., & Sun, J. (2016) · 2016 IEEE Conference on Computer Vision and Pattern Recognition (CVPR) · doi:10.1109/cvpr.2016.90 · Cited by 235,474
U-Net: Convolutional Networks for Biomedical Image Segmentation
Ronneberger, O., Fischer, P., & Brox, T. (2015) · Lecture notes in computer science · doi:10.1007/978-3-319-24574-4_28 · Cited by 99,404
LeCun, Y., Bengio, Y., & Hinton, G. (2015) · Nature · doi:10.1038/nature14539 · Cited by 84,126
Going deeper with convolutions
Szegedy, C., Liu, W., Jia, Y., Sermanet, P., Reed, S., Anguelov, D., Erhan, D., Vanhoucke, V., & Rabinovich, A. (2015) · 2015 IEEE Conference on Computer Vision and Pattern Recognition (CVPR) · doi:10.1109/cvpr.2015.7298594 · Cited by 48,562
Fully convolutional networks for semantic segmentation
Long, J., Shelhamer, E., & Darrell, T. (2015) · 2015 IEEE Conference on Computer Vision and Pattern Recognition (CVPR) · doi:10.1109/cvpr.2015.7298965 · Cited by 38,834
(2008) · Journal of Machine Learning Research · Cited by 33,051
Textural Features for Image Classification
Haralick, R. M., Shanmugam, K., & Dinstein, I. (1973) · IEEE Transactions on Systems, Man, and Cybernetics · doi:10.1109/tsmc.1973.4309314 · Cited by 22,886
Chen, L.-C., Papandreou, G., Kokkinos, I., Murphy, K., & Yuille, A. L. (2018) · IEEE Transactions on Pattern Analysis and Machine Intelligence · doi:10.1109/tpami.2017.2699184 · Cited by 22,392
Encoder-Decoder with Atrous Separable Convolution for Semantic Image Segmentation
Chen, L.-C., Zhu, Y., Papandreou, G., Schroff, F., & Adam, H. (2018) · Lecture Notes in Computer Science · doi:10.1007/978-3-030-01234-2_49 · Cited by 20,054
Fully convolutional networks for semantic segmentation
Shelhamer, E., Long, J., & Darrell, T. (2017) · IEEE Transactions on Pattern Analysis and Machine Intelligence · doi:10.1109/tpami.2016.2572683 · Cited by 11,898
Research works printed but not linked: 1
- Lee, D.-H., et al., 2013. Pseudo-label: The simple and efficient semi-supervised learning method for deep neural networks. In: International Conference on Machine Learning Workshops, Vol. 3. p. 896.
Cited by
Sorted by citations
Land Use and Land Cover Classification Meets Deep Learning: A Review
Zhao, S., Tu, K., Ye, S., Tang, H., Hu, Y., & Xie, C. (2023) · Sensors · doi:10.3390/s23218966 · Cited by 152
A semantic-enhanced multi-modal remote sensing foundation model for Earth observation
Wu, K., Zhang, Y., Ru, L., Dang, B., Lao, J., Yu, L., Luo, J., Zhu, Z., Sun, Y., Zhang, J., et al. (2025) · Nature Machine Intelligence · doi:10.1038/s42256-025-01078-8 · Cited by 130
A Frequency Decoupling Network for Semantic Segmentation of Remote Sensing Images
Li, X., Xu, F., Yu, A., Lyu, X., Gao, H., & Zhou, J. (2025) · IEEE Transactions on Geoscience and Remote Sensing · doi:10.1109/tgrs.2025.3531879 · Cited by 110
Marsocci, V., Jia, Y., Bellier, G. L., Kerekes, D., Zeng, L., Häfner, S., Gerard, S., Brune, E., Yadav, R., Shibli, A., et al. (2025) · IEEE Geoscience and Remote Sensing Magazine · doi:10.1109/mgrs.2025.3628194 · Cited by 118
EarthNets: Empowering artificial intelligence for Earth observation
Xiong, Z., Zhang, F., Wang, Y., Shi, Y., & Zhu, X. X. (2024) · IEEE Geoscience and Remote Sensing Magazine · doi:10.1109/mgrs.2024.3466998 · Cited by 108
Self-citation
Metadata
- Authors
- Tong, X.-Y., Xia, G.-S., & Zhu, X. X.
- Affiliations
- Wuhan University (CN)
- Technical University of Munich (DE)
- Corresponding author
- Zhu, Xiao Xiang
- Venue
- ISPRS Journal of Photogrammetry and Remote Sensing
- Publisher
- Elsevier BV
- Published
- 2023-02
- Volume
- 196
- Pages
- 178-196
- ISSN
- 0924-2716 (ISSN-L)
- PMC
- PMC9939933
- OpenAlex
- W4313908836
- Semantic Scholar
- 5f23ad23dbe17acba04e07fa5221576d5bb11a58
- Cited by
- 125
- References
- 85
- Citations by year
- 2026: 26 · 2025: 55 · 2024: 34 · 2023: 10
- FWCI
- 9.31
- Type
- journal article
- Language
- en
- Open access
- hybrid
- doi.org
- Licence
- Locations
- ISPRS Journal of Photogrammetry and Remote Sensing (publishedVersion, cc-by)
- PubMed Central (publishedVersion, cc-by)
- PubMed (publishedVersion)
- elib (German Aerospace Center) (acceptedVersion)
- arXiv (Cornell University) (submittedVersion)
- arXiv (Cornell University)
- Funders
- European Commission (HORIZON2020)
- Deutsche Forschungsgemeinschaft (519016653, ZH 498/18-1)
- Bundesministerium für Bildung und Forschung (01DD20001)
- Bundesministerium für Wirtschaft und Technologie (W2-W3-100, 50EE2201C)
- Helmholtz Artificial Intelligence Cooperation Unit (ZT-I-PF-5-01)
- H2020 European Research Council (714087)
- Topics
- Physical Sciences › Computer Science › Computer Vision and Pattern Recognition › Remote-Sensing Image Classification
- Social Sciences › Geography, Planning and Development › Remote Sensing and Land Use
- Physical Sciences › Computer Science › Artificial Intelligence › Domain Adaptation and Few-Shot Learning
- Keywords
- land cover mapping, high-resolution satellite imagery, unsupervised domain adaptation, Siamese network, pseudo-labeling, data balancing, Gaofen-2, PlanetScope, Sentinel-2, Gaofen-1, cross-sensor generalization, cross-regional generalization, built environment
About these checks
Registry, retraction, Cites and statistics results are computed, not judged, with one exception: a printed reference that no index lists is read once by a model before it counts as a citation error. Claims are extracted by a model and kept only when their quote appears verbatim in the text; each cited source is then checked, with a model’s help, for whether it says what the claim relies on. Those verdicts can be wrong — read the claim’s quote and the cited source before relying on one.
A language model drew the claims from the paper on 2026-11-08, under version 3 of the claim definition (model deepseek-v4.1-flash, prompt extract-v3).
A second model labelled each claim on 2026-11-08 (model jev-1.13-20260917, definition revision gold-guideline-v0.2).
Cited sources are checked with a language model’s help (gpt-6-sol).
Statistics and arithmetic are recomputed, not judged.
Confidence bands are shown only for fields calibrated on our annotated test set. None is calibrated yet, so no band is shown.
What counts as a claim ›How we measure confidence ›How we check this ›
Are you an author, or do you see a problem with this page? Request a review
