

The DOI matches its Crossref record; 135 of the 135 references it cites were found in a registry or an index.
How many TCR clonotypes does a body maintain?
Open accessAbstract
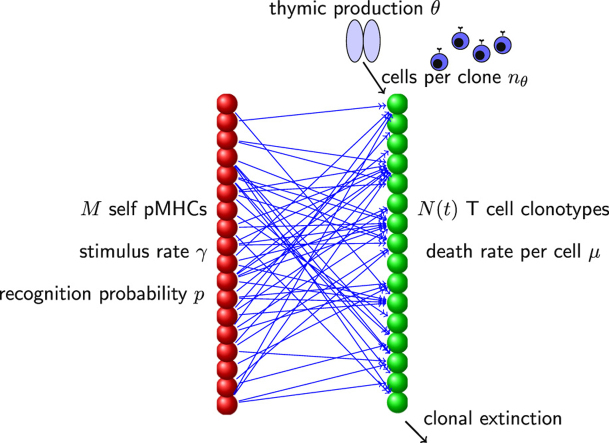
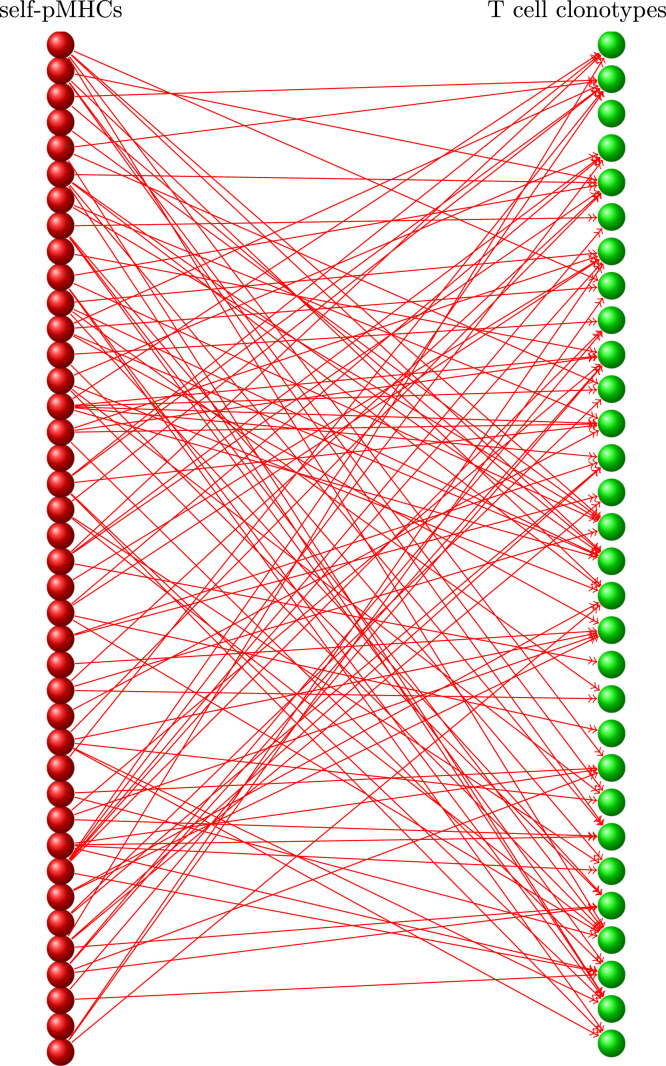
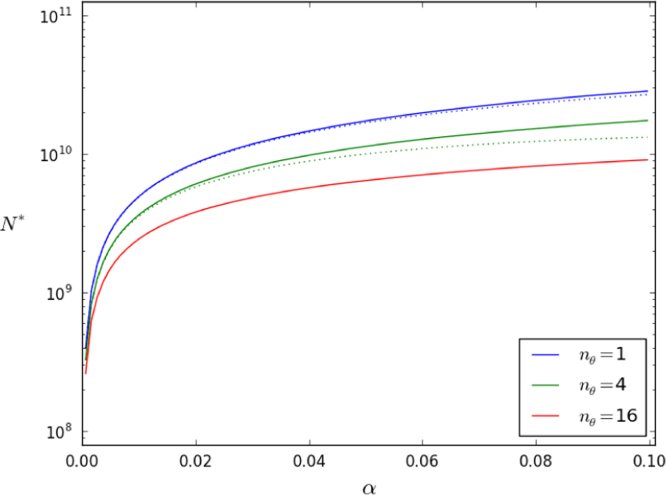
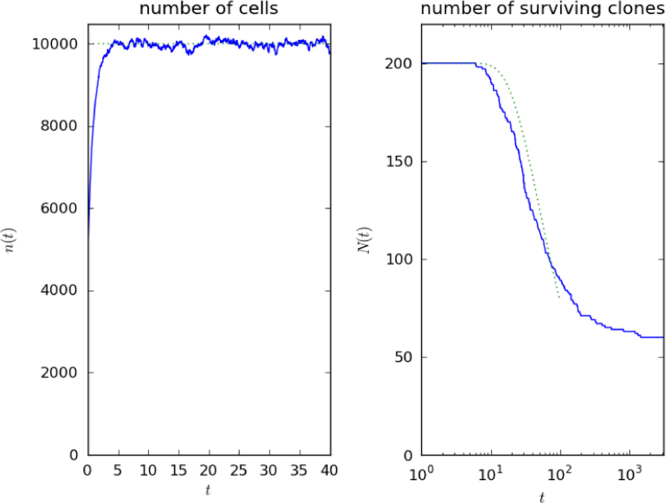
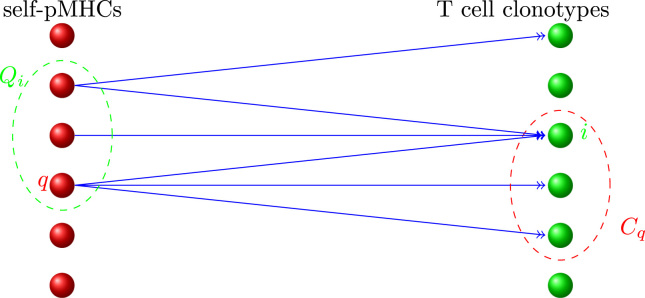
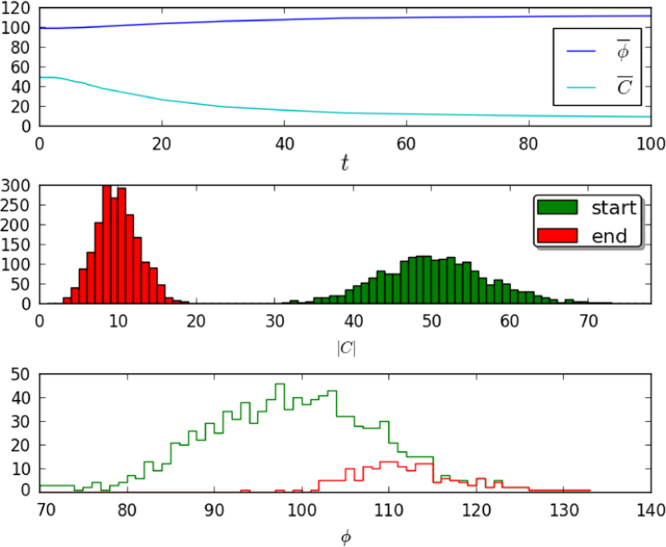
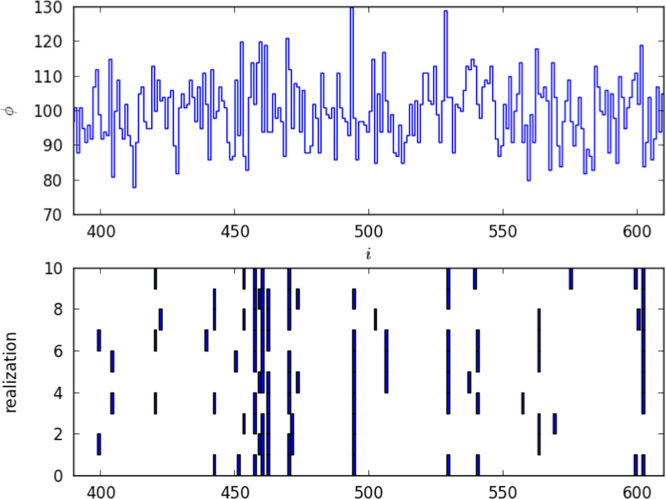
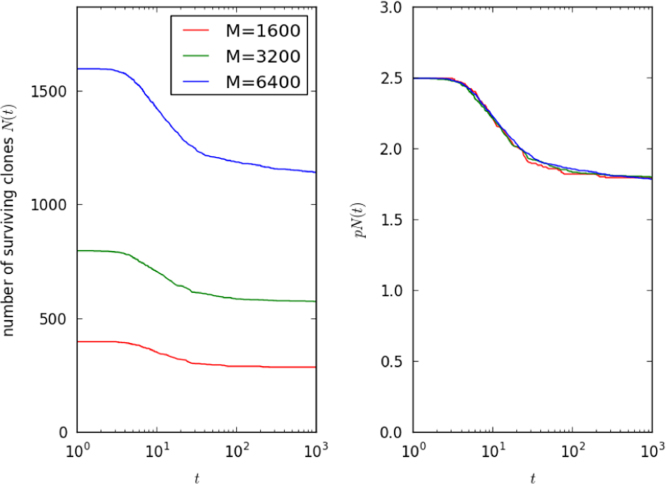
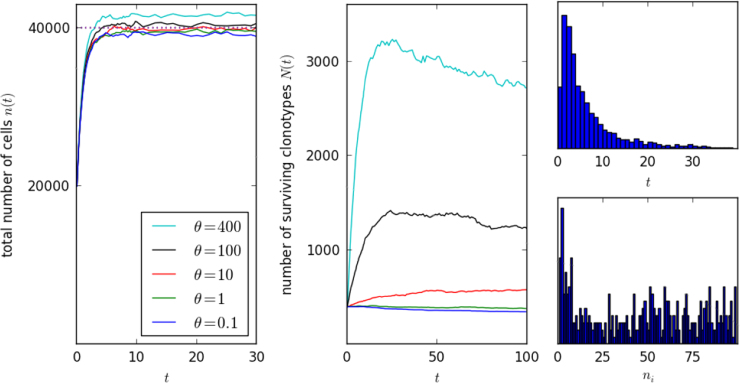
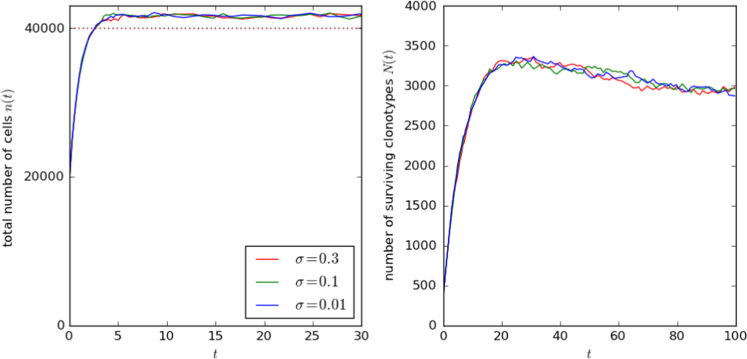
We consider the lifetime of a T cell clonotype, the set of T cells with the same T cell receptor, from its thymic origin to its extinction in a multiclonal repertoire. Using published estimates of total cell numbers and thymic production rates, we calculate the mean number of cells per TCR clonotype, and the total number of clonotypes, in mice and humans. When there is little peripheral division, as in a mouse, the number of cells per clonotype is small and governed by the number of cells with identical TCR that exit the thymus. In humans, peripheral division is important and a clonotype may survive for decades, during which it expands to comprise many cells. We therefore devise and analyse a computational model of homeostasis of a multiclonal population. Each T cell in the model competes for self pMHC stimuli, cells of any one clonotype only recognising a small fraction of the many subsets of stimuli. A constant mean total number of cells is maintained by a balance between cell division and death, and a stable number of clonotypes by a balance between thymic production of new clonotypes and extinction of existing ones. The number of distinct clonotypes in a human body may be smaller than the total number of naive T cells by only one order of magnitude.
Overview
The claims and statistics of this paper haven’t been checked yet.
Run the check — free, no account needed. It reads the open-access text and checks the sources it cites.
Integrity signals
Registry
Cites
Statistics
Figures
Verification
Claims the paper makes
The claims and statistics of this paper haven’t been checked yet.
Run the check — free, no account needed. It reads the open-access text and checks the sources it cites.
Claims other papers make about this one
Each is checked against this paper’s own text: does it say what the citing paper says it does?
In the citing paper
“This estimate is consistent with TREC frequencies as well as with modeling experiments which predict that the number of distinct sequences in humans is by only one order of magnitude lower than the number of total naive cells”
From Successful and Maladaptive T Cell Aging (2017) · cites this paper as Lythe et al., 2016
Self-check
Percentages, sums and reported differences re-computed from the paper’s own numbers.
The self-check needs the paper’s full text.
Citations
Cites
Continuous Martingales and Brownian Motion
Revuz, D., & Yor, M. (1999) · Grundlehren der mathematischen Wissenschaften · doi:10.1007/978-3-662-06400-9 · Cited by 6,353
An Introduction to Stochastic Modeling
Frey, M. R., Taylor, H. M., & Karlin, S. (1994) · Technometrics · doi:10.2307/1269970 · Cited by 1,278
Comprehensive assessment of T-cell receptor β-chain diversity in αβ T cells
Robins, H. S., Campregher, P. V., Srivastava, S. K., Wacher, A., Turtle, C. J., Kahsai, O., Riddell, S. R., Warren, E. H., & Carlson, C. S. (2009) · Blood · doi:10.1182/blood-2009-04-217604 · Cited by 1,122
A very high level of crossreactivity is an essential feature of the T-cell receptor.
Mason, D. (1998) · Immunology today (Amsterdam. Regular ed.) · doi:10.1016/s0167-5699(98)01299-7 · Cited by 1,067
Stochastic Modelling for Systems Biology
Wilkinson, D. (2006) · Chapman & Hall/CRC eBooks · doi:10.1201/9781420010664 · Cited by 1,041
Moon, J. J., Chu, H., Pepper, M., McSorley, S. J., Jameson, S. C., Kedl, R. M., & Jenkins, M. K. (2007) · Immunity · doi:10.1016/j.immuni.2007.07.007 · Cited by 977
IL-7 is critical for homeostatic proliferation and survival of naïve T cells
Tan, J. T., Dudl, E. P., LeRoy, E., Murray, R. M., Sprent, J., Weinberg, K. I., & Surh, C. D. (2001) · Proceedings of the National Academy of Sciences · doi:10.1073/pnas.161126098 · Cited by 966
A Direct Estimate of the Human αβ T Cell Receptor Diversity
Arstila, T. P., Casrouge, A., Baron, V., Even, J., Kanellopoulos, J., & Kourilsky, P. (1999) · Science · doi:10.1126/science.286.5441.958 · Cited by 931
Human memory T cells: generation, compartmentalization and homeostasis
Farber, D. L., Yudanin, N. A., & Restifo, N. P. (2014) · Nature Reviews Immunology · doi:10.1038/nri3567 · Cited by 897
The Influence of Age on T Cell Generation and TCR Diversity
Naylor, K., Li, G., Vallejo, A. N., Lee, W.-W., Koetz, K., Bryl, E., Witkowski, J., Fulbright, J., Weyand, C. M., & Goronzy, J. J. (2005) · The Journal of Immunology · doi:10.4049/jimmunol.174.11.7446 · Cited by 802
Research works printed but not linked: 2
- Hershberg, 2003, What is the basis of the immune systems specificity?, Math. Model. Comput. Biol. Med., 377
- Merrill, 1994, Development of the T-cell repertoire, Rocky Mt. J. Math., 24, 214
Cited by
Sorted by citations
Mechanisms underlying T cell ageing
Goronzy, J. J., & Weyand, C. M. (2019) · Nature Reviews Immunology · doi:10.1038/s41577-019-0180-1 · Cited by 506
Successful and Maladaptive T Cell Aging
Goronzy, J. J., & Weyand, C. M. (2017) · Immunity · doi:10.1016/j.immuni.2017.03.010 · Cited by 362
Principles and therapeutic applications of adaptive immunity
Chi, H., Pepper, M., & Thomas, P. G. (2024) · Cell · doi:10.1016/j.cell.2024.03.037 · Cited by 394
Cancer Therapy With TCR-Engineered T Cells: Current Strategies, Challenges, and Prospects
Shafer, P. W., Somes, L. K., & Hoyos, V. (2022) · Frontiers in Immunology · doi:10.3389/fimmu.2022.835762 · Cited by 292
Sethna, Z. M., Elhanati, Y., Callan, C. G., Walczak, A. M., & Mora, T. (2019) · Bioinformatics · doi:10.1093/bioinformatics/btz035 · Cited by 235
Mathematical Models for Immunology: Current State of the Art and Future Research Directions
Eftimie, R., Gillard, J. J., & Cantrell, D. A. (2016) · Bulletin of Mathematical Biology · doi:10.1007/s11538-016-0214-9 · Cited by 220
The landscape of T cell antigens for cancer immunotherapy
Peri, A., Salomon, N., Wolf, Y., Kreiter, S., Diken, M., & Samuels, Y. (2023) · Nature Cancer · doi:10.1038/s43018-023-00588-x · Cited by 140
Predicting the spectrum of TCR repertoire sharing with a data‐driven model of recombination
Elhanati, Y., Sethna, Z., Callan, C. G., Mora, T., & Walczak, A. M. (2018) · Immunological Reviews · doi:10.1111/imr.12665 · Cited by 123
Wang, P., Yao, L., Luo, M., Zhou, W., Jin, X., Xu, Z., Shi, Y., Li, Y., Xu, C., Cheng, R., et al. (2021) · Cell Discovery · doi:10.1038/s41421-021-00280-3 · Cited by 129
Oakes, T., Heather, J., Best, K., Byng-Maddick, R., Husovsky, C., Ismail, M., Joshi, K., Maxwell, G., Noursadeghi, M., Riddell, N. E., et al. (2017) · Frontiers in Immunology · doi:10.3389/fimmu.2017.01267 · Cited by 119
Genesis of the αβ T-cell receptor
Dupic, T., Marcou, Q., Walczak, A. M., & Mora, T. (2019) · PLoS Computational Biology · doi:10.1371/journal.pcbi.1006874 · Cited by 107
Sun, X., Nguyen, T. B. V., Achour, A., Ko, A., Cifello, J., Ling, C., Sharma, J., Hiroi, T., Zhang, Y., Chia, C. W., et al. (2022) · Journal of Clinical Investigation · doi:10.1172/jci158122 · Cited by 115
The immuneML ecosystem for machine learning analysis of adaptive immune receptor repertoires
Pavlović, M., Scheffer, L., Motwani, K., Kanduri, C., Kompova, R., Vazov, N., Waagan, K., Bernal, F. L. M., da Costa, A. A., Corrie, B., et al. (2021) · Nature Machine Intelligence · doi:10.1038/s42256-021-00413-z · Cited by 90
cGAS-STING pathway as a potential trigger of immunosenescence and inflammaging
Schmitz, C. R. R., Maurmann, R. M., Guma, F. T. C. R., Bauer, M. E., & Barbé‐Tuana, F. M. (2023) · Frontiers in Immunology · doi:10.3389/fimmu.2023.1132653 · Cited by 95
The naive T-cell receptor repertoire has an extremely broad distribution of clone sizes
de Greef, P. C., Oakes, T., Gerritsen, B., Ismail, M., Heather, J., Hermsen, R., Chain, B., & de Boer, R. J. (2020) · eLife · doi:10.7554/elife.49900 · Cited by 96
How many different clonotypes do immune repertoires contain?
Mora, T., & Walczak, A. M. (2019) · Current Opinion in Systems Biology · doi:10.1016/j.coisb.2019.10.001 · Cited by 93
ATM-TCR: TCR-Epitope Binding Affinity Prediction Using a Multi-Head Self-Attention Model
Cai, M., Bang, S., Zhang, P., & Lee, H. (2022) · Frontiers in Immunology · doi:10.3389/fimmu.2022.893247 · Cited by 82
From thymus to tissues and tumors: A review of T-cell biology
Chopp, L. B., Redmond, C., O’Shea, J. J., & Schwartz, D. M. (2022) · Journal of Allergy and Clinical Immunology · doi:10.1016/j.jaci.2022.10.011 · Cited by 93
Biomaterials to enhance antigen-specific T cell expansion for cancer immunotherapy
Isser, A., Livingston, N. K., & Schneck, J. P. (2020) · Biomaterials · doi:10.1016/j.biomaterials.2020.120584 · Cited by 77
T-cell repertoire diversity: friend or foe for protective antitumor response?
Porciello, N., Franzese, O., D’Ambrosio, L., Palermo, B., & Nisticò, P. (2022) · Journal of Experimental & Clinical Cancer Research · doi:10.1186/s13046-022-02566-0 · Cited by 88
Aversa, I., Malanga, D., Fiume, G., & Palmieri, C. (2020) · International Journal of Molecular Sciences · doi:10.3390/ijms21072378 · Cited by 72
Christley, S., Scarborough, W., Salinas, E., Rounds, W. H., Toby, I. T., Fonner, J. M., Levin, M. K., Kim, M., Mock, S. A., Jordan, C., et al. (2018) · Frontiers in Immunology · doi:10.3389/fimmu.2018.00976 · Cited by 72
Explaining A Black-box By Using A Deep Variational Information Bottleneck Approach
Bang, S., Xie, P., Lee, H., Wu, W., & Xing, E. P. (2021) · Proceedings of the AAAI Conference on Artificial Intelligence · doi:10.1609/aaai.v35i13.17358 · Cited by 73
Quantitative immunology for physicists
Altan-Bonnet, G. Y., Mora, T., & Walczak, A. M. (2020) · Physics Reports · doi:10.1016/j.physrep.2020.01.001 · Cited by 67
Developing combination strategies using PD-1 checkpoint inhibitors to treat cancer
Schmidt, E. V. (2018) · Seminars in Immunopathology · doi:10.1007/s00281-018-0714-9 · Cited by 63
Sex bias in MHC I-associated shaping of the adaptive immune system
Schneider‐Hohendorf, T., Görlich, D., Savola, P., Kelkka, T., Mustjoki, S. M., Groß, C. C., Owens, G. C., Klotz, L., Dornmair, K., Wiendl, H., et al. (2018) · Proceedings of the National Academy of Sciences · doi:10.1073/pnas.1716146115 · Cited by 64
Stitchr: stitching coding TCR nucleotide sequences from V/J/CDR3 information
Heather, J., Spindler, M. J., Alonso, M. H., Shui, Y., Millar, D. G., Johnson, D. S., Cobbold, M., & Hata, A. N. (2022) · Nucleic Acids Research · doi:10.1093/nar/gkac190 · Cited by 57
GVHD Pathogenesis, Prevention and Treatment: Lessons From Humanized Mouse Transplant Models
Hess, N. J., Brown, M. E., & Capitini, C. M. (2021) · Frontiers in Immunology · doi:10.3389/fimmu.2021.723544 · Cited by 59
MHC-II alleles shape the CDR3 repertoires of conventional and regulatory naïve CD4 + T cells
Logunova, N. N., Kriukova, V., Shelyakin, P. V., Egorov, E. S., Pereverzeva, A. R., Bozhanova, N. G., Shugay, M., Shcherbinin, D. S., Pogorelyy, M. V., Merzlyak, E. M., et al. (2020) · Proceedings of the National Academy of Sciences · doi:10.1073/pnas.2003170117 · Cited by 55
Using the T Cell Receptor as a Biomarker in Type 1 Diabetes
Nakayama, M., & Michels, A. W. (2021) · Frontiers in Immunology · doi:10.3389/fimmu.2021.777788 · Cited by 52
Quantifying lymphocyte receptor diversityPreprint
Mora, T., & Walczak, A. M. (2016) · bioRxiv (Cold Spring Harbor Laboratory) · doi:10.1101/046870 · Cited by 60
Early life imprints the hierarchy of T cell clone sizes
Gaimann, M. U., Nguyen, M., Desponds, J., & Mayer, A. (2020) · eLife · doi:10.7554/elife.61639 · Cited by 50
Mathematics in modern immunology
Castro, M., Lythe, G., Molina-Parı́s, C., & Ribeiro, R. M. (2016) · Interface Focus · doi:10.1098/rsfs.2015.0093 · Cited by 49
Self-citationInferring the immune response from repertoire sequencing
Touzel, M. P., Walczak, A. M., & Mora, T. (2020) · PLoS Computational Biology · doi:10.1371/journal.pcbi.1007873 · Cited by 46
On being the right size: antibody repertoire formation in the mouse and human
Collins, A. M., & Jackson, K. (2017) · Immunogenetics · doi:10.1007/s00251-017-1049-8 · Cited by 49
Modeling human T1D-associated autoimmune processes
Maharlooei, M. K., Madley, R., Borsotti, C., Ferreira, L. M. R., Sharp, R. C., Brehm, M. A., Greiner, D. L., Parent, A. V., Anderson, M. S., Sykes, M., et al. (2021) · Molecular Metabolism · doi:10.1016/j.molmet.2021.101417 · Cited by 42
The Goldilocks Window of Personalized Chemotherapy: Getting the Immune Response Just Right
Park, D. S., Robertson‐Tessi, M., Luddy, K. A., Maini, P. K., Bonsall, M. B., Gatenby, R. A., & Anderson, A. R. A. (2019) · Cancer Research · doi:10.1158/0008-5472.can-18-3712 · Cited by 41
Age as a risk factor in vasculitis
Gloor, A. D., Berry, G. J., Goronzy, J. J., & Weyand, C. M. (2022) · Seminars in Immunopathology · doi:10.1007/s00281-022-00911-1 · Cited by 44
Autoimmunity (or Not) in Atopic Dermatitis
Roesner, L. M., & Werfel, T. (2019) · Frontiers in Immunology · doi:10.3389/fimmu.2019.02128 · Cited by 38
Diversity in biology: definitions, quantification and models
Xu, S., Böttcher, L., & Chou, T. (2020) · Physical Biology · doi:10.1088/1478-3975/ab6754 · Cited by 41
Guo, L., Bi, X., Li, Y., Li, W., Zhang, W., Jiang, W., Ma, J., Feng, L., Zhang, K., & Shou, J. (2020) · The Journal of Pathology · doi:10.1002/path.5396 · Cited by 35
Machine Learning Approaches to TCR Repertoire Analysis
Katayama, Y., Yokota, R., Akiyama, T., & Kobayashi, T. (2022) · Frontiers in Immunology · doi:10.3389/fimmu.2022.858057 · Cited by 35
The natural history of naive T cells from birth to maturity
Seddon, B. P., & Yates, A. J. (2018) · Immunological Reviews · doi:10.1111/imr.12694 · Cited by 34
Autoreactive T cell receptors with shared germline-like α chains in type 1 diabetes
Linsley, P. S., Barahmand-pour-Whitman, F., Balmas, E., DeBerg, H. A., Flynn, K. J., Hu, A. K., Rosasco, M. G., Chen, J., O’Rourke, C., Serti, E., et al. (2021) · JCI Insight · doi:10.1172/jci.insight.151349 · Cited by 32
Machine Learning Applications in Solid Organ Transplantation and Related Complications
Balch, J. A., Delitto, D., Tighe, P. J., Zarrinpar, A., Efron, P. A., Rashidi, P., Upchurch, G. R., Bihorac, A., & Loftus, T. J. (2021) · Frontiers in Immunology · doi:10.3389/fimmu.2021.739728 · Cited by 33
T Cell Development and Function
Adu‐Berchie, K., Obuseh, F. O., & Mooney, D. J. (2023) · Rejuvenation Research · doi:10.1089/rej.2023.0015 · Cited by 34
Amoriello, R., Mariottini, A., & Ballerini, C. (2021) · Frontiers in Immunology · doi:10.3389/fimmu.2021.799380 · Cited by 31
Leary, A. Y., Scott, D., Gupta, N. T., Waite, J. C., Skokos, D., Atwal, G. S., & Hawkins, P. G. (2024) · Nature Communications · doi:10.1038/s41467-024-48198-0 · Cited by 30
What a Clinical Hematologist Should Know about T Cells?
Sharma, S. K. (2020) · International Blood Research & Reviews · doi:10.9734/ibrr/2020/v11i430137 · Cited by 27
Two types of human TCR differentially regulate reactivity to self and non-self antigens
Trofimov, A., Brouillard, P., Larouche, J., Séguin, J., Laverdure, J., Brasey, A., Ehx, G., Roy, D., Busque, L., Lachance, S., et al. (2022) · iScience · doi:10.1016/j.isci.2022.104968 · Cited by 30
Lanfermeijer, J., Borghans, J. A. M., & van Baarle, D. (2020) · Aging Cell · doi:10.1111/acel.13262 · Cited by 27
Recall T cell responses to bluetongue virus produce a narrowing of the T cell repertoire
Rojas, J. M., Calvo, T. R., & Sevilla, N. (2017) · Veterinary Research · doi:10.1186/s13567-017-0444-3 · Cited by 25
Bortone, D. S., Woodcock, M. G., Parker, J. S., & Vincent, B. G. (2020) · Cancer Immunology Research · doi:10.1158/2326-6066.cir-20-0398 · Cited by 24
Myronov, A., Mazzocco, G., Król, P., & Plewczyński, D. (2023) · Bioinformatics · doi:10.1093/bioinformatics/btad468 · Cited by 24
Some deterministic and stochastic mathematical models of naïve T‐cell homeostasis
Lythe, G., & Molina-Parı́s, C. (2018) · Immunological Reviews · doi:10.1111/imr.12696 · Cited by 22
Self-citationPhage display enables machine learning discovery of cancer antigen–specific TCRs
Croce, G., Lani, R., Tardivon, D., Bobisse, S., de Tiani, M., Bragina, M., Perez, M. A. S., Michaux, J., Pak, H. S., Michel, A., et al. (2025) · Science Advances · doi:10.1126/sciadv.ads5589 · Cited by 23
Universal CAR 2.0 to overcome current limitations in CAR therapy
Schlegel, L. S., Werbrouck, C., Boettcher, M., & Schlegel, P. (2024) · Frontiers in Immunology · doi:10.3389/fimmu.2024.1383894 · Cited by 21
Shang, B., Guo, L., Shen, R., Cao, C., Xie, R., Jiang, W., Wen, L., Bi, X., Shi, H., Zheng, S., et al. (2021) · Frontiers in Oncology · doi:10.3389/fonc.2021.771545 · Cited by 21
Impact of TCR Diversity on the Development of Transplanted or Chemically Induced Tumors
Schreiber, K., Karrison, T. G., Wolf, S. P., Kiyotani, K., Steiner, M., Littmann, E. R., Pamer, E. G., Kammertoens, T., Schreiber, H. W., & Leisegang, M. (2019) · Cancer Immunology Research · doi:10.1158/2326-6066.cir-19-0567 · Cited by 21
What’s self got to do with it: Sources of heterogeneity among naive T cells
This, S., Rogers, D., Gauthier, È. M., Mandl, J. N., & Melichar, H. J. (2022) · Seminars in Immunology · doi:10.1016/j.smim.2022.101702 · Cited by 19
Dessalles, R., D'Orsogna, M. R., & Chou, T. (2018) · Journal of Statistical Physics · doi:10.1007/s10955-018-2128-4 · Cited by 20
Selected before selection: A case for inherent antigen bias in the T-cell receptor repertoire
Thomas, P. G., & Crawford, J. C. (2019) · Current Opinion in Systems Biology · doi:10.1016/j.coisb.2019.10.007 · Cited by 21
Smith, N. P., Ruiter, B., Virkud, Y. V., Tu, A. A., Monian, B., Moon, J. J., Love, J. C., & Shreffler, W. G. (2021) · JCI Insight · doi:10.1172/jci.insight.140028 · Cited by 18
NoisET: Noise Learning and Expansion Detection of T-Cell Receptors
Koraichi, M. B., Touzel, M. P., Mazzolini, A., Mora, T., & Walczak, A. M. (2022) · The Journal of Physical Chemistry A · doi:10.1021/acs.jpca.2c05002 · Cited by 23
The memory of the fatty acid system
Straub, R. H. (2020) · Progress in Lipid Research · doi:10.1016/j.plipres.2020.101049 · Cited by 21
Immune fingerprinting through repertoire similarity
Dupic, T., Koraichi, M. B., Minervina, A. A., Pogorelyy, M. V., Mora, T., & Walczak, A. M. (2021) · PLoS Genetics · doi:10.1371/journal.pgen.1009301 · Cited by 19
A new mechanism shapes the naïve CD8+ T cell repertoire: the selection for full diversity
Gonçalves, P., Ferrarini, M., Molina-Parı́s, C., Lythe, G., Vasseur, F., Lim, A., Rocha, B., & Azogui, O. (2017) · Molecular Immunology · doi:10.1016/j.molimm.2017.01.026 · Cited by 18
Self-citationA Mathematical Model of the Effects of Aging on Naive T Cell Populations and Diversity
Lewkiewicz, S. M., Chuang, Y.-L., & Chou, T. (2019) · Bulletin of Mathematical Biology · doi:10.1007/s11538-019-00630-z · Cited by 16
Dessalles, R., Pan, Y., Xia, M., Maestrini, D., D'Orsogna, M. R., & Chou, T. (2022) · Frontiers in Immunology · doi:10.3389/fimmu.2021.735135 · Cited by 17
Diversity in Biology: definitions, quantification, and models
Xu, S., Böttcher, L., & Chou, T. (2020) · Repository for Publications and Research Data (ETH Zurich) · doi:10.3929/ethz-b-000387958 · Cited by 17
Computational methods and data resources for predicting tumor neoantigens
Zhao, X., Wei, L., & Zhang, X. (2025) · Briefings in Bioinformatics · doi:10.1093/bib/bbaf302 · Cited by 16
Quantifying T Cell Cross-Reactivity: Influenza and Coronaviruses
Gaevert, J. A., Duque, D. L., Lythe, G., Molina-Parı́s, C., & Thomas, P. G. (2021) · Viruses · doi:10.3390/v13091786 · Cited by 13
Self-citationChen, Z., John, J., & Wang, J. H. (2022) · Frontiers in Oncology · doi:10.3389/fonc.2022.995434 · Cited by 19
Bioengineering translational models of lymphoid tissues
Michaels, Y. S., Buchanan, C. F., Gjorevski, N., & Moisan, A. (2023) · Nature Reviews Bioengineering · doi:10.1038/s44222-023-00101-0 · Cited by 16
Vukmanović, S., & Sadrieh, N. K. (2017) · Critical Reviews in Toxicology · doi:10.1080/10408444.2017.1288025 · Cited by 14
Tolstykh, E. I., Дегтева, М. О., Vozilova, A. V., & Anspaugh, L. R. (2017) · Radiation and Environmental Biophysics · doi:10.1007/s00411-017-0712-7 · Cited by 14
Clonal Neoantigen: Emerging “Mechanism-based” Biomarker of Immunotherapy Response
Nemunaitis, J. J., Stanbery, L., Willoughby, D., Bognar, E., Brun, S., Walter, A., Monk, B. J., Rocconi, R. P., Choucair, K., & Coleman, R. L. (2023) · Cancers · doi:10.3390/cancers15235616 · Cited by 14
Population dynamics of immune repertoiresPreprint
Desponds, J., Mayer, A., Mora, T., & Walczak, A. M. (2017) · bioRxiv (Cold Spring Harbor Laboratory) · doi:10.1101/112755 · Cited by 13
Explaining a black-box using Deep Variational Information Bottleneck ApproachPreprint
Bang, S., Xie, P., Lee, H., Wu, W., & Xing, E. P. (2019) · arXiv (Cornell University) · doi:10.48550/arxiv.1902.06918 · Cited by 25
Identification of Antigenic Targets
Gerber, H., Sibener, L. V., Lee, L. J., & Gee, M. H. (2020) · Trends in cancer · doi:10.1016/j.trecan.2020.01.002 · Cited by 12
Inferring the T cell repertoire dynamics of healthy individuals
Koraichi, M. B., Ferri, S., Walczak, A. M., & Mora, T. (2023) · Proceedings of the National Academy of Sciences · doi:10.1073/pnas.2207516120 · Cited by 17
Toby, I. T., Levin, M. K., Salinas, E. A., Christley, S., Bhattacharya, S., Breden, F. J., Buntzman, A., Corrie, B., Fonner, J. M., Gupta, N. T., et al. (2016) · BMC Bioinformatics · doi:10.1186/s12859-016-1214-3 · Cited by 12
The Promise of Personalized TCR-Based Cellular Immunotherapy for Cancer Patients
Arnaud, M., Bobisse, S., Chiffelle, J., & Harari, A. (2021) · Frontiers in Immunology · doi:10.3389/fimmu.2021.701636 · Cited by 13
Immigration-induced phase transition in a regulated multispecies birth-death process
Xu, S., & Chou, T. (2018) · Journal of Physics A Mathematical and Theoretical · doi:10.1088/1751-8121/aadcb4 · Cited by 10
Changes in the Immune Cell Repertoire for the Treatment of Malignant Melanoma
Nakamura, K., & Okuyama, R. (2022) · International Journal of Molecular Sciences · doi:10.3390/ijms232112991 · Cited by 10
Mayer-Blackwell, K., Schattgen, S., Cohen-Lavi, L., Crawford, J. C., Souquette, A. H., Gaevert, J. A., Hertz, T., Thomas, P. G., Bradley, P. H., & Fiore-Gartland, A. (2020) · bioRxiv (Cold Spring Harbor Laboratory) · doi:10.1101/2020.12.24.424260 · Cited by 10
Structure modeling and specificity of peptide-MHC class I interactions using geometric deep learningPreprint
Aronson, A., Hochner, T., Cohen, T., & Schneidman‐Duhovny, D. (2022) · bioRxiv (Cold Spring Harbor Laboratory) · doi:10.1101/2022.12.15.520566 · Cited by 9
Transport Barriers Influence the Activation of Anti‐Tumor Immunity: A Systems Biology Analysis
Nikmaneshi, M. R., Baish, J. W., Zhou, H., Padera, T. P., & Munn, L. L. (2023) · Advanced Science · doi:10.1002/advs.202304076 · Cited by 7
CD3 downregulation identifies high-avidity human CD8 T cells
Clutton, G., Weideman, A. M., Mischell, M. A., Kallon, S., Conrad, S. Z., Shaw, F. R., Warren, J. A., Lin, L., Kuruc, J. D., Xu, Y., et al. (2023) · Clinical & Experimental Immunology · doi:10.1093/cei/uxad124 · Cited by 9
Population Dynamics of Immune Repertoires
Desponds, J., Mayer, A., Mora, T., & Walczak, A. M. (2021) · Springer eBooks · doi:10.1007/978-3-030-57204-4_12 · Cited by 9
Context-Aware Amino Acid Embedding Advances Analysis of TCR-Epitope InteractionsPreprint
Zhang, P., Bang, S., Cai, M., & Lee, H. (2023) · bioRxiv (Cold Spring Harbor Laboratory) · doi:10.1101/2023.04.12.536635 · Cited by 11
Mathematical Characterization of Private and Public Immune Receptor Sequences
Böttcher, L., Wald, S., & Chou, T. (2023) · Bulletin of Mathematical Biology · doi:10.1007/s11538-023-01190-z · Cited by 8
Analysis of Transcriptional Profiling of Immune Cells at the Single-Cell Level
Ferguson, A. A., & Chen, K. (2020) · Methods in molecular biology · doi:10.1007/978-1-0716-0266-9_4 · Cited by 8
T Cell Clonal Analysis Using Single-cell RNA Sequencing and Reference Maps
Andreatta, M., Gueguen, P., Borcherding, N. C., & Carmona, S. J. (2023) · BIO-PROTOCOL · doi:10.21769/bioprotoc.4735 · Cited by 7
Porcheddu, V., Lhomme, G., Giraudet, R., Correia, E., & Maillère, B. (2024) · Frontiers in Immunology · doi:10.3389/fimmu.2024.1345195 · Cited by 11
Niebuhr, M., Bahreini, F., Fähnrich, A., Bomholt, C., Bieber, K., Schmidt, E., Ibrahim, S. M., Hammers, C. M., & Kalies, K. (2022) · Frontiers in Immunology · doi:10.3389/fimmu.2022.1006941 · Cited by 7
Distinguishing between monozygotic twins' blood samples through immune repertoire sequencing
Meng, D., Zhou, P., Li, M., Xu, J., Lu, L., Guo, Y., Yu, C., Xu, Y., Xu, X., Chen, F., et al. (2023) · Forensic Science International Genetics · doi:10.1016/j.fsigen.2023.102828 · Cited by 7
T-cell virtuosity in ‘‘knowing thyself”
Acuto, O. (2024) · Frontiers in Immunology · doi:10.3389/fimmu.2024.1343575 · Cited by 9
Evaluation of the capacities of mouse TCR profiling from short read RNA-seq data
Bai, Y., Wang, D., Li, W., Huang, Y., Ye, X., Waite, J. C., Barry, T., Edelmann, K. H., Levenkova, N., Guo, C., et al. (2018) · PLoS ONE · doi:10.1371/journal.pone.0207020 · Cited by 7
A scaling law in CRISPR repertoire sizes arises from the avoidance of autoimmunity
Chen, H., Mayer, A., & Balasubramanian, V. (2022) · Current Biology · doi:10.1016/j.cub.2022.05.021 · Cited by 4
Metadata
- Authors
- Lythe, G., Callard, R. E., Hoare, R. L., & Molina-París, C.
- Affiliations
- University of Leeds (GB)
- University College London (GB)
- Corresponding author
- Lythe, Grant
- Venue
- Journal of Theoretical Biology
- Publisher
- Elsevier BV
- Published
- 2016-01
- Volume
- 389
- Pages
- 214-224
- ISSN
- 0022-5193 (ISSN-L)
- PMC
- PMC4678146
- OpenAlex
- W2141312574
- Cited by
- 175
- References
- 134
- Citations by year
- 2026: 10 · 2025: 13 · 2024: 14 · 2023: 25 · 2022: 26 · 2021: 22 · 2020: 22 · 2019: 15 · 2018: 13 · 2017: 11 · 2016: 4
- FWCI
- 4.59
- Type
- journal article
- Language
- en
- Open access
- hybrid
- doi.org
- Locations
- Journal of Theoretical Biology (publishedVersion, cc-by)
- PubMed Central (publishedVersion, cc-by)
- PubMed (publishedVersion)
- White Rose Research Online (University of Leeds, The University of Sheffield, University of York) (acceptedVersion)
- UCL Discovery (University College London) (submittedVersion)
- Funders
- BBSRC Research Development Fellowship (BB/G023395/1)
- Topics
- Life Sciences › Immunology and Microbiology › Immunology › T-cell and B-cell Immunology
- Physical Sciences › Computer Science › Artificial Intelligence › Artificial Immune Systems Applications
- Life Sciences › Biochemistry, Genetics and Molecular Biology › Genetics › Evolution and Genetic Dynamics
- Keywords
- T cell clonotypes, T cell receptor repertoire, thymic output, naive T cells
- MeSH terms
- Algorithms, Animals, Cell Division, Computer Simulation, Homeostasis, Humans, Immunologic Memory, Models, Theoretical, Receptors, Antigen, T-Cell, Stochastic Processes, T-Lymphocytes, Thymus Gland, Mice
About these checks
Registry, retraction, Cites and statistics results are computed, not judged, with one exception: a printed reference that no index lists is read once by a model before it counts as a citation error. Claims are extracted by a model and kept only when their quote appears verbatim in the text; each cited source is then checked, with a model’s help, for whether it says what the claim relies on. Those verdicts can be wrong — read the claim’s quote and the cited source before relying on one.
Statistics and arithmetic are recomputed, not judged.
Confidence bands are shown only for fields calibrated on our annotated test set. None is calibrated yet, so no band is shown.
What counts as a claim ›How we measure confidence ›How we check this ›
Are you an author, or do you see a problem with this page? Request a review
