

The DOI matches its Crossref record; 48 of the 48 references it cites were found in a registry or an index.
Obesogenic memory can confer long-term increases in adipose tissue but not liver inflammation and insulin resistance after weight loss
Open accessAbstract
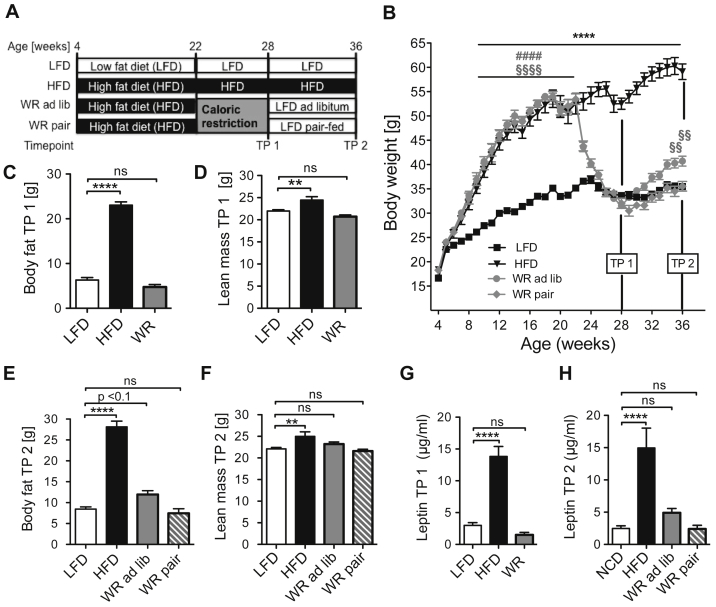
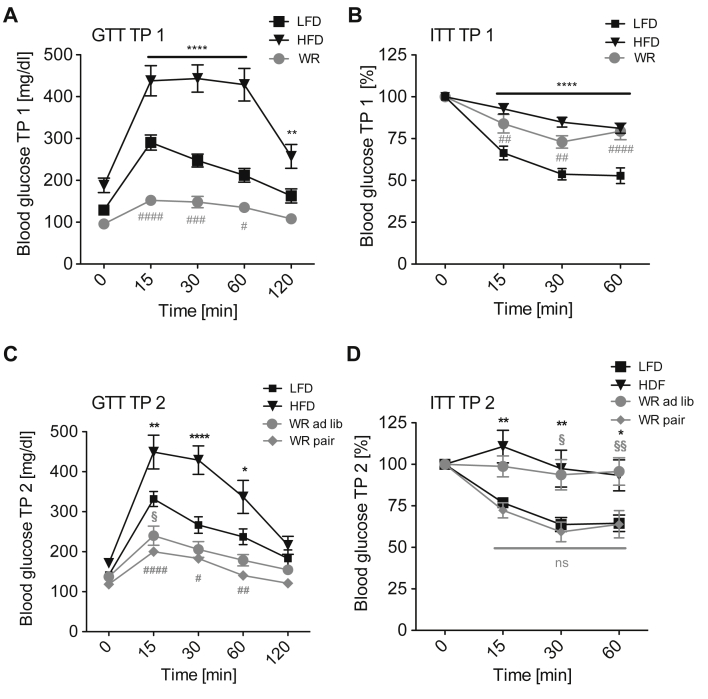
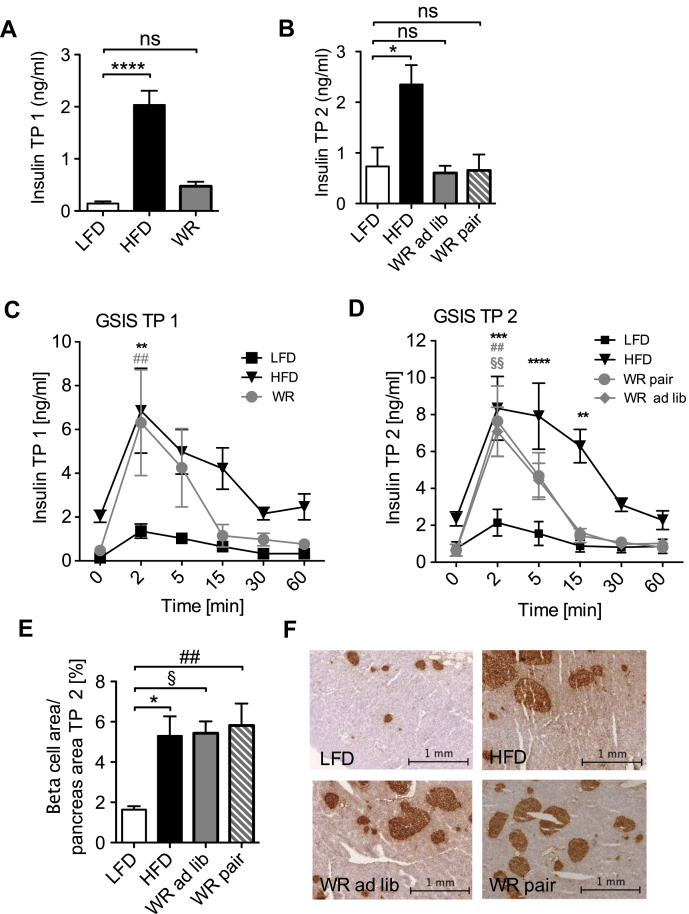
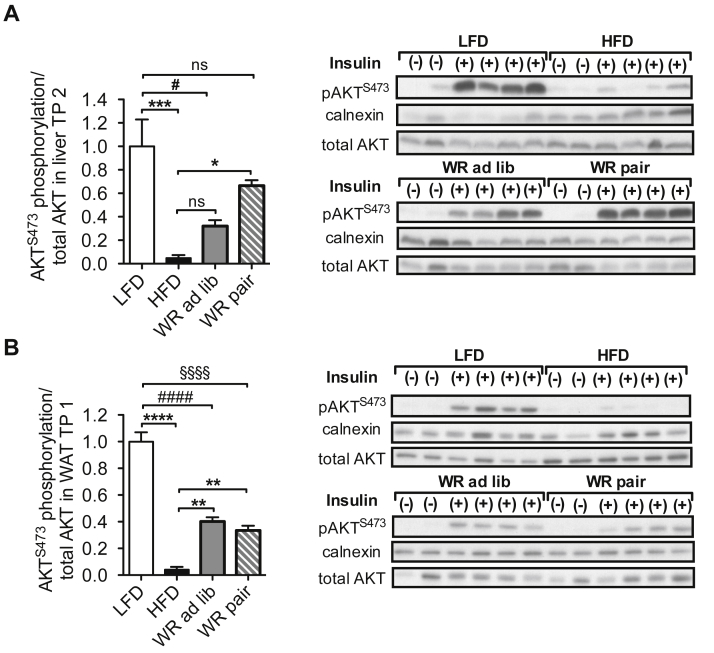
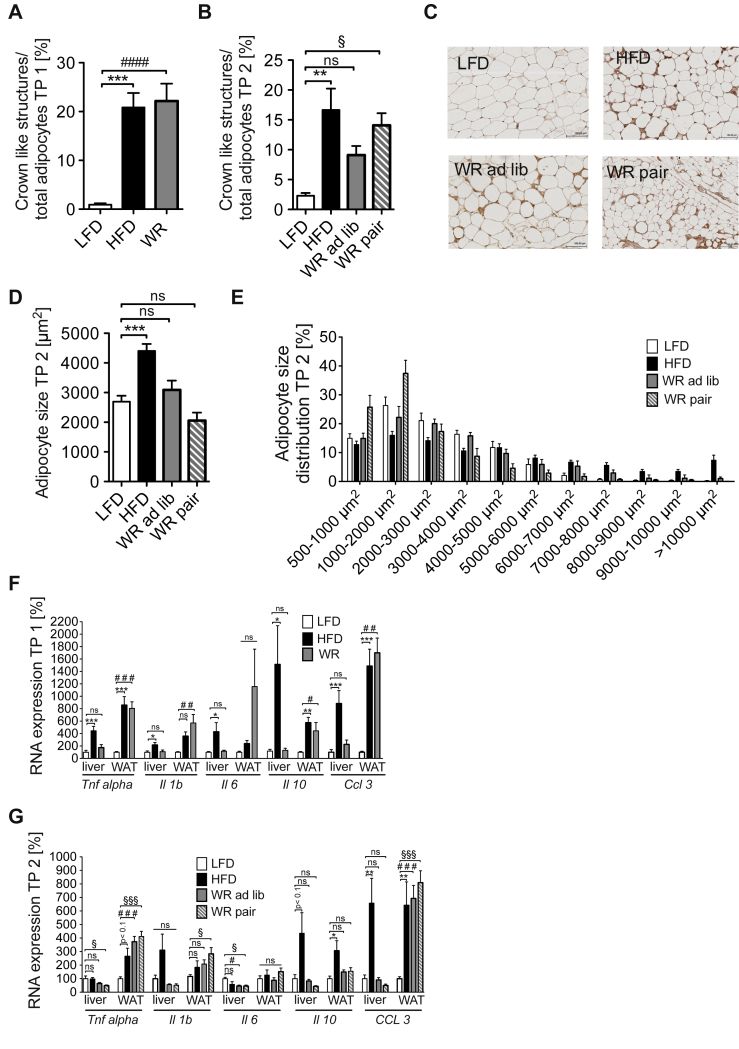
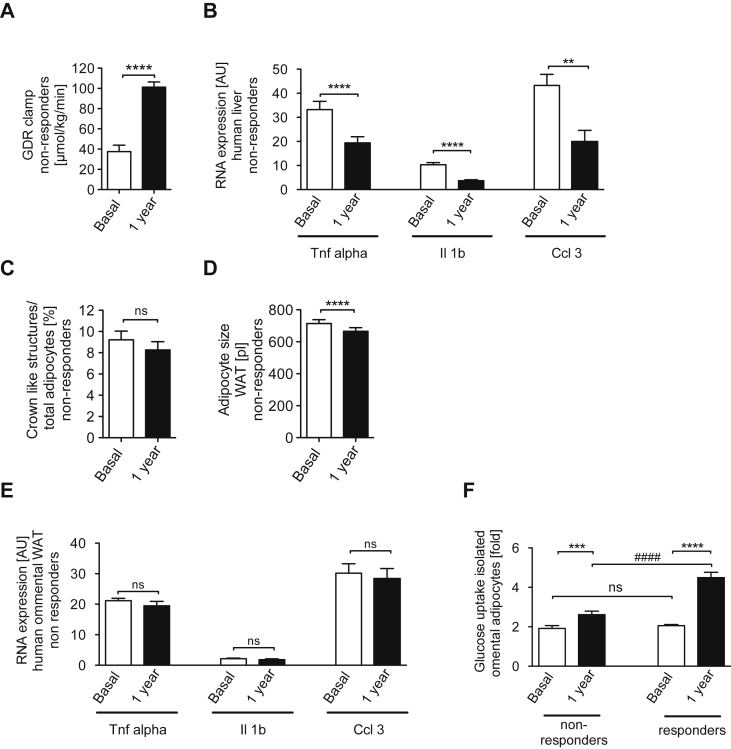
OBJECTIVE: Obesity represents a major risk factor for the development of type 2 diabetes mellitus, atherosclerosis and certain cancer entities. Treatment of obesity is hindered by the long-term maintenance of initially reduced body weight, and it remains unclear whether all pathologies associated with obesity are fully reversible even upon successfully maintained weight loss. METHODS: We compared high fat diet-fed, weight reduced and lean mice in terms of body weight development, adipose tissue and liver insulin sensitivity as well as inflammatory gene expression. Moreover, we assessed similar parameters in a human cohort before and after bariatric surgery. RESULTS: Compared to lean animals, mice that demonstrated successful weight reduction showed increased weight gain following exposure to ad libitum control diet. However, pair-feeding weight-reduced mice with lean controls efficiently stabilized body weight, indicating that hyperphagia was the predominant cause for the observed weight regain. Additionally, whereas glucose tolerance improved rapidly after weight loss, systemic insulin resistance was retained and ameliorated only upon prolonged pair-feeding. Weight loss enhanced insulin action and resolved pro-inflammatory gene expression exclusively in the liver, whereas visceral adipose tissue displayed no significant improvement of metabolic and inflammatory parameters compared to obese mice. Similarly, bariatric surgery in humans (n = 55) resulted in massive weight reduction, improved hepatic inflammation and systemic glucose homeostasis, while adipose tissue inflammation remained unaffected and adipocyte-autonomous insulin action only exhibit minor improvements in a subgroup of patients (42%). CONCLUSIONS: These results demonstrate that although sustained weight loss improves systemic glucose homeostasis, primarily through improved inflammation and insulin action in liver, a remarkable obesogenic memory can confer long-term increases in adipose tissue inflammation and insulin resistance in mice as well as in a significant subpopulation of obese patients.
Overview
The claims and statistics of this paper haven’t been checked yet.
Run the check — free, no account needed. It reads the open-access text and checks the sources it cites.
Integrity signals
Registry
Cites
Statistics
Figures
Verification
Claims the paper makes
The claims and statistics of this paper haven’t been checked yet.
Run the check — free, no account needed. It reads the open-access text and checks the sources it cites.
Claims other papers make about this one
Each is checked against this paper’s own text: does it say what the citing paper says it does?
In the citing paper
“Moreover, others have shown that 12 months after bariatric surgery, AT inflammation remained elevated in approximately 40% of patients (117).”
From The ominous triad of adipose tissue dysfunction: inflammation, fibrosis, and impaired angiogenesis. (2017) · cites this paper as [117]
Self-check
Percentages, sums and reported differences re-computed from the paper’s own numbers.
The self-check needs the paper’s full text.
Citations
Cites
Tuomilehto, J., Lindström, J., Eriksson, J. G., Valle, T. T., Hämäläinen, H., Ilanne-Parikka, P., Keinänen-Kiukaanniemi, S., Laakso, M., Louheranta, A., Rastas, M., et al. (2001) · New England Journal of Medicine · doi:10.1056/nejm200105033441801 · Cited by 10,873
Xu, H., Barnes, G. T., Yang, Q., Tan, G., Yang, D., Chou, C. J., Sole, J., Nichols, A., Ross, J. S., Tartaglia, L. A., et al. (2003) · Journal of Clinical Investigation · doi:10.1172/jci200319451 · Cited by 6,760
Mechanisms linking obesity to insulin resistance and type 2 diabetes
Kahn, S. E., Hull, R. L., & Utzschneider, K. M. (2006) · Nature · doi:10.1038/nature05482 · Cited by 5,448
Finucane, M. M., Stevens, G. A., Cowan, M. J., Danaei, G., Lin, J. K., Paciorek, C. J., Singh, G. M., Gutierrez, H. R., Lu, Y., Bahalim, A. N., et al. (2011) · The Lancet · doi:10.1016/s0140-6736(10)62037-5 · Cited by 4,050 · cited 1×
“Obesity is a major health problem with increasing prevalence around the world [1,2].”
BackgroundCardiovascular effects of intensive lifestyle intervention in type 2 diabetes
The Look AHEAD Research Group (2013) · New England Journal of Medicine · doi:10.1056/nejmoa1212914 · Cited by 2,908
Weight Loss with a Low-Carbohydrate, Mediterranean, or Low-Fat Diet
Shai, I., Schwarzfuchs, D., Henkin, Y., Shahar, D. R., Witkow, S., Greenberg, I., Golan, R., Fraser, D., Bolotin, A., Vardi, H., et al. (2008) · New England Journal of Medicine · doi:10.1056/nejmoa0708681 · Cited by 2,143
Self-citationChanges in Energy Expenditure Resulting from Altered Body Weight
Leibel, R. L., Rosenbaum, M., & Hirsch, J. (1995) · New England Journal of Medicine · doi:10.1056/nejm199503093321001 · Cited by 2,012
Comparison of Weight-Loss Diets with Different Compositions of Fat, Protein, and Carbohydrates
Sacks, F. M., Bray, G. A., Carey, V. J., Smith, S. R., Ryan, D. H., Anton, S. D., McManus, K., Champagne, C. M., Bishop, L. M., Laranjo, N., et al. (2009) · New England Journal of Medicine · doi:10.1056/nejmoa0804748 · Cited by 1,966 · cited 1×
“composition is used during caloric restriction, as long as weight reduction can be achieved [10,11].”
BackgroundIKK-β links inflammation to obesity-induced insulin resistance
Arkan, M. C., Hevener, A. L., Greten, F. R., Maeda, S., Li, Z.-W., Long, J. M., Wynshaw-Boris, A., Poli, G., Olefsky, J., & Karin, M. (2005) · Nature Medicine · doi:10.1038/nm1185 · Cited by 1,773
Cause-Specific Excess Deaths Associated With Underweight, Overweight, and Obesity
Flegal, K. M., Graubard, B. I., Williamson, D. F., & Gail, M. H. (2007) · JAMA · doi:10.1001/jama.298.17.2028 · Cited by 1,542 · cited 1×
“The increased mortality can mainly be attributed to obesityassociated diseases such as type 2 diabetes mellitus (T2DM), cardiovascular disease, and some types of cancer [4].”
Background
Cited by
Sorted by citations
Adipose tissue inflammation and metabolic dysfunction in obesity
Kawai, T., Autieri, M. V., & Scalia, R. (2021) · American Journal of Physiology-Cell Physiology · doi:10.1152/ajpcell.00379.2020 · Cited by 1,947
Adipose tissue dysfunction as determinant of obesity-associated metabolic complications
Longo, M., Zatterale, F., Naderi, J., Parrillo, L., Formisano, P., Raciti, G. A., Beguinot, F., & Miele, C. (2019) · International Journal of Molecular Sciences · doi:10.3390/ijms20092358 · Cited by 1,575
“A sustained weight loss has been shown to ameliorate systemic glucose homeostasis by improving inflammation and insulin action in the liver [101].”
BackgroundAdapting to obesity with adipose tissue inflammation
Reilly, S. M., & Saltiel, A. R. (2017) · Nature Reviews Endocrinology · doi:10.1038/nrendo.2017.90 · Cited by 1,204
Western Diet and the Immune System: An Inflammatory Connection
Christ, A., Lauterbach, M., & Latz, E. (2019) · Immunity · doi:10.1016/j.immuni.2019.09.020 · Cited by 907
The ominous triad of adipose tissue dysfunction: inflammation, fibrosis, and impaired angiogenesis.
Crewe, C., An, Y. A., & Scherer, P. E. (2017) · Journal of Clinical Investigation · doi:10.1172/jci88883 · Cited by 732
“Moreover, others have shown that 12 months after bariatric surgery, AT inflammation remained elevated in approximately 40% of patients (117).”
Metadata
- Authors
- Schmitz, J., Evers, N., Awazawa, M., Nicholls, H. T., Brönneke, H. S., Dietrich, A., Mauer, J., Blüher, M., & Brüning, J. C.
- Affiliations
- University of Cologne (DE)
- Leipzig University (DE)
- Corresponding author
- Brüning, J.C.
- Venue
- Molecular Metabolism
- Publisher
- Elsevier BV
- Published
- 2016-05
- Volume
- 5
- Issue
- 5
- Pages
- 328-339
- ISSN
- 2212-8778 (ISSN-L)
- PMC
- PMC4837291
- OpenAlex
- W2239531983
- Cited by
- 148
- References
- 48
- Citations by year
- 2026: 22 · 2025: 17 · 2024: 17 · 2023: 16 · 2022: 13 · 2021: 14 · 2020: 15 · 2019: 12 · 2018: 8 · 2017: 10 · 2016: 4
- FWCI
- 10.62
- Type
- journal article
- Language
- en
- Open access
- gold
- doi.org
- Licence
- Locations
- Molecular Metabolism (publishedVersion, cc-by-nc-nd)
- Europe PMC (PubMed Central) (publishedVersion, cc-by-nc-nd)
- PubMed Central (publishedVersion, cc-by-nc-nd)
- PubMed (publishedVersion)
- Kölner Universitäts PublikationsServer (Universität zu Köln) (publishedVersion)
- DOAJ (DOAJ: Directory of Open Access Journals) (submittedVersion, cc-by-sa)
- MPG.PuRe (Max Planck Society) (submittedVersion)
- Topics
- Health Sciences › Medicine › Endocrinology, Diabetes and Metabolism › Adipokines, Inflammation, and Metabolic Diseases
- Health Sciences › Medicine › Surgery › Bariatric Surgery and Outcomes
- Health Sciences › Medicine › Physiology (medical) › Adipose Tissue and Metabolism
- Keywords
- weight regain, weight loss, insulin resistance, liver inflammation, adipose tissue inflammation, hyperphagia, pair feeding, bariatric surgery, glucose homeostasis, type 2 diabetes, visceral adipose tissue, high-fat diet
About these checks
Registry, retraction, Cites and statistics results are computed, not judged, with one exception: a printed reference that no index lists is read once by a model before it counts as a citation error. Claims are extracted by a model and kept only when their quote appears verbatim in the text; each cited source is then checked, with a model’s help, for whether it says what the claim relies on. Those verdicts can be wrong — read the claim’s quote and the cited source before relying on one.
Statistics and arithmetic are recomputed, not judged.
Confidence bands are shown only for fields calibrated on our annotated test set. None is calibrated yet, so no band is shown.
What counts as a claim ›How we measure confidence ›How we check this ›
Are you an author, or do you see a problem with this page? Request a review
