

The DOI matches its Crossref record; 59 of the 60 references it cites were found in a registry or an index.
Microbiome profiling reveals gut dysbiosis in a transgenic mouse model of Huntington's disease
Open accessAbstract
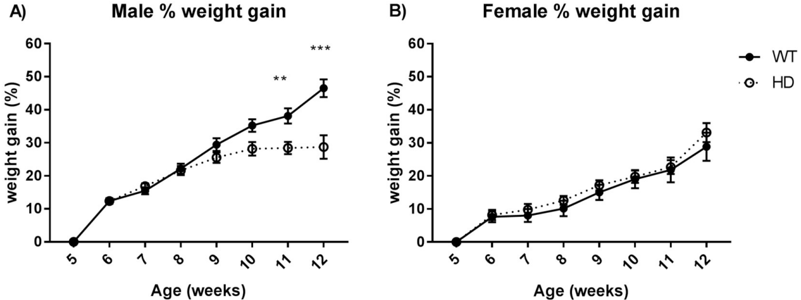
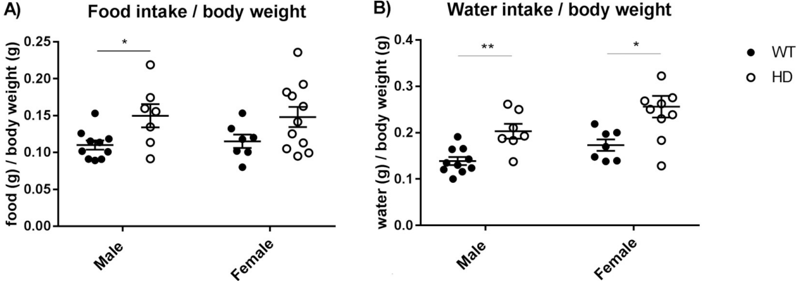
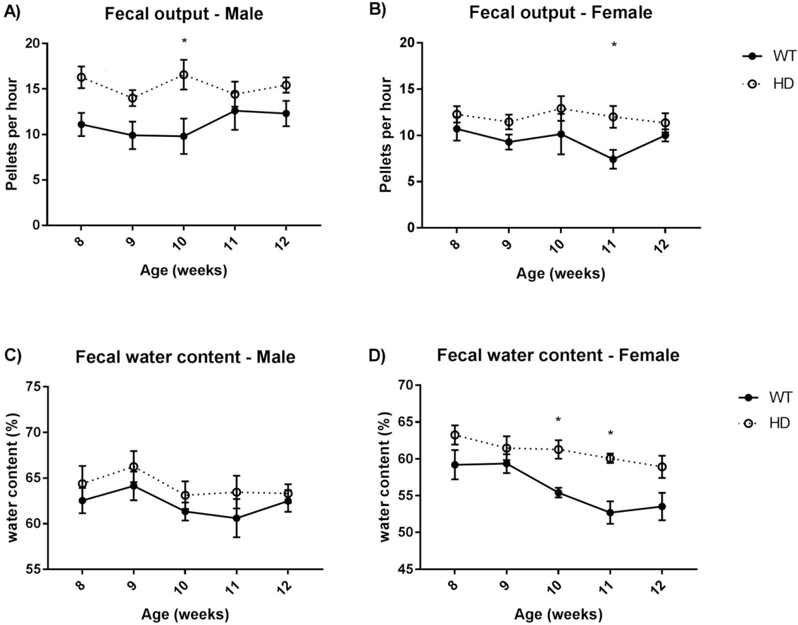
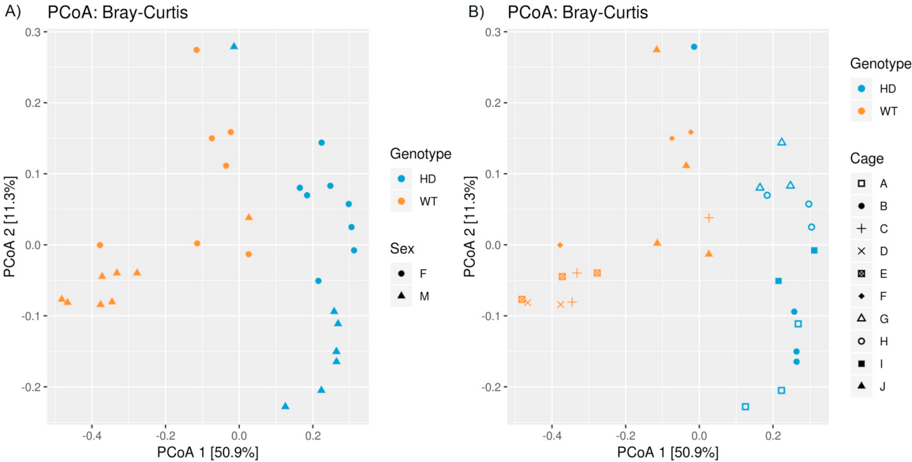
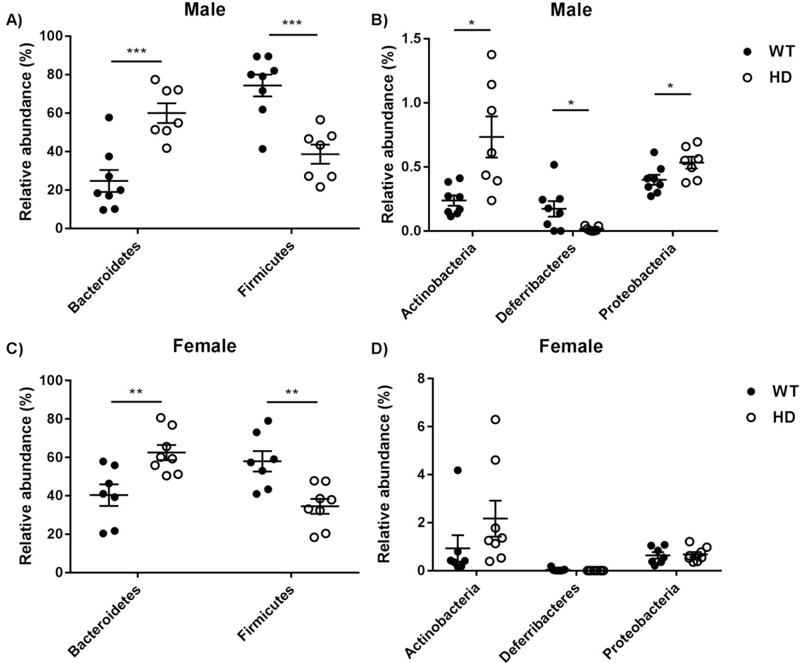
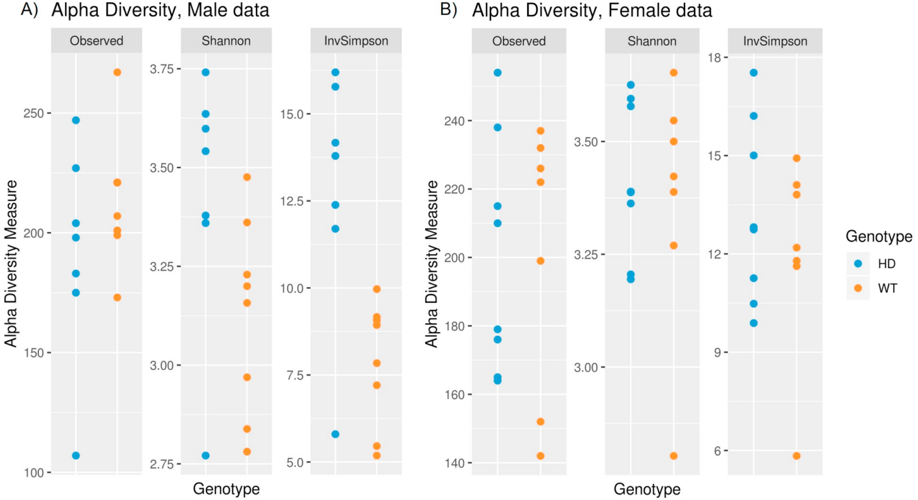
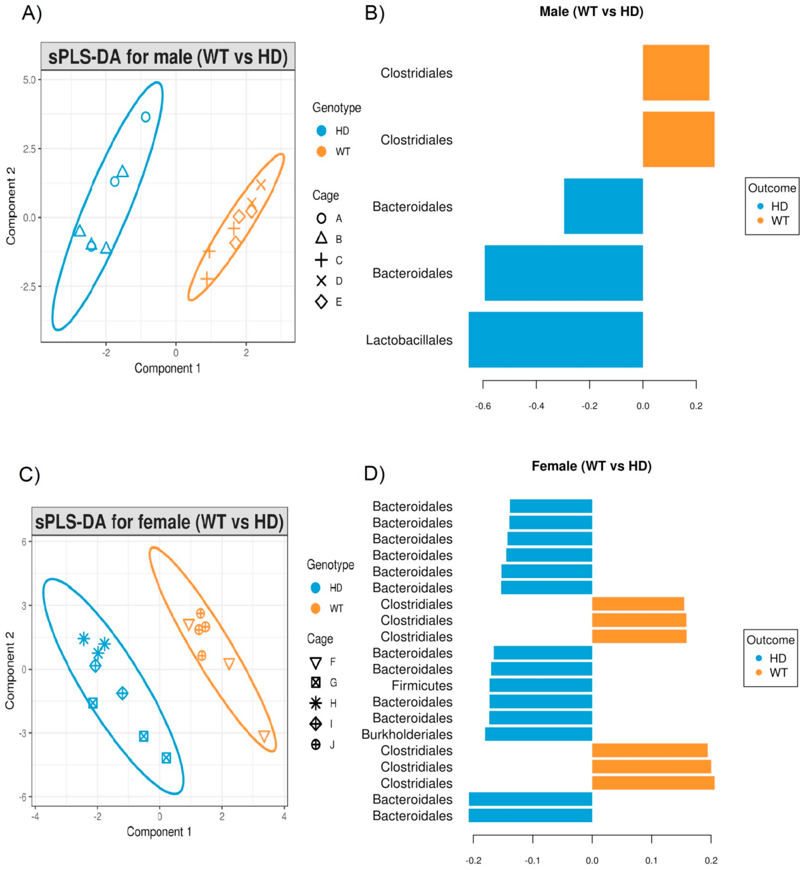
Huntington's disease (HD) is a progressive neurodegenerative disorder caused by a trinucleotide repeat expansion in the huntingtin (HTT) gene, which is expressed ubiquitously throughout the brain and peripheral tissues. Whilst the focus of much research has been on the cognitive, psychiatric and motor symptoms of HD, the extent of peripheral pathology and its potential impact on central symptoms has been less intensely explored. Disruption of the gastrointestinal microbiome (gut dysbiosis) has been recently reported in a number of neurological and psychiatric disorders, and therefore we hypothesized that it might also occur in HD. We have used 16S rRNA amplicon sequencing to characterize the gut microbiome in the R6/1 transgenic mouse model of HD, relative to littermate wild-type controls. We report that there is a significant difference in microbiota composition in HD mice at 12 weeks of age. Specifically, we observed an increase in Bacteriodetes and a proportional decrease in Firmicutes in the HD gut microbiome. In addition, we observed an increase in microbial diversity in male HD mice, compared to wild-type controls, but no differences in diversity were observed in female HD mice. The gut dysbiosis observed coincided with impairment in body weight gain despite higher food intake as well as motor deficits at 12 weeks of age. Gut dysbiosis was also associated with a change in the gut microenvironment, as we observed higher fecal water content in HD mice at 12 weeks of age. This study provides the first evidence of gut dysbiosis in HD.
Overview
The claims and statistics of this paper haven’t been checked yet.
Run the check — free, no account needed. It reads the open-access text and checks the sources it cites.
Integrity signals
Registry
Cites
Statistics
Figures
Verification
Claims the paper makes
The claims and statistics of this paper haven’t been checked yet.
Run the check — free, no account needed. It reads the open-access text and checks the sources it cites.
Claims other papers make about this one
Each is checked against this paper’s own text: does it say what the citing paper says it does?
In the citing paper
“Moreover, a higher relative abundance of Bacteroidetes and a lower relative abundance of Firmicutes were reported in both R6/1 and R6/2 mice, as compared to WT mice.235,236”
From Microbiota–gut–brain axis and its therapeutic applications in neurodegenerative diseases (2024) · cites this paper as [235]
In the citing paper
“However, the study did not observe an increase in Bacteroidetes and a reduction in Firmicutes, as reported in both R6/1 and R6/2 mice.235,236”
From Microbiota–gut–brain axis and its therapeutic applications in neurodegenerative diseases (2024) · cites this paper as [235]
In the citing paper
“A notable difference in gut microbiota composition was observed between R6/1 mice and wild-type (WT) mice at 12 weeks of age (early disease stage), which coincided with the manifestation of motor deficits and weight loss.235”
From Microbiota–gut–brain axis and its therapeutic applications in neurodegenerative diseases (2024) · cites this paper as [235]
Self-check
Percentages, sums and reported differences re-computed from the paper’s own numbers.
The self-check needs the paper’s full text.
Citations
Cites
DADA2: High–resolution sample inference from Illumina amplicon data
Callahan, B. J., McMurdie, P. J., Rosen, M. J., Han, A. W., Johnson, A. J. A., & Holmes, S. P. (2016) · Nature Methods · doi:10.1038/nmeth.3869 · Cited by 35,698
QIIME allows analysis of high-throughput community sequencing data
Caporaso, J. G., Kuczynski, J., Stombaugh, J., Bittinger, K., Bushman, F. D., Costello, E. K., Fierer, N., Peña, A. G., Goodrich, J. K., Gordon, J. I., et al. (2010) · Nature Methods · doi:10.1038/nmeth.f.303 · Cited by 34,887
FastTree 2 – Approximately Maximum-Likelihood Trees for Large Alignments
Price, M. N., Dehal, P. S., & Arkin, A. P. (2010) · PLoS ONE · doi:10.1371/journal.pone.0009490 · Cited by 14,894
A new method for non-parametric multivariate analysis of variance
Anderson, M. J. (2001) · Austral Ecology · doi:10.1111/j.1442-9993.2001.01070.pp.x · Cited by 13,828
An obesity-associated gut microbiome with increased capacity for energy harvest
Turnbaugh, P. J., Ley, R. E., Mahowald, M. A., Magrini, V., Mardis, E. R., & Gordon, J. I. (2006) · Nature · doi:10.1038/nature05414 · Cited by 12,444
Kessler, R. C. (1994) · Archives of General Psychiatry · doi:10.1001/archpsyc.1994.03950010008002 · Cited by 12,370
Greengenes, a Chimera-Checked 16S rRNA Gene Database and Workbench Compatible with ARB
DeSantis, T. Z., Hugenholtz, P., Larsen, N., Rojas, M., Brodie, E. L., Keller, K., Huber, T., Dalevi, D., Hu, P., & Andersen, G. L. (2006) · Applied and Environmental Microbiology · doi:10.1128/aem.03006-05 · Cited by 10,891
Predictive functional profiling of microbial communities using 16S rRNA marker gene sequences
Langille, M. G. I., Zaneveld, J., Caporaso, J. G., McDonald, D., Knights, D., Reyes, J. A., Clemente, J. C., Burkepile, D. E., Vega Thurber, R. L., Knight, R., et al. (2013) · Nature Biotechnology · doi:10.1038/nbt.2676 · Cited by 9,116
MACDONALD, M. (1993) · Cell · doi:10.1016/0092-8674(93)90585-e · Cited by 8,366
VEGAN, a package of R functions for community ecology
Dixon, P. M. (2003) · Journal of Vegetation Science · doi:10.1111/j.1654-1103.2003.tb02228.x · Cited by 7,052
Cited by
Sorted by citations
Cryan, J. F., O'Riordan, K. J., Cowan, C. S. M., Sandhu, K. V., Bastiaanssen, T. F. S., Boehme, M., Codagnone, M. G., Cussotto, S., Fulling, C., Golubeva, A. V., et al. (2019) · Physiological Reviews · doi:10.1152/physrev.00018.2018 · Cited by 5,286
The gut microbiome in neurological disorders
Cryan, J. F., O'Riordan, K. J., Sandhu, K., Peterson, V., & Dinan, T. G. (2020) · The Lancet Neurology · doi:10.1016/s1474-4422(19)30356-4 · Cited by 1,336
Microbiota–gut–brain axis and its therapeutic applications in neurodegenerative diseases
Loh, J. S., Mak, W. Q., Tan, L. K. S., Ng, C. X., Chan, H. H., Yeow, S. H., Foo, J. B., Ong, Y. S., How, C. W., & Khaw, K. Y. (2024) · Signal Transduction and Targeted Therapy · doi:10.1038/s41392-024-01743-1 · Cited by 1,193
Microbiota-Brain-Gut Axis and Neurodegenerative Diseases
Quigley, E. M. M. (2017) · Current Neurology and Neuroscience Reports · doi:10.1007/s11910-017-0802-6 · Cited by 804
Antibiotics, gut microbiota, and Alzheimer’s disease
Angelucci, F., Cechova, K., Amlerova, J., & Hort, J. (2019) · Journal of Neuroinflammation · doi:10.1186/s12974-019-1494-4 · Cited by 454
Kanmani, S., & Koo, B. (2020) · International Journal of Molecular Sciences · doi:10.3390/ijms21207551 · Cited by 392
Gubert, C., Kong, G., Renoir, T., & Hannan, A. J. (2019) · Neurobiology of Disease · doi:10.1016/j.nbd.2019.104621 · Cited by 387
Self-citationMicrobiota medicine: towards clinical revolution
Gebrayel, P., Nicco, C., Khodor, S. A., Biliński, J., Caselli, E., Comelli, E. M., Egert, M., Giaroni, C., Karpiński, T. M. M., Łoniewski, I., et al. (2022) · Journal of Translational Medicine · doi:10.1186/s12967-022-03296-9 · Cited by 307
The Microbiome as a Modifier of Neurodegenerative Disease Risk
Fang, P., Kazmi, S. A., Jameson, K. G., & Hsiao, E. Y. (2020) · Cell Host & Microbe · doi:10.1016/j.chom.2020.06.008 · Cited by 226
Chidambaram, S. B., Essa, M. M., Rathipriya, A. G., Bishir, M., Ray, B., Mahalakshmi, A. M., Tousif, A. H., Sakharkar, M. K., Kashyap, R. S., Friedland, R. P., et al. (2022) · Pharmacology & Therapeutics · doi:10.1016/j.pharmthera.2021.107988 · Cited by 204
Wasser, C. I., Mercieca, E.-C., Kong, G., Hannan, A. J., McKeown, S. J., Glikmann-Johnston, Y., & Stout, J. C. (2020) · Brain Communications · doi:10.1093/braincomms/fcaa110 · Cited by 198
Self-citationKabir, M. T., Rahman, M. H., Shah, M., Jamiruddin, M. R., Basak, D., Al‐Harrasi, A., Bhatia, S., Ashraf, G. M., Najda, A., El-kott, A. F., et al. (2022) · Biomedicine & Pharmacotherapy · doi:10.1016/j.biopha.2021.112610 · Cited by 191
Kandpal, M., Indari, O., Baral, B., Jakhmola, S., Tiwari, D., Bhandari, V., Pandey, R. K., Bala, K., Sonawane, A., & Jha, H. C. (2022) · Metabolites · doi:10.3390/metabo12111064 · Cited by 177
Implications of Gut Microbiota in Neurodegenerative Diseases
Zhang, H., Chen, Y., Wang, Z., Xie, G., Liu, M., Yuan, B., Chai, H., Wang, W., & Cheng, P. (2022) · Frontiers in Immunology · doi:10.3389/fimmu.2022.785644 · Cited by 161
Enteric nervous system: the bridge between the gut microbiota and neurological disorders
Geng, Z.-H., Zhu, Y., Li, Q.-L., Zhao, C., & Zhou, P.-H. (2022) · Frontiers in Aging Neuroscience · doi:10.3389/fnagi.2022.810483 · Cited by 144
Managing batch effects in microbiome data
Wang, Y., & Cao, K. L. (2019) · Briefings in Bioinformatics · doi:10.1093/bib/bbz105 · Cited by 137
Self-citationThe Relationship Between the Gut Microbiome and Neurodegenerative Diseases
Zhu, X., Li, B., Lou, P., Dai, T., Chen, Y., Zhuge, A., Yuan, Y., & Li, L. (2021) · Neuroscience Bulletin · doi:10.1007/s12264-021-00730-8 · Cited by 137
Current and Possible Future Therapeutic Options for Huntington’s Disease
Ferguson, M. W., Kennedy, C. J., Palpagama, T. H., Waldvogel, H. J., Faull, R. L. M., & Kwakowsky, A. (2022) · Journal of Central Nervous System Disease · doi:10.1177/11795735221092517 · Cited by 133
Bicknell, B. T., Liebert, A. D., Borody, T. J., Herkes, G., McLachlan, C. S., & Kiat, H. (2023) · International Journal of Molecular Sciences · doi:10.3390/ijms24119577 · Cited by 135
Altered Gut Microbiota Related to Inflammatory Responses in Patients With Huntington’s Disease
Du, G., Dong, W., Yang, Q., Yu, X., Ma, J., Gu, W., & Huang, Y. M. (2021) · Frontiers in Immunology · doi:10.3389/fimmu.2020.603594 · Cited by 126
Kong, G., Ellul, S., Narayana, V. K., Kanojia, K., Tran, H., Li, S., Renoir, T., Cao, K. L., & Hannan, A. J. (2020) · Neurobiology of Disease · doi:10.1016/j.nbd.2020.105199 · Cited by 111
Self-citationPraveenraj, S. S., Sonali, S., Anand, N., Hediyal, T. A., Vichitra, C., Kalyan, M., Kanna, P. V., Chandana, K. A., Paneyala, S., Mahalakshmi, A. M., et al. (2022) · Molecular Neurobiology · doi:10.1007/s12035-022-02990-5 · Cited by 116
Increased intestinal permeability and gut dysbiosis in the R6/2 mouse model of Huntington’s disease
Stan, T. L., Soylu-Kucharz, R., Burleigh, S., Prykhodko, O., Cao, L., Franke, N., Sjögren, M., Haikal, C., Hållenius, F., & Björkqvist, M. (2020) · Scientific Reports · doi:10.1038/s41598-020-75229-9 · Cited by 101
Understanding the host-microbe interactions using metabolic modeling
Jansma, J., & Aidy, S. E. (2021) · Microbiome · doi:10.1186/s40168-020-00955-1 · Cited by 106
Bacterial neurotoxic metabolites in multiple sclerosis cerebrospinal fluid and plasma
Ntranos, A., Park, H.-J., Wentling, M., Tolstikov, V., Amatruda, M., Inbar, B., Kim‐Schulze, S., Frazier, C., Button, J., Kiebish, M. A., et al. (2021) · Brain · doi:10.1093/brain/awab320 · Cited by 108
Role of Gut Microbiota in Neurological Disorders and Its Therapeutic Significance
Tiwari, P., Dwivedi, R., Bansal, M., Tripathi, M., & Dada, R. (2023) · Journal of Clinical Medicine · doi:10.3390/jcm12041650 · Cited by 108
The microbiota–microglia axis in central nervous system disorders
Mossad, O., & Erny, D. (2020) · Brain Pathology · doi:10.1111/bpa.12908 · Cited by 98
Fecal Microbiota Transplantation: A New Therapeutic Attempt from the Gut to the Brain
Xu, H., Huang, H., Zhou, Y., Zhao, H., Xu, J., Shou, D., Liu, Y., Zhou, Y., & Nie, Y. (2021) · Gastroenterology Research and Practice · doi:10.1155/2021/6699268 · Cited by 100
Brain modulation by the gut microbiota: From disease to therapy
Mitra, S., Dash, R., Nishan, A. A., Habiba, S. U., & Moon, I. S. (2023) · Journal of Advanced Research · doi:10.1016/j.jare.2022.12.001 · Cited by 91
The Microbiota–Gut–Brain Axis and Neurological Disorders: A Comprehensive Review
Nakhal, M. M., Yassin, L. K., Alyaqoubi, R., Saeed, S., Alderei, A., Alhammadi, A., Alshehhi, M., Almehairbi, A., Houqani, S. A., BaniYas, S., et al. (2024) · Life · doi:10.3390/life14101234 · Cited by 136
Chen, Y., Li, Y., Fan, Y., Chen, S., Chen, L., Chen, Y., & Chen, Y. (2024) · Gut Microbes · doi:10.1080/19490976.2024.2302310 · Cited by 92
Bile acids and neurological disease
Hurley, M. J., Bates, R., Macnaughtan, J., & Schapira, A. H. V. (2022) · Pharmacology & Therapeutics · doi:10.1016/j.pharmthera.2022.108311 · Cited by 86
Gut Microbiota: Implications in Alzheimer’s Disease
He, Y., Li, B., Sun, D., & Chen, S. (2020) · Journal of Clinical Medicine · doi:10.3390/jcm9072042 · Cited by 82
Peng, W., Yi, P., Yang, J., Xu, P., Wang, Y., Zhang, Z., Huang, S., Wang, Z., & Zhang, C. (2018) · Aging · doi:10.18632/aging.101693 · Cited by 81
Gut–Brain Axis as a Pathological and Therapeutic Target for Neurodegenerative Disorders
Toledo, A. R. L., Monroy, G. R., Salazar, F. E., Lee, J.-Y., Jain, S., Yadav, H., & Borlongan, C. V. (2022) · International Journal of Molecular Sciences · doi:10.3390/ijms23031184 · Cited by 83
Altered Cholesterol Homeostasis in Huntington’s Disease
Kacher, R., Mounier, C., Caboche, J., & Bétuing, S. (2022) · Frontiers in Aging Neuroscience · doi:10.3389/fnagi.2022.797220 · Cited by 74
Gubert, C., Choo, J. M., Love, C. J., Kodikara, S., Masson, B. A., Liew, J. J. M., Wang, Y., Kong, G., Narayana, V. K., Renoir, T., et al. (2022) · Brain Communications · doi:10.1093/braincomms/fcac205 · Cited by 71
Self-citationGut microbiome and cardiovascular disease
Zhao, Y., & Wang, Z. (2020) · Current Opinion in Cardiology · doi:10.1097/hco.0000000000000720 · Cited by 70
Liu, X., Liu, Y., Liu, J., Zhang, H., Shan, C., Guo, Y., Gong, X., Cui, M., Li, X., & Tang, M. (2023) · Neural Regeneration Research · doi:10.4103/1673-5374.382223 · Cited by 75
Radulescu, C. I., Garcia‐Miralles, M., Sidik, H., Bardile, C. F., Yusof, N. A. B. M., Lee, H. U., Ho, E. X. P., Chu, C. W., Layton, E., Low, D., et al. (2019) · Neurobiology of Disease · doi:10.1016/j.nbd.2019.02.011 · Cited by 68
Cheng, W., Ho, J. Y. S., & Chang, R. C. (2022) · Ageing Research Reviews · doi:10.1016/j.arr.2022.101620 · Cited by 71
Systemic manifestation and contribution of peripheral tissues to Huntington’s disease pathogenesis
Chuang, C.-L., & Demontis, F. (2021) · Ageing Research Reviews · doi:10.1016/j.arr.2021.101358 · Cited by 66
Sex and Gender Differences in Alzheimer’s Disease: Genetic, Hormonal, and Inflammation Impacts
Kolahchi, Z., Henkel, N., Eladawi, M. A., Villarreal, E. C., Kandimalla, P., Lundh, A., McCullumsmith, R. E., & Cuevas, E. (2024) · International Journal of Molecular Sciences · doi:10.3390/ijms25158485 · Cited by 66
The microbiota–gut–brain axis in Huntington's disease: pathogenic mechanisms and therapeutic targets
Ekwudo, M. N., Gubert, C., & Hannan, A. J. (2024) · FEBS Journal · doi:10.1111/febs.17102 · Cited by 61
Self-citationTarget Dysbiosis of Gut Microbes as a Future Therapeutic Manipulation in Alzheimer’s Disease
Zhu, F., Li, C., Chu, F., Tian, X., & Zhu, J. (2020) · Frontiers in Aging Neuroscience · doi:10.3389/fnagi.2020.544235 · Cited by 59
Gut Microbiota and Neuroplasticity
Murciano-Brea, J., García-Montes, M. E., Geuna, S., & Herrera‐Rincon, C. (2021) · Cells · doi:10.3390/cells10082084 · Cited by 59
Neuroprotective Effects of Doxycycline in the R6/2 Mouse Model of Huntington’s Disease
Paldino, E., Balducci, C., Vitola, P. L., Artioli, L., D’Angelo, V., Giampà, C., Artuso, V., Forloni, G., & Fusco, F. R. (2019) · Molecular Neurobiology · doi:10.1007/s12035-019-01847-8 · Cited by 56
The pleiotropic of GLP-1/GLP-1R axis in central nervous system diseases
Zhang, L., Zhang, W., & Tian, X. (2023) · International Journal of Neuroscience · doi:10.1080/00207454.2021.1924707 · Cited by 54
Dissecting the Relationship Between Neuropsychiatric and Neurodegenerative Disorders
Gupta, R. V., Advani, D., Yadav, D., Ambasta, R. K., & Kumar, P. (2023) · Molecular Neurobiology · doi:10.1007/s12035-023-03502-9 · Cited by 61
Gut Microbiota and Alzheimer’s Disease: How to Study and Apply Their Relationship
Nguyen, N. M., Cho, J., & Lee, C.-H. (2023) · International Journal of Molecular Sciences · doi:10.3390/ijms24044047 · Cited by 60
Effects of gut microbiota on neurodegenerative diseases
Khatoon, S., Kalam, N., Rashid, S., & Bano, G. (2023) · Frontiers in Aging Neuroscience · doi:10.3389/fnagi.2023.1145241 · Cited by 55
Healthy Gut, Healthy Brain: The Gut Microbiome in Neurodegenerative Disorders
Chandra, S., Alam, M. T., Dey, J., Sasidharan, B. C. P., Ray, U., Srivastava, A. K., Gandhi, S., & Tripathi, P. P. (2020) · Current Topics in Medicinal Chemistry · doi:10.2174/1568026620666200413091101 · Cited by 50
Gene targeting techniques for Huntington’s disease
Fields, E., Vaughan, E., Tripu, D. R., Lim, I., Shrout, K., Conway, J., Salib, N., Lee, Y., Dhamsania, A., Jacobsen, M., et al. (2021) · Ageing Research Reviews · doi:10.1016/j.arr.2021.101385 · Cited by 53
Self-citationSingh, N., Singh, V., Nand, S., Mishra, V., Vamanu, E., & Singh, M. P. (2022) · Biomedicine & Pharmacotherapy · doi:10.1016/j.biopha.2022.113958 · Cited by 54
Sharma, G., Biswas, S. S., Mishra, J., Navik, U., Kandimalla, R. J. L., Reddy, P. H., Bhatti, G. K., & Bhatti, J. S. (2023) · Life Sciences · doi:10.1016/j.lfs.2023.121882 · Cited by 47
Dietary fibre confers therapeutic effects in a preclinical model of Huntington’s disease
Gubert, C., Kong, G., Costello, C., Adams, C. D., Masson, B. A., Qin, W., Choo, J. M., Narayana, V. K., Rogers, G. B., Renoir, T., et al. (2023) · Brain Behavior and Immunity · doi:10.1016/j.bbi.2023.12.023 · Cited by 45
Self-citationThe Brain–Gut–Bone Axis in Neurodegenerative Diseases: Insights, Challenges, and Future Prospects
Li, R., Miao, Z., Liu, Y., Chen, X., Wang, H., Su, J., & Chen, J. (2024) · Advanced Science · doi:10.1002/advs.202307971 · Cited by 54
Exploring the gut-brain Axis: Potential therapeutic impact of Psychobiotics on mental health
Cocean, A.-M., & Vodnar, D. C. (2024) · Progress in Neuro-Psychopharmacology and Biological Psychiatry · doi:10.1016/j.pnpbp.2024.111073 · Cited by 52
Alterations in the Gut Fungal Community in a Mouse Model of Huntington’s Disease
Kong, G., Cao, K. L., & Hannan, A. J. (2022) · Microbiology Spectrum · doi:10.1128/spectrum.02192-21 · Cited by 43
Self-citationGubert, C., Love, C. J., Kodikara, S., Mei Liew, J. J., Renoir, T., Lê Cao, K.-A., & Hannan, A. J. (2022) · iScience · doi:10.1016/j.isci.2021.103687 · Cited by 41
Self-citationMunir, M. U., Ali, S. A., Chung, K. H. K., Käkinen, A., Javed, I., & Davis, T. P. (2024) · Gut Microbes · doi:10.1080/19490976.2024.2422468 · Cited by 45
Perez, L., Scarcello, E., Ibouraadaten, S., Yakoub, Y., Leinardi, R., Ambroise, J., Bearzatto, B., Gala, J., Paquot, A., Muccioli, G. G., et al. (2021) · Food and Chemical Toxicology · doi:10.1016/j.fct.2021.112352 · Cited by 40
Why Woody got the blues: The neurobiology of depression in Huntington's disease
Gubert, C., Renoir, T., & Hannan, A. J. (2020) · Neurobiology of Disease · doi:10.1016/j.nbd.2020.104958 · Cited by 41
Self-citationvan den Brûle, S., Rappe, M., Ambroise, J., Bouzin, C., Dessy, C., Paquot, A., Muccioli, G. G., & Lison, D. (2021) · Particle and Fibre Toxicology · doi:10.1186/s12989-021-00400-7 · Cited by 40
Butyrate as a potential therapeutic agent for neurodegenerative disorders
Chakraborty, P., Gamage, H. K. A. H., & Laird, A. S. (2024) · Neurochemistry International · doi:10.1016/j.neuint.2024.105745 · Cited by 44
Gut dysbiosis and age-related neurological diseases in females
Korf, J. M., Ganesh, B. P., & McCullough, L. D. (2022) · Neurobiology of Disease · doi:10.1016/j.nbd.2022.105695 · Cited by 43
Chiu, L. S., & Anderton, R. S. (2022) · European Journal of Neuroscience · doi:10.1111/ejn.15892 · Cited by 36
Hasan, A., Scuderi, S. A., Capra, A. P., Giosa, D., Bonomo, A., Ardizzone, A., & Esposito, E. (2025) · Brain Sciences · doi:10.3390/brainsci15060654 · Cited by 38
Retinitis pigmentosa is associated with shifts in the gut microbiome
Kutsyr, O., Maestre‐Carballa, L., Gómez, M. L., Martínez‐García, M., Cuenca, N., & Lax, P. (2021) · Scientific Reports · doi:10.1038/s41598-021-86052-1 · Cited by 37
Chatterjee, A., Kumar, S., Sarkar, S. R., Halder, R., Kumari, R., Banerjee, S., & Sarkar, B. (2024) · The Journal of Nutritional Biochemistry · doi:10.1016/j.jnutbio.2024.109622 · Cited by 36
Fleischer, R., Schmid, D. W., Wasimuddin, Brändel, S. D., Rasche, A., Corman, V. M., Drosten, C., Tschapka, M., & Sommer, S. (2022) · Molecular Ecology · doi:10.1111/mec.16491 · Cited by 35
Gut microbes and host behavior: The forgotten members of the gut-microbiome
Weiner, A., Turjeman, S., & Koren, O. (2023) · Neuropharmacology · doi:10.1016/j.neuropharm.2023.109453 · Cited by 34
Metabolism in Huntington’s disease: a major contributor to pathology
Singh, A., & Agrawal, N. (2021) · Metabolic Brain Disease · doi:10.1007/s11011-021-00844-y · Cited by 34
Oligodendrocyte pathology in Huntington’s disease: from mechanisms to therapeutics
Bardile, C. F., Radulescu, C. I., & Pouladi, M. A. (2023) · Trends in Molecular Medicine · doi:10.1016/j.molmed.2023.07.010 · Cited by 38
What, When and How to Measure—Peripheral Biomarkers in Therapy of Huntington’s Disease
Przybył, Ł., Woźna, M., Kozłowska, E., & Fiszer, A. (2021) · International Journal of Molecular Sciences · doi:10.3390/ijms22041561 · Cited by 33
Nargeh, H., Aliabadi, F., Ajami, M., & Pazoki–Toroudi, H. (2021) · Journal of Agricultural and Food Chemistry · doi:10.1021/acs.jafc.1c00923 · Cited by 32
Marć, M. A., Jastrząb, R., & Mytych, J. (2022) · Nutrients · doi:10.3390/nu14193967 · Cited by 33
Gut Bacteria Regulate the Pathogenesis of Huntington’s Disease in Drosophila Model
Chongtham, A., Yoo, J. H., Chin, T. M., Akingbesote, N. D., Huda, A., Marsh, J., & Khoshnan, A. (2022) · Frontiers in Neuroscience · doi:10.3389/fnins.2022.902205 · Cited by 30
Mucosal Immunity and the Gut-Microbiota-Brain-Axis in Neuroimmune Disease
Sterling, K. G., Dodd, G. K., Alhamdi, S., Asimenios, P. G., Dagda, R. K., Meirleir, K. L. D., Hudig, D., & Lombardi, V. C. (2022) · International Journal of Molecular Sciences · doi:10.3390/ijms232113328 · Cited by 34
What the Gut Tells the Brain—Is There a Link between Microbiota and Huntington’s Disease?
Wronka, D., Karlik, A., Misiorek, J. O., & Przybył, Ł. (2023) · International Journal of Molecular Sciences · doi:10.3390/ijms24054477 · Cited by 32
A Randomized Controlled Trial of Probiotics Targeting Gut Dysbiosis in Huntington’s Disease
Wasser, C. I., Mercieca, E., Kong, G., Hannan, A. J., Allford, B., McKeown, S. J., Stout, J. C., & Glikmann‐Johnston, Y. (2023) · Journal of Huntington s Disease · doi:10.3233/jhd-220556 · Cited by 30
Self-citationThe Emerging Landscape of Natural Small-molecule Therapeutics for Huntington’s Disease
Bhat, S. A., Ahamad, S., Dar, N. J., Siddique, Y. H., & Nazir, A. (2023) · Current Neuropharmacology · doi:10.2174/1570159x21666230216104621 · Cited by 29
Inflammation and Huntington’s disease – a neglected therapeutic target?
Field, S., Curle, A. J., & Barker, R. A. (2024) · Expert Opinion on Investigational Drugs · doi:10.1080/13543784.2024.2348738 · Cited by 31
Picó, S., Parras, A., Santos‐Galindo, M., Pose‐Utrilla, J., Castro, M., Fraga, E., Hernández, I. H., Elorza, A., Anta, H., Wang, N., et al. (2021) · Science Translational Medicine · doi:10.1126/scitranslmed.abe7104 · Cited by 28
Systemic Symptoms in Huntington's Disease: A Comprehensive Review
Mehanna, R., & Jankovic, J. J. (2024) · Movement Disorders Clinical Practice · doi:10.1002/mdc3.14029 · Cited by 29
The connection between gut microbiota and its metabolites with neurodegenerative diseases in humans
Fabi, J. P. (2024) · Metabolic Brain Disease · doi:10.1007/s11011-024-01369-w · Cited by 27
Masson, B. A., Kiridena, P., Da, L., Kleeman, E. A., Reisinger, S. N., Qin, W., Davies, W. J., Muralitharan, R. R., Jama, H. A., Antonacci, S., et al. (2024) · Brain Behavior and Immunity · doi:10.1016/j.bbi.2024.09.020 · Cited by 27
Self-citationAhmed, L. A., & Al‐Massri, K. F. (2022) · Current Molecular Pharmacology · doi:10.2174/1874467215666220222105004 · Cited by 23
Cescon, M., Gambarotta, G., Calabrò, S., Cicconetti, C., Anselmi, F., Kankowski, S., Lang, L., Basic, M., Bleich, A., Bolsega, S., et al. (2024) · Gut Microbes · doi:10.1080/19490976.2024.2363015 · Cited by 25
Gut-Brain Axis Deregulation and Its Possible Contribution to Neurodegenerative Disorders
Villavicencio-Tejo, F., Olesen, M. A., Navarro, L., Calisto, N., Iribarren, C., GARCÍA, K. P., Corsini, G., & Quintanilla, R. A. (2023) · Neurotoxicity Research · doi:10.1007/s12640-023-00681-0 · Cited by 24
Classical methods and perspectives for manipulating the human gut microbial ecosystem
Avalos, J. A. J., Arrevillaga-Boni, G., González‐López, L., García-Carvajal, Z. Y., & González‐Ávila, M. (2020) · Critical Reviews in Food Science and Nutrition · doi:10.1080/10408398.2020.1724075 · Cited by 23
Marchionini, D. M., Liu, J.-P., Ambesi‐Impiombato, A., Kerker, K., Cirillo, K., Bansal, M., Mushlin, R., Brunner, D., Ramboz, S., Kwan, M. Y., et al. (2022) · JCI Insight · doi:10.1172/jci.insight.161769 · Cited by 20
Gut Microbiota as a Modifier of Huntington’s Disease Pathogenesis
Khoshnan, A. (2024) · Journal of Huntington s Disease · doi:10.3233/jhd-240012 · Cited by 24
Effect of Short Chain Fatty Acids on Age-Related Disorders
Fernandes, M. F., de Oliveira, S., Portovedo, M., Rodrigues, P. B., & Vinolo, M. A. R. (2020) · Advances in experimental medicine and biology · doi:10.1007/978-3-030-42667-5_4 · Cited by 22
Balakrishnan, R., Kang, S.-I., Lee, J. Y., Rho, Y., Kim, B.-K., & Choi, D. (2024) · Aging and Disease · doi:10.14336/ad.2024.1362 · Cited by 22
Multi-omics studies reveal ameliorating effects of physical exercise on neurodegenerative diseases
Guo, Y., Wang, S., Chao, X., Li, D., Wang, Y., Guo, Q., & Chen, T. (2022) · Frontiers in Aging Neuroscience · doi:10.3389/fnagi.2022.1026688 · Cited by 26
Zielonka, D., Witkowski, G., Puch, E. A., Leśniczak-Staszak, M., Mazur-Michałek, I., Isalan, M., & Mielcarek, M. (2020) · Frontiers in Medicine · doi:10.3389/fmed.2020.00079 · Cited by 21
Mateo, D., Marquès, M., Domingo, J. L., & Torrente, M. (2023) · American Journal of Medical Genetics Part B Neuropsychiatric Genetics · doi:10.1002/ajmg.b.32959 · Cited by 20
Metformin to treat Huntington disease: A pleiotropic drug against a multi-system disorder
Trujillo-Del Río, C., Tortajada-Pérez, J., Gómez-Escribano, A. P., Casterá, F., Peiró, C., Millán, J. M., Herrero, M. J., & Vázquez-Manrique, R. P. (2022) · Mechanisms of Ageing and Development · doi:10.1016/j.mad.2022.111670 · Cited by 19
Peng, Z., Hou, T., Yang, K., Zhang, J., Mao, Y.-H., & Hou, X. (2025) · Nutrients · doi:10.3390/nu17111769 · Cited by 21
Metadata
- Authors
- Kong, G., Cao, K.-A. L., Judd, L. M., Li, S., Renoir, T., & Hannan, A. J.
- Affiliations
- The University of Melbourne (AU)
- Corresponding author
- Hannan, Anthony J.
- Venue
- Neurobiology of Disease
- Publisher
- Elsevier BV
- Published
- 2020-02
- Volume
- 135
- Pages
- 104268
- ISSN
- 0969-9961 (ISSN-L)
- OpenAlex
- W2889638535
- Cited by
- 212
- References
- 60
- Citations by year
- 2026: 13 · 2025: 35 · 2024: 39 · 2023: 27 · 2022: 37 · 2021: 32 · 2020: 20
- FWCI
- 5.34
- Type
- journal article
- Language
- en
- Open access
- hybrid
- doi.org
- Licence
- Locations
- Neurobiology of Disease (publishedVersion, cc-by-nc-nd)
- PubMed (publishedVersion)
- DOAJ (DOAJ: Directory of Open Access Journals) (submittedVersion, cc-by-sa)
- Funders
- NHMRC (GNT1087415)
- Topics
- Life Sciences › Biochemistry, Genetics and Molecular Biology › Molecular Biology › Gut microbiota and health
- Life Sciences › Neuroscience › Cellular and Molecular Neuroscience › Genetic Neurodegenerative Diseases
- Health Sciences › Medicine › Gastroenterology › Gastrointestinal motility and disorders
- Keywords
- Huntington's disease, gut dysbiosis, gut microbiota, Bacteroidetes, Firmicutes, microbial diversity, sex differences, weight gain, motor impairment, fecal water content
- MeSH terms
- Gastrointestinal Microbiome, Huntingtin Protein, Animals, Brain, Disease Models, Animal, Huntington Disease, Male, Mice, Transgenic, Motor Activity, Nerve Tissue Proteins, Trinucleotide Repeat Expansion, Dysbiosis
About these checks
Registry, retraction, Cites and statistics results are computed, not judged, with one exception: a printed reference that no index lists is read once by a model before it counts as a citation error. Claims are extracted by a model and kept only when their quote appears verbatim in the text; each cited source is then checked, with a model’s help, for whether it says what the claim relies on. Those verdicts can be wrong — read the claim’s quote and the cited source before relying on one.
Statistics and arithmetic are recomputed, not judged.
Confidence bands are shown only for fields calibrated on our annotated test set. None is calibrated yet, so no band is shown.
What counts as a claim ›How we measure confidence ›How we check this ›
Are you an author, or do you see a problem with this page? Request a review
