Cited by 114

The DOI matches its Crossref record; 9 of the 9 references it cites were found in a registry or an index.

Non-catalytic Roles of Tet2 Are Essential to Regulate Hematopoietic Stem and Progenitor Cell Homeostasis

Ito, Kyoko, Lee, Joun, Chrysanthou, Stephanie, Zhao, Yilin, Josephs, Katherine, Sato, Hiroyo, Teruya-Feldstein, Julie, Zheng, Deyou, Dawlaty, Meelad M., Ito, Keisuke·2019·Cell Reports

Overview

The claims and statistics of this paper haven’t been checked yet.

Run the check — free, no account needed. It reads the open-access text and checks the sources it cites.

A few free checks a day · papers already verified open instantly · results are public

Integrity signals

Registry

Crossref · 10.1016/j.celrep.2019.07.094

Cites

9 of 9 references verified0 citation errors · 0 not checkable

Statistics

Figures

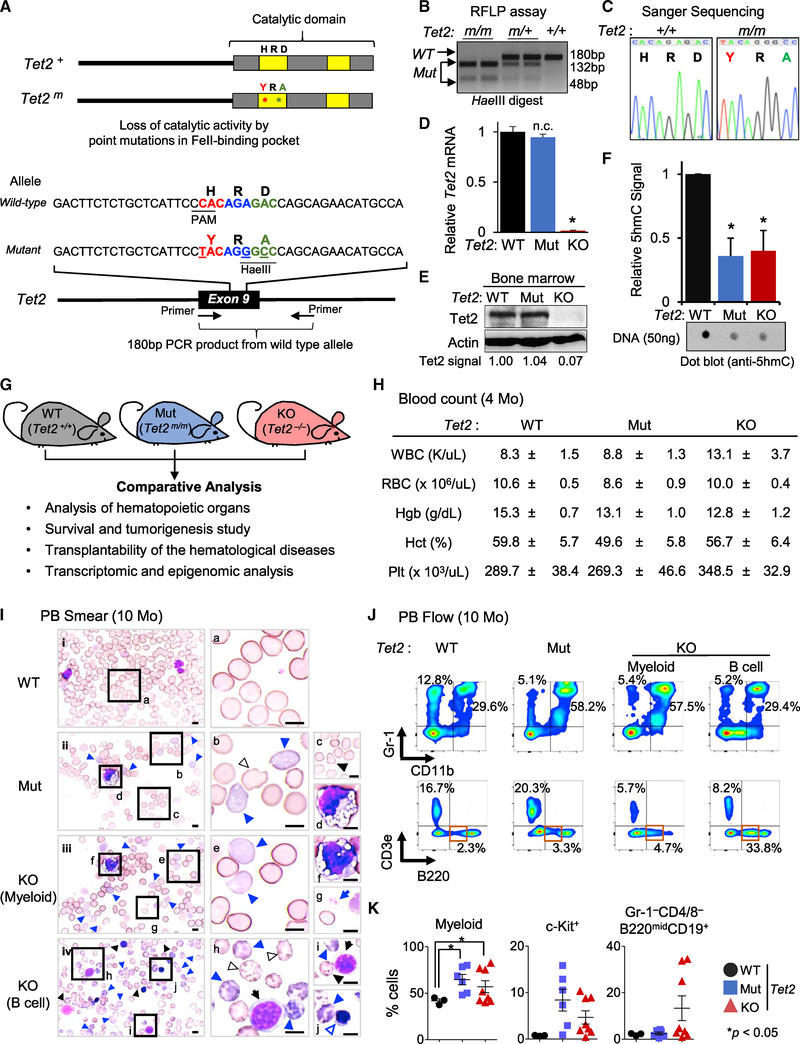
Figure 1. Generation of Tet2 Catalytic Mutant (Mut) Mouse and Characterization of Its Hematological Phenotypes (A) Tet2 wild-type (WT) and catalytic Mut proteins (top) and alleles (bottom). (B and C) Analysis of the genotypes of Tet2 catalytic Mut mice by RFLP (restriction fragment length polymorphism) (B) and Sanger sequencing (C). (D) Tet2 mRNA levels in Lin−Sca-1+c-Kit+ (LSK) cells of Indicated genotypes quantified by qRT-PCR. Data are normalized to Gapdh. Note the absence of Tet2 mRNA in knockout (KO) but its normal expression in Mut samples. (E) Tet2 protein levels in total bone marrow isolated from 4-month-old mice assessed by western blot. Quantified Tet2 signal intensity normalized to actin signal intensity is shown. Note the absence of Tet2 protein in KO but its normal and comparable expression in Mut and WT samples. (F) Levels of 5hmC in the bone marrow of the indicated genotypes, assessed by dot blot and quantified as average of three separated experiments (relative to WT control samples) (n = 3). (G) Overview of experimental platform using Tet2 WT, Mut, and KO mice. (H) Blood counts of Tet2 Mut and KO mice (4 months old, n = 8). (I) Representative smears of peripheral blood (PB) of 10-month-old Tet2 Mut (ii), Tet2 KO with MDS-like myeloid (iii), and lymphoid (iv) phenotypes and WT control mice (i). Images of representative dysplastic hematopoietic cells found in Tet2 Mut and KO mice are also shown (right; b–j, higher magnification images). Tet2 Mut and KO mice show dysplastic erythroid cells (polychromatophilic, blue arrowhead; Howell-Jolly bodies, black arrowhead; other poikilocytes [e.g., echinocytes], outlined arrowhead; immature erythroid cells, blue-outlined arrowhead). Dysplastic myeloid cells (d and f) and dysplastic platelets (giant platelet, g), as well as immature B cells (black arrows [h and i]) are shown. All images are taken at ×100 magnification. Scale bars, 10 μm. (J) Representative flow data for myeloid and lymphoid lineages in PB from Tet2 Mut mice (middle) and Tet2 KO mice with myeloid and B cell phenotypes (right) (10 months old). Flow data for WT control are also shown (left). (K) Percentages ± SEM of CD11b+ (left), c-Kit+ (middle), and B220lowCD19+CD43+ (in Gr-1−CD4/8− cells, right) cells in the PB in Tet2 Mut (n = 6) and KO (n = 8) mice (10 months old). Error bars indicate SD unless otherwise specified. n.c. stands for no significant change. See also Figure S1.
Figure 1. Generation of Tet2 Catalytic Mutant (Mut) Mouse and Characterization of Its Hematological Phenotypes (A) Tet2 wild-type (WT) and catalytic Mut proteins (top) and alleles (bottom). (B and C) Analysis of the genotypes of Tet2 catalytic Mut mice by RFLP (restriction fragment length polymorphism) (B) and Sanger sequencing (C). (D) Tet2 mRNA levels in Lin−Sca-1+c-Kit+ (LSK) cells of Indicated genotypes quantified by qRT-PCR. Data are normalized to Gapdh. Note the absence of Tet2 mRNA in knockout (KO) but its normal expression in Mut samples. (E) Tet2 protein levels in total bone marrow isolated from 4-month-old mice assessed by western blot. Quantified Tet2 signal intensity normalized to actin signal intensity is shown. Note the absence of Tet2 protein in KO but its normal and comparable expression in Mut and WT samples. (F) Levels of 5hmC in the bone marrow of the indicated genotypes, assessed by dot blot and quantified as average of three separated experiments (relative to WT control samples) (n = 3). (G) Overview of experimental platform using Tet2 WT, Mut, and KO mice. (H) Blood counts of Tet2 Mut and KO mice (4 months old, n = 8). (I) Representative smears of peripheral blood (PB) of 10-month-old Tet2 Mut (ii), Tet2 KO with MDS-like myeloid (iii), and lymphoid (iv) phenotypes and WT control mice (i). Images of representative dysplastic hematopoietic cells found in Tet2 Mut and KO mice are also shown (right; b–j, higher magnification images). Tet2 Mut and KO mice show dysplastic erythroid cells (polychromatophilic, blue arrowhead; Howell-Jolly bodies, black arrowhead; other poikilocytes [e.g., echinocytes], outlined arrowhead; immature erythroid cells, blue-outlined arrowhead). Dysplastic myeloid cells (d and f) and dysplastic platelets (giant platelet, g), as well as immature B cells (black arrows [h and i]) are shown. All images are taken at ×100 magnification. Scale bars, 10 μm. (J) Representative flow data for myeloid and lymphoid lineages in PB from Tet2 Mut mice (middle) and Tet2 KO mice with myeloid and B cell phenotypes (right) (10 months old). Flow data for WT control are also shown (left). (K) Percentages ± SEM of CD11b+ (left), c-Kit+ (middle), and B220lowCD19+CD43+ (in Gr-1−CD4/8− cells, right) cells in the PB in Tet2 Mut (n = 6) and KO (n = 8) mice (10 months old). Error bars indicate SD unless otherwise specified. n.c. stands for no significant change. See also Figure S1.CC BY-NC-ND · PubMed Central
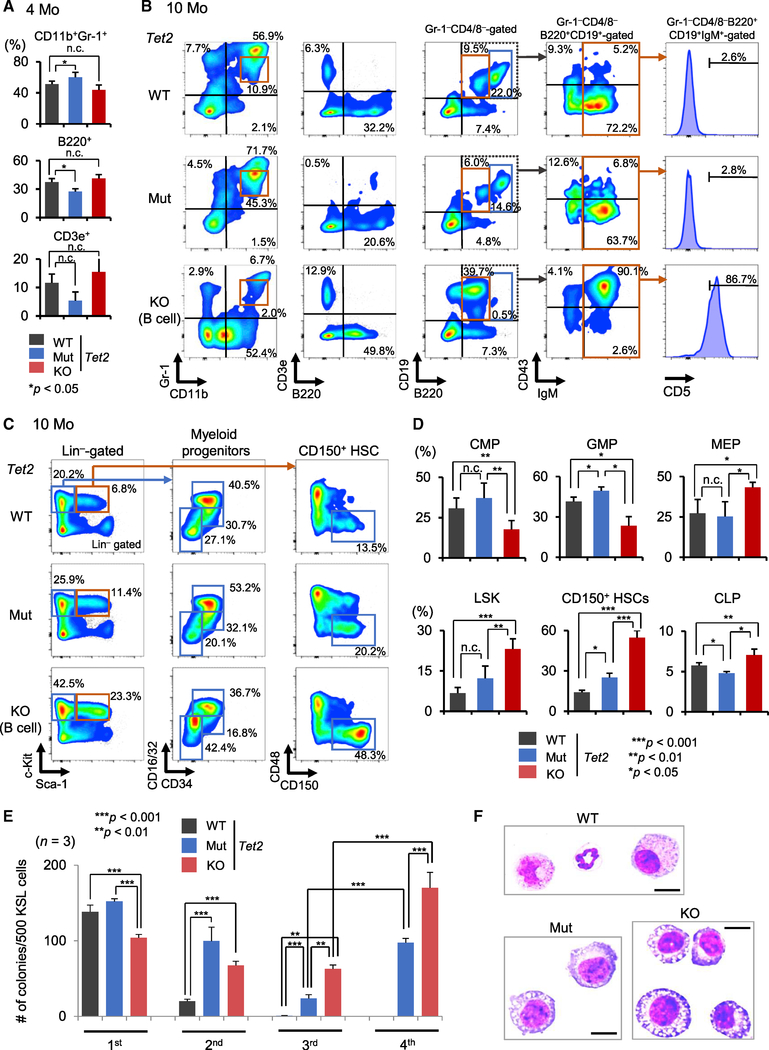
Figure 2. Analysis of Tet2 Mut and KO Mouse Bone Marrow (A) Percentages of the indicated fractions in the bone marrow of Tet2 Mut and KO mice (4 months old) (n = 6). (B) Bone marrow flow analysis for myeloid and lymphoid cells from Tet2 Mut and KO mice (10 months old). (C and D) Representative flow data for myeloid progenitors and HSPCs in the bone marrow from Tet2 Mut and KO mice (10 months old). Percentages of the indicated fractions (percentage in Lin−Sca1−c-Kit+ cells for CMPs, GMPs, and MEPs; percentage in Lin−CD127+ cells for CLPs; percentage in Lin− cells for LSK; and percentage in CD135−LSK cells for CD150+ HSCs) (n = 6). (E) Tet2-KO HSPCs have increased replating capacity compared to Tet2-Mut HSPCs (10 months old, up to fourth -round replating data) (n = 3). (F) Representative images of May-Grünwald-Giemsa-stained cytospin preparations of the colonies formed by HSPCs from Tet2 WT, Mut, and KO mice (at second replating). Metamyelocytes, myelocytes, and matured granulocytes consist of WT colonies, and immature and dysplastic myeloid cells are increased in Tet2 Mut and KO colonies (also see Figure S2H). Scale bars, 10 μm. HSPCs, hematopoietic stem and progenitor cells; LSK, Lin−c-Kit+Sca-1+; MEP, megakaryocyte-erythrocyte progenitor, Lin−Sca-1−c-Kit+CD16/32low/negCD34low/neg; GMP, granulocyte-monocyte progenitor, Lin−Sca-1−c-Kit+CD16/32highCD34+; CMP, common myeloid progenitor, Lin−Sca-1−c-Kit+CD16/32lowCD34+; CLP, common lymphoid progenitor, Lin−IL7Rα+c-KitmidSca-1+. Error bars indicate SD. n.c. stands for no significant change. See also Figure S2.
Figure 2. Analysis of Tet2 Mut and KO Mouse Bone Marrow (A) Percentages of the indicated fractions in the bone marrow of Tet2 Mut and KO mice (4 months old) (n = 6). (B) Bone marrow flow analysis for myeloid and lymphoid cells from Tet2 Mut and KO mice (10 months old). (C and D) Representative flow data for myeloid progenitors and HSPCs in the bone marrow from Tet2 Mut and KO mice (10 months old). Percentages of the indicated fractions (percentage in Lin−Sca1−c-Kit+ cells for CMPs, GMPs, and MEPs; percentage in Lin−CD127+ cells for CLPs; percentage in Lin− cells for LSK; and percentage in CD135−LSK cells for CD150+ HSCs) (n = 6). (E) Tet2-KO HSPCs have increased replating capacity compared to Tet2-Mut HSPCs (10 months old, up to fourth -round replating data) (n = 3). (F) Representative images of May-Grünwald-Giemsa-stained cytospin preparations of the colonies formed by HSPCs from Tet2 WT, Mut, and KO mice (at second replating). Metamyelocytes, myelocytes, and matured granulocytes consist of WT colonies, and immature and dysplastic myeloid cells are increased in Tet2 Mut and KO colonies (also see Figure S2H). Scale bars, 10 μm. HSPCs, hematopoietic stem and progenitor cells; LSK, Lin−c-Kit+Sca-1+; MEP, megakaryocyte-erythrocyte progenitor, Lin−Sca-1−c-Kit+CD16/32low/negCD34low/neg; GMP, granulocyte-monocyte progenitor, Lin−Sca-1−c-Kit+CD16/32highCD34+; CMP, common myeloid progenitor, Lin−Sca-1−c-Kit+CD16/32lowCD34+; CLP, common lymphoid progenitor, Lin−IL7Rα+c-KitmidSca-1+. Error bars indicate SD. n.c. stands for no significant change. See also Figure S2.CC BY-NC-ND · PubMed Central
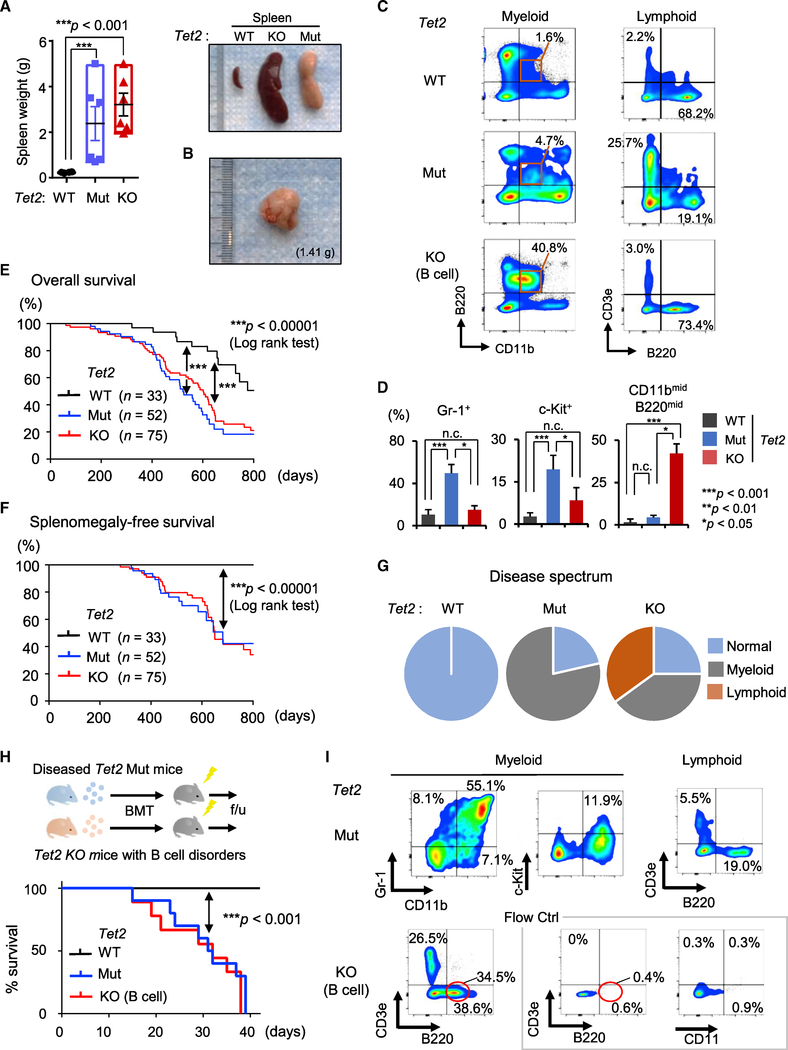
Figure 3. Characterization of Hematological Malignancies in Tet2 Catalytic Mut Mice (A and B) Spleen weight (n = 3–6; A, left). Representative images of spleens from Tet2 Mut mice with myeloid phenotypes and Tet2 KO mice with lymphoid phenotypes (A, right) (10 months old). Representative images of lymph nodes from Tet2 Mut mice with myeloid phenotypes (B). (C and D) Representative flow data for myeloid and lymphoid lineages in spleens from Tet2 Mut mice with myeloid phenotypes (C, middle) and Tet2 KO mice with lymphoid phenotypes (C, bottom) (10 months old). The percentages of indicated fractions in spleens from Tet2 Mut and Tet2 KO mice are shown (D, n = 6). (E and F) Kaplan-Meier survival curves of overall survival (E) and splenomegaly-free survival (F) of Tet2 Mut and KO mice. The number of mice in each group are shown in parenthesis. Log-rank test was used to generate p values. (G) Disease spectrum in Tet2 Mut and KO mice (n = 16, 18, respectively). (H and I) Schematic of transplantation of diseased bone marrow (H, top). Survival curve of transplanted mice (H, bottom, n = 10 for Mut, 9 for WT and KO). All recipient mice transplanted with Tet2 Mut bone marrow developed lethal myeloid malignancies within 6 weeks after bone marrow transplantation (BMT) (H, bottom). Representative flow cytometric analysis for myeloid and lymphoid lineages in PB of recipient mice transplanted with Tet2 Mut (I. top) or KO (I. bottom) bone marrow, 3 weeks after BMT are shown. Error bars indicate SD. n.c. stands for no significant change. See also Figure S3.
Figure 3. Characterization of Hematological Malignancies in Tet2 Catalytic Mut Mice (A and B) Spleen weight (n = 3–6; A, left). Representative images of spleens from Tet2 Mut mice with myeloid phenotypes and Tet2 KO mice with lymphoid phenotypes (A, right) (10 months old). Representative images of lymph nodes from Tet2 Mut mice with myeloid phenotypes (B). (C and D) Representative flow data for myeloid and lymphoid lineages in spleens from Tet2 Mut mice with myeloid phenotypes (C, middle) and Tet2 KO mice with lymphoid phenotypes (C, bottom) (10 months old). The percentages of indicated fractions in spleens from Tet2 Mut and Tet2 KO mice are shown (D, n = 6). (E and F) Kaplan-Meier survival curves of overall survival (E) and splenomegaly-free survival (F) of Tet2 Mut and KO mice. The number of mice in each group are shown in parenthesis. Log-rank test was used to generate p values. (G) Disease spectrum in Tet2 Mut and KO mice (n = 16, 18, respectively). (H and I) Schematic of transplantation of diseased bone marrow (H, top). Survival curve of transplanted mice (H, bottom, n = 10 for Mut, 9 for WT and KO). All recipient mice transplanted with Tet2 Mut bone marrow developed lethal myeloid malignancies within 6 weeks after bone marrow transplantation (BMT) (H, bottom). Representative flow cytometric analysis for myeloid and lymphoid lineages in PB of recipient mice transplanted with Tet2 Mut (I. top) or KO (I. bottom) bone marrow, 3 weeks after BMT are shown. Error bars indicate SD. n.c. stands for no significant change. See also Figure S3.CC BY-NC-ND · PubMed Central
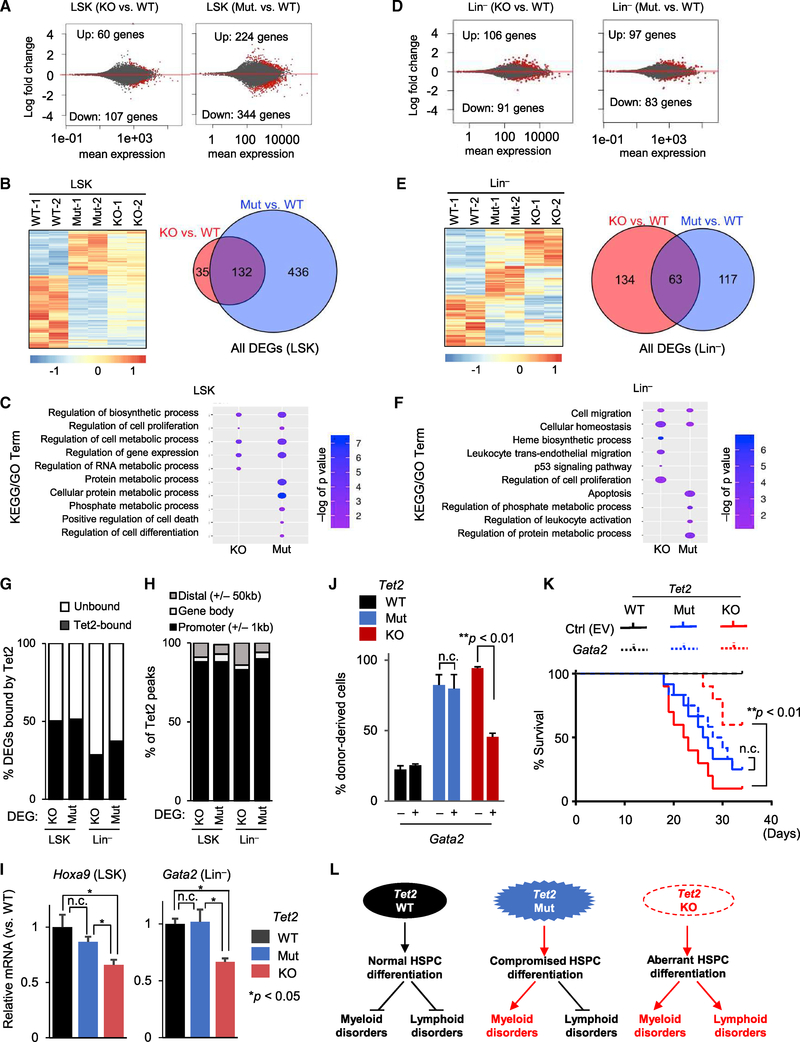
Figure 4. Gene Expression Profiling of Tet2 Mut and KO HSPCs (A) MA plot of RNA-seq analysis of 2-month-old LSK cells as log2 fold change versus mean gene expression levels. Differentially expressed genes (DEGs) are depicted in red. Mut or KO groups are compared to WT. (B) Heatmap of differentially expressed genes identified by RNA-seq across LSK cells of indicated genotypes. Genes differentially expressed in at least one of the comparisons are displayed. Intensity values are log2 transformed (left) and colors represent relative expression across samples. Venn diagram illustrating the overlap between all DEGs in Tet2-Mut and Tet2-KO LSK cells (right). (C) Selected terms from GO and KEGG analysis of DEGs in LSK cells. Data are plotted with colors for −log10 of p value and bubble sizes for numbers of genes. (D) MA plot of RNA-seq analysis of 2-month-old Lin− cells as log2 fold change versus mean gene expression levels. DEGs are depicted in red (compared to WT). (E) Heatmap (left) of DEGs identified by RNA-seq across Lin− cells of indicated genotypes. Genes differentially expressed in at least one of the comparisons are displayed. Venn diagram illustrating the overlap between all DEGs in Tet2-Mut and Tet2-KO Lin− cells (right). (F) Selected terms from GO and KEGG analysis of DEGs in Lin− cells. Data are plotted with colors for −log10 of p value and bubble sizes for numbers of genes. (G) Comparison of DEGs with Tet2 ChIP-seq peaks in bone marrow, revealing that nearly half of DEGs in LSK cells and approximately one-third of DEGs in Lin− cells are bound by Tet2 (i.e., direct targets of Tet2). Tet2 ChIP-seq data were from a previous study (see STAR Methods) (H) Classification of Tet2 peaks at DEGs revealing that Tet2 binding is enriched at the promoters of Tet2-bound DEGs. (I) Relative expression levels of Hoxa9 and Gata2 mRNA in LSK or Lin− cells from mice of indicated genotypes (compared to WT control samples), quantified by qRT-PCR (n = 3). Data normalized to Gapdh. (J and K) Overexpression of Gata2 in the bone marrow of Tet2 Mut or KO mice with MDS- or CLL-like hematopoietic disorder, respectively, followed by competitive BMT (mixture of test cells [Ly45.2] with competitor [Ly45.1/45.2] in a 1:3 ratio). Percentage of donor-derived cells in PB of recipient mice transplanted 3 weeks after BMT is shown in (J) (n = 4), and the survival curve of transplanted mice is shown in (K) (n = 8, 12, and 10 for WT, Mu, and KO, respectively). (L) Model summarizing the effects of loss of Tet2 versus loss of its catalytic activity alone on myeloid and lymphoid lineage homeostasis and development of malignancies. Error bars indicate SD. n.c. stands for no significant change. See also Figure S4.
Figure 4. Gene Expression Profiling of Tet2 Mut and KO HSPCs (A) MA plot of RNA-seq analysis of 2-month-old LSK cells as log2 fold change versus mean gene expression levels. Differentially expressed genes (DEGs) are depicted in red. Mut or KO groups are compared to WT. (B) Heatmap of differentially expressed genes identified by RNA-seq across LSK cells of indicated genotypes. Genes differentially expressed in at least one of the comparisons are displayed. Intensity values are log2 transformed (left) and colors represent relative expression across samples. Venn diagram illustrating the overlap between all DEGs in Tet2-Mut and Tet2-KO LSK cells (right). (C) Selected terms from GO and KEGG analysis of DEGs in LSK cells. Data are plotted with colors for −log10 of p value and bubble sizes for numbers of genes. (D) MA plot of RNA-seq analysis of 2-month-old Lin− cells as log2 fold change versus mean gene expression levels. DEGs are depicted in red (compared to WT). (E) Heatmap (left) of DEGs identified by RNA-seq across Lin− cells of indicated genotypes. Genes differentially expressed in at least one of the comparisons are displayed. Venn diagram illustrating the overlap between all DEGs in Tet2-Mut and Tet2-KO Lin− cells (right). (F) Selected terms from GO and KEGG analysis of DEGs in Lin− cells. Data are plotted with colors for −log10 of p value and bubble sizes for numbers of genes. (G) Comparison of DEGs with Tet2 ChIP-seq peaks in bone marrow, revealing that nearly half of DEGs in LSK cells and approximately one-third of DEGs in Lin− cells are bound by Tet2 (i.e., direct targets of Tet2). Tet2 ChIP-seq data were from a previous study (see STAR Methods) (H) Classification of Tet2 peaks at DEGs revealing that Tet2 binding is enriched at the promoters of Tet2-bound DEGs. (I) Relative expression levels of Hoxa9 and Gata2 mRNA in LSK or Lin− cells from mice of indicated genotypes (compared to WT control samples), quantified by qRT-PCR (n = 3). Data normalized to Gapdh. (J and K) Overexpression of Gata2 in the bone marrow of Tet2 Mut or KO mice with MDS- or CLL-like hematopoietic disorder, respectively, followed by competitive BMT (mixture of test cells [Ly45.2] with competitor [Ly45.1/45.2] in a 1:3 ratio). Percentage of donor-derived cells in PB of recipient mice transplanted 3 weeks after BMT is shown in (J) (n = 4), and the survival curve of transplanted mice is shown in (K) (n = 8, 12, and 10 for WT, Mu, and KO, respectively). (L) Model summarizing the effects of loss of Tet2 versus loss of its catalytic activity alone on myeloid and lymphoid lineage homeostasis and development of malignancies. Error bars indicate SD. n.c. stands for no significant change. See also Figure S4.CC BY-NC-ND · PubMed Central

Verification

Claims the paper makes

The claims and statistics of this paper haven’t been checked yet.

Run the check — free, no account needed. It reads the open-access text and checks the sources it cites.

A few free checks a day · papers already verified open instantly · results are public

Claims other papers make about this one

Each is checked against this paper’s own text: does it say what the citing paper says it does?

Self-check

Percentages, sums and reported differences re-computed from the paper’s own numbers.

The self-check needs the paper’s full text.

Citations

Cites

Show all 9 references

Research works printed but not linked: 37

  1. Abdel-Wahab, 2009, Genetic characterization of TET1, TET2, and TET3 alterations in myeloid malignancies, Blood, 114, 144, 10.1182/blood-2009-03-210039 · DOI · Paper page
  2. Anders, 2015, HTSeq—a Python framework to work with high-throughput sequencing data, Bioinformatics, 31, 166, 10.1093/bioinformatics/btu638 · DOI · Paper page
  3. Asmar, 2013, Genome-wide profiling identifies a DNA methylation signature that associates with TET2 mutations in diffuse large B-cell lymphoma, Haematologica, 98, 1912, 10.3324/haematol.2013.088740 · DOI
  4. Chen, 2013, TET2 promotes histone O-GlcNAcylation during gene transcription, Nature, 493, 561, 10.1038/nature11742 · DOI · Paper page
  5. Cimmino, 2011, TET family proteins and their role in stem cell differentiation and transformation, Cell Stem Cell, 9, 193, 10.1016/j.stem.2011.08.007 · DOI
  6. Cimmino, 2017, Restoration of TET2 function blocks aberrant self-renewal and leukemia progression, Cell, 170, 1079, 10.1016/j.cell.2017.07.032 · DOI · Paper page
  7. Deplus, 2013, TET2 and TET3 regulate GlcNAcylation and H3K4 methylation through OGT and SET1/COMPASS, EMBO J., 32, 645, 10.1038/emboj.2012.357 · DOI · Paper page
  8. Dominguez, 2018, TET2 deficiency causes germinal center hyperplasia, impairs plasma cell differentiation, and promotes B-cell lymphomagenesis, Cancer Discov., 8, 1632, 10.1158/2159-8290.CD-18-0657 · DOI · Paper page
  9. Fabiani, 2010, Analysis of genome-wide methylation and gene expression induced by 5-aza-2′-deoxycytidine identifies BCL2L10 as a frequent methylation target in acute myeloid leukemia, Leuk. Lymphoma, 51, 2275, 10.3109/10428194.2010.528093 · DOI
  10. Garcia-Manero, 2011, Hypomethylating agents and other novel strategies in myelodysplastic syndromes, J. Clin. Oncol., 29, 516, 10.1200/JCO.2010.31.0854 · DOI
  11. Gardin, 2017, Hypomethylating agents as a therapy for AML, Curr. Hematol. Malig. Rep., 12, 1, 10.1007/s11899-017-0363-4 · DOI
  12. Giagounidis, 2013, Morphology, cytogenetics and classification of MDS, Best Pract. Res. Clin. Haematol., 26, 337, 10.1016/j.beha.2013.09.004 · DOI
  13. Goasguen, 1992, Classification and morphologic features of the myelodysplastic syndromes, Semin. Oncol., 19, 4
  14. Issa, 2004, Phase 1 study of low-dose prolonged exposure schedules of the hypomethylating agent 5-aza-2′-deoxycytidine (decitabine) in hematopoietic malignancies, Blood, 103, 1635, 10.1182/blood-2003-03-0687 · DOI
  15. Ito, 2010, Role of Tet proteins in 5mC to 5hmC conversion, ES-cell self-renewal and inner cell mass specification, Nature, 466, 1129, 10.1038/nature09303 · DOI · Paper page
  16. Ito, 2012, A PML–PPAR-δ pathway for fatty acid oxidation regulates hematopoietic stem cell maintenance, Nat. Med., 18, 1350, 10.1038/nm.2882 · DOI
  17. Ito, 2016, Self-renewal of a purified Tie2+ hematopoietic stem cell population relies on mitochondrial clearance, Science, 354, 1156, 10.1126/science.aaf5530 · DOI
  18. Jiao, 2012, DAVID-WS: a stateful web service to facilitate gene/protein list analysis, Bioinformatics, 28, 1805, 10.1093/bioinformatics/bts251 · DOI
  19. Kim, 2013, TopHat2: accurate alignment of transcriptomes in the presence of insertions, deletions and gene fusions, Genome Biol., 14, R36, 10.1186/gb-2013-14-4-r36 · DOI · Paper page
  20. Ko, 2011, Ten-Eleven-Translocation 2 (TET2) negatively regulates homeostasis and differentiation of hematopoietic stem cells in mice, Proc. Natl. Acad. Sci. USA, 108, 14566, 10.1073/pnas.1112317108 · DOI · Paper page
  21. Komrokji, 2010, Myelodysplastic syndromes classification and risk stratification, Hematol. Oncol. Clin. North Am., 24, 443, 10.1016/j.hoc.2010.02.004 · DOI
  22. Kosmider, 2009, TET2 gene mutation is a frequent and adverse event in chronic myelomonocytic leukemia, Haematologica, 94, 1676, 10.3324/haematol.2009.011205 · DOI
  23. Lemonnier, 2012, Recurrent TET2 mutations in peripheral T-cell lymphomas correlate with TFH-like features and adverse clinical parameters, Blood, 120, 1466, 10.1182/blood-2012-02-408542 · DOI
  24. Li, 2011, Deletion of Tet2 in mice leads to dysregulated hematopoietic stem cells and subsequent development of myeloid malignancies, Blood, 118, 4509, 10.1182/blood-2010-12-325241 · DOI · Paper page
  25. Love, 2014, Moderated estimation of fold change and dispersion for RNA-seq data with DESeq2, Genome Biol., 15, 550, 10.1186/s13059-014-0550-8 · DOI · Paper page
  26. Mouly, 2018, B-cell tumor development in Tet2-deficient mice, Blood Adv., 2, 703, 10.1182/bloodadvances.2017014118 · DOI
  27. Purton, 2007, Limiting factors in murine hematopoietic stem cell assays, Cell Stem Cell, 1, 263, 10.1016/j.stem.2007.08.016 · DOI
  28. Quivoron, 2011, TET2 inactivation results in pleiotropic hematopoietic abnormalities in mouse and is a recurrent event during human lymphomagenesis, Cancer Cell, 20, 25, 10.1016/j.ccr.2011.06.003 · DOI · Paper page
  29. Sato, 2016, DNMT3A and TET2 in the Pre-Leukemic Phase of Hematopoietic Disorders, Front. Oncol., 6, 187, 10.3389/fonc.2016.00187 · DOI
  30. Schneider, 2012, NIH Image to ImageJ: 25 years of image analysis, Nat. Methods, 9, 671, 10.1038/nmeth.2089 · DOI · Paper page
  31. Song, 2013, The oncogenic microRNA miR-22 targets the TET2 tumor suppressor to promote hematopoietic stem cell self-renewal and transformation, Cell Stem Cell, 13, 87, 10.1016/j.stem.2013.06.003 · DOI
  32. Tahiliani, 2009, Conversion of 5-methylcytosine to 5-hydroxymethylcytosine in mammalian DNA by MLL partner TET1, Science, 324, 930, 10.1126/science.1170116 · DOI · Paper page
  33. Tefferi, 2009, Myelodysplastic syndromes, N. Engl. J. Med., 361, 1872, 10.1056/NEJMra0902908 · DOI
  34. Trapnell, 2010, Transcript assembly and quantification by RNA-Seq reveals unannotated transcripts and isoform switching during cell differentiation, Nat. Biotechnol., 28, 511, 10.1038/nbt.1621 · DOI · Paper page
  35. Wang, 2011, Diagnosis of myelodysplastic syndromes in cytopenic patients, Hematol. Oncol. Clin. North Am., 25, 10.1016/j.hoc.2011.09.009 · DOI
  36. Wu, 2011, Dual functions of Tet1 in transcriptional regulation in mouse embryonic stem cells, Nature, 473, 389, 10.1038/nature09934 · DOI · Paper page
  37. Yu, 2015, Chronic lymphocytic leukemia: current concepts, Anticancer Res., 35, 5149

Cited by

See all 114

Metadata

Authors
Ito, K., Lee, J., Chrysanthou, S., Zhao, Y., Josephs, K., Sato, H., Teruya-Feldstein, J., Zheng, D., Dawlaty, M. M., & Ito, K.
Venue
Cell Reports
Publisher
Elsevier BV
Published
2019-09
Volume
28
Issue
10
Pages
2480-2490.e4
ISSN
2211-1247
Cited by
114
References
9
Language
en
Funders
National Institutes of Health

About these checks

Registry, retraction, Cites and statistics results are computed, not judged, with one exception: a printed reference that no index lists is read once by a model before it counts as a citation error. Claims are extracted by a model and kept only when their quote appears verbatim in the text; each cited source is then checked, with a model’s help, for whether it says what the claim relies on. Those verdicts can be wrong — read the claim’s quote and the cited source before relying on one.

Statistics and arithmetic are recomputed, not judged.

Confidence bands are shown only for fields calibrated on our annotated test set. None is calibrated yet, so no band is shown.

What counts as a claim ›How we measure confidence ›How we check this ›

Are you an author, or do you see a problem with this page? Request a review

How to cite

Cite CoChat for the checks on this page, and the paper for its own findings.

This page
CoChat. (2026). Citation check: Non-catalytic Roles of Tet2 Are Essential to Regulate Hematopoietic Stem and Progenitor Cell Homeostasis. https://app.cochat.ai/papers/10.1016/j.celrep.2019.07.094
The paper
Ito, K., Lee, J., Chrysanthou, S., Zhao, Y., Josephs, K., Sato, H., Teruya-Feldstein, J., Zheng, D., Dawlaty, M. M., & Ito, K. (2019). Non-catalytic Roles of Tet2 Are Essential to Regulate Hematopoietic Stem and Progenitor Cell Homeostasis. Cell Reports. https://doi.org/10.1016/j.celrep.2019.07.094