

The DOI matches its Crossref record; 49 of the 50 references it cites were found in a registry or an index.
Human Induced Pluripotent Stem Cell-Derived Macrophages Share Ontogeny with MYB-Independent Tissue-Resident Macrophages
Open accessAbstract
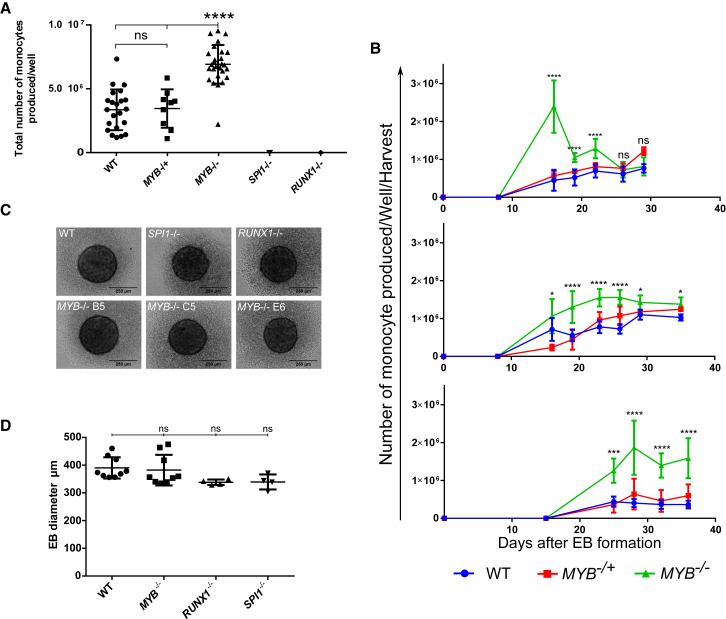
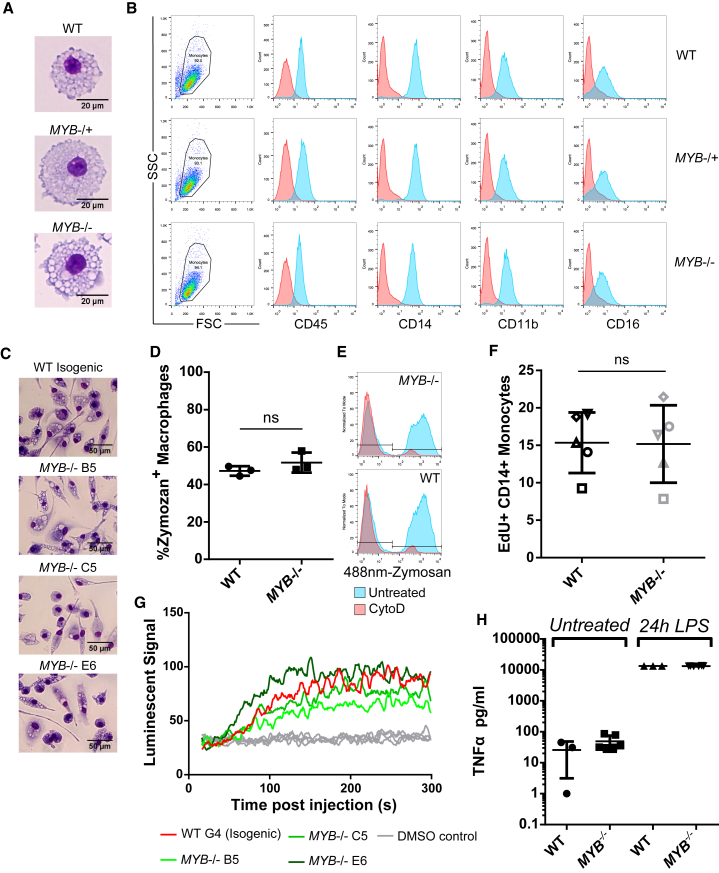
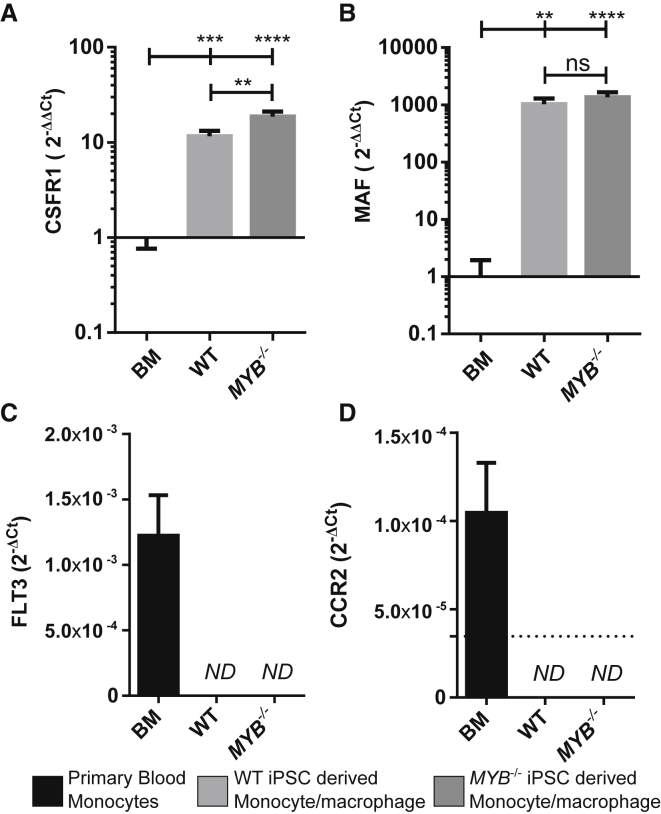
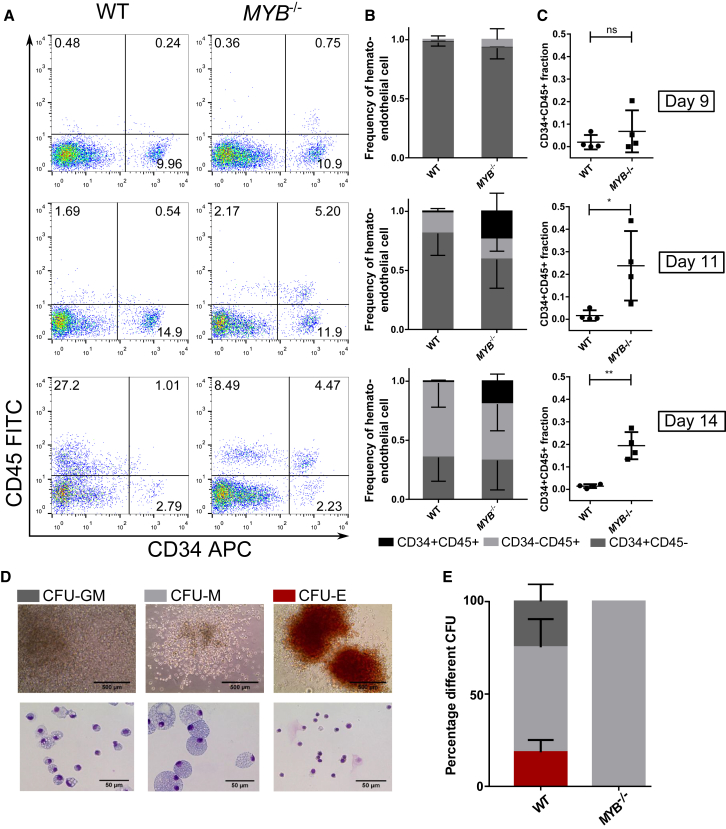
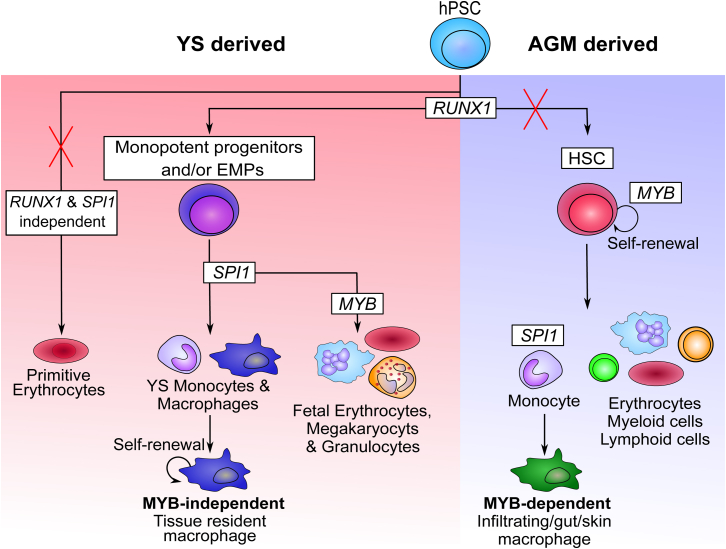
Tissue-resident macrophages, such as microglia, Kupffer cells, and Langerhans cells, derive from Myb-independent yolk sac (YS) progenitors generated before the emergence of hematopoietic stem cells (HSCs). Myb-independent YS-derived resident macrophages self-renew locally, independently of circulating monocytes and HSCs. In contrast, adult blood monocytes, as well as infiltrating, gut, and dermal macrophages, derive from Myb-dependent HSCs. These findings are derived from the mouse, using gene knockouts and lineage tracing, but their applicability to human development has not been formally demonstrated. Here, we use human induced pluripotent stem cells (iPSCs) as a tool to model human hematopoietic development. By using a CRISPR-Cas9 knockout strategy, we show that human iPSC-derived monocytes/macrophages develop in an MYB-independent, RUNX1-, and SPI1 (PU.1)-dependent fashion. This result makes human iPSC-derived macrophages developmentally related to and a good model for MYB-independent tissue-resident macrophages, such as alveolar and kidney macrophages, microglia, Kupffer cells, and Langerhans cells.
Overview
The claims and statistics of this paper haven’t been checked yet.
Run the check — free, no account needed. It reads the open-access text and checks the sources it cites.
Integrity signals
Registry
Cites
Statistics
Figures
Verification
Claims the paper makes
The claims and statistics of this paper haven’t been checked yet.
Run the check — free, no account needed. It reads the open-access text and checks the sources it cites.
Claims other papers make about this one
Each is checked against this paper’s own text: does it say what the citing paper says it does?
The source backs part of the claim, not all of it — or backs it for a different population, condition or comparison.
In the citing paper
“These cells closely resemble human foetal microglia with regards to transcriptional signature and express high levels of microglial genes29,30.”
From PLCγ2 regulates TREM2 signalling and integrin-mediated adhesion and migration of human iPSC-derived macrophages (2021) · cites this paper as [30]
Experimental — accuracy not yet measuredThe source backs part of the claim, not all of it — or backs it for a different population, condition or comparison.
In the citing paper
“We have recently directly demonstrated that these derive from MYB-independent, RUNX1- and PU.1-dependent precursors, characteristic of yolk sac-derived macrophages (Buchrieser et al., 2017, Vanhee et al., 2015).”
From A highly efficient human pluripotent stem cell microglia model displays a neuronal-co-culture-specific expression profile and inflammatory response (2017) · cites this paper as Buchrieser et al., 2017
Experimental — accuracy not yet measuredThe source backs part of the claim, not all of it — or backs it for a different population, condition or comparison.
In the citing paper
“However, only our protocol has direct evidence by gene knockout for producing MYB-independent primitive macrophages (Buchrieser et al., 2017).”
From A highly efficient human pluripotent stem cell microglia model displays a neuronal-co-culture-specific expression profile and inflammatory response (2017) · cites this paper as Buchrieser et al., 2017
Experimental — accuracy not yet measuredThe cited source says what the claim attributes to it.
In the citing paper
“Our own work (Buchrieser et al., 2017) and that of others (Hoeffel et al., 2015) indicates that this protocol produces MYB-independent myeloid cells, recapitulating an embryonic ontogeny, and lineage-tracking studies in mouse have demonstrated that microglia derive from primitive, yolk sac macrophages that migrate into the developing brain (Ginhoux et al., 2010, Ginhoux et al., 2013).”
From A highly efficient human pluripotent stem cell microglia model displays a neuronal-co-culture-specific expression profile and inflammatory response (2017) · cites this paper as Buchrieser et al., 2017
Self-check
Percentages, sums and reported differences re-computed from the paper’s own numbers.
The self-check needs the paper’s full text.
Citations
Cites
Fate Mapping Analysis Reveals That Adult Microglia Derive from Primitive Macrophages
Ginhoux, F., Greter, M., Leboeuf, M., Nandi, S., See, P., Gokhan, S., Mehler, M. F., Conway, S. J., Ng, L. G., Stanley, E. R., et al. (2010) · Science · doi:10.1126/science.1194637 · Cited by 5,175
A Lineage of Myeloid Cells Independent of Myb and Hematopoietic Stem Cells
Schulz, C., Perdiguero, E. G., Chorro, L., Szabo-Rogers, H., Cagnard, N., Kierdorf, K., Prinz, M., Wu, B., Jacobsen, S. E. W., Pollard, J. W., et al. (2012) · Science · doi:10.1126/science.1219179 · Cited by 2,578
Tissue-resident macrophages originate from yolk-sac-derived erythro-myeloid progenitors
Gomez Perdiguero, E., Klapproth, K., Schulz, C., Busch, K., Azzoni, E., Crozet, L., Garner, H., Trouillet, C., de Bruijn, M. F., Geissmann, F., et al. (2015) · Nature · doi:10.1038/nature13989 · Cited by 2,339 · cited 3×
“Murine YS-derived macrophages and fetal monocytes seed most tissues before HSC-derived definitive hematopoiesis (Ginhoux et al., 334 Stem Cell Reports j Vol. 8 j 334–345 j February 14, 2017 j ª 2017 The A This is an open access article under the CC BY license (http://creativecommo 2010; Hoeffel et al., 2015; Kierdorf…”
Hashimoto, D., Chow, A., Noizat, C., Teo, P., Beasley, M. B., Leboeuf, M., Becker, C. D., See, P., Price, J., Lucas, D., et al. (2013) · Immunity · doi:10.1016/j.immuni.2013.04.004 · Cited by 2,311 · cited 2×
“…et al., 2015) where, with the exception of dermal (Tamoutounour et al., 2013), gut (Bain et al., 2014), and a fraction of cardiac macrophages (Epelman et al., 2014), they self-renew throughout life with minor contribution from adult blood monocytes (Epelman et al., 2014; Hashimoto et al., 2013).”
Okuda, T., van Deursen, J., Hiebert, S. W., Grosveld, G., & Downing, J. R. (1996) · Cell · doi:10.1016/s0092-8674(00)80986-1 · Cited by 1,856
Requirement of transcription factor PU.1 in the development of multiple hematopoietic lineages
Scott, E. W., Simon, M. C., Anastasi, J., & Singh, H. (1994) · Science · doi:10.1126/science.8079170 · Cited by 1,532
Epelman, S., Lavine, K. J., Beaudin, A. E., Sojka, D. K., Carrero, J. A., Calderon, B., Brija, T., Gautier, E. L., Ivanov, S., Satpathy, A. T., et al. (2014) · Immunity · doi:10.1016/j.immuni.2013.11.019 · Cited by 1,494
Microglia emerge from erythromyeloid precursors via Pu.1- and Irf8-dependent pathways
Kierdorf, K., Erny, D., Goldmann, T., Sander, V., Schulz, C., Perdiguero, E. G., Wieghofer, P., Heinrich, A., Riemke, P., Hölscher, C., et al. (2013) · Nature Neuroscience · doi:10.1038/nn.3318 · Cited by 1,457
Bain, C. C., Bravo-Blas, A., Scott, C. L., Gomez Perdiguero, E., Geissmann, F., Henri, S., Malissen, B., Osborne, L. C., Artis, D., & Mowat, A. M. (2014) · Nature Immunology · doi:10.1038/ni.2967 · Cited by 1,178
Wang, Q., Stacy, T., Binder, M., Marin-Padilla, M., Sharpe, A. H., & Speck, N. A. (1996) · Proceedings of the National Academy of Sciences · doi:10.1073/pnas.93.8.3444 · Cited by 1,178
Hoeffel, G., Chen, J., Lavin, Y., Low, D., Almeida, F. F., See, P., Beaudin, A. E., Lum, J., Low, I., Forsberg, E. C., et al. (2015) · Immunity · doi:10.1016/j.immuni.2015.03.011 · Cited by 1,135
Development of erythroid and myeloid progenitors in the yolk sac and embryo proper of the mouse
Palis, J., Robertson, S. M., Kennedy, M., Wall, C., & Keller, G. M. (1999) · Development · doi:10.1242/dev.126.22.5073 · Cited by 1,093
Runx1 is required for the endothelial to haematopoietic cell transition but not thereafter
Chen, M. J., Yokomizo, T., Zeigler, B. M., Dzierzak, E. A., & Speck, N. A. (2009) · Nature · doi:10.1038/nature07619 · Cited by 1,030
A functional c-myb gene is required for normal murine fetal hepatic hematopoiesis
Mucenski, M. L., McLain, K., Kier, A. B., Swerdlow, S. H., Schreiner, C. M., Miller, T. A., Pietryga, D. W., Scott, W. J., & Potter, S. S. (1991) · Cell · doi:10.1016/0092-8674(91)90099-k · Cited by 1,028
Tamoutounour, S., Guilliams, M., Montanana Sanchis, F., Liu, H., Terhorst, D., Malosse, C., Pollet, E., Ardouin, L., Luche, H., Sanchez, C., et al. (2013) · Immunity · doi:10.1016/j.immuni.2013.10.004 · Cited by 783
Bryder, D., Rossi, D. J., & Weissman, I. L. (2006) · American Journal Of Pathology · doi:10.2353/ajpath.2006.060312 · Cited by 764
van de Laar, L., Saelens, W., Prijck, S. D., Martens, L., Scott, C. L., Isterdael, G. V., Hoffmann, E., Beyaert, R., Saeys, Y., Lambrecht, B. N., et al. (2016) · Immunity · doi:10.1016/j.immuni.2016.02.017 · Cited by 665
The Placenta Is a Niche for Hematopoietic Stem Cells
Gekas, C., Dieterlen‐Lièvre, F., Orkin, S. H., & Mikkola, H. K. A. (2005) · Developmental Cell · doi:10.1016/j.devcel.2004.12.016 · Cited by 664
Most Tissue-Resident Macrophages Except Microglia Are Derived from Fetal Hematopoietic Stem Cells
Sheng, J., Ruedl, C., & Karjalainen, K. (2015) · Immunity · doi:10.1016/j.immuni.2015.07.016 · Cited by 523
MAIT cells are activated during human viral infections
van Wilgenburg, B., Scherwitzl, I., Hutchinson, E. C., Leng, T., Kurioka, A., Kulicke, C. A., de Lara, C., Cole, S., Vasanawathana, S., Limpitikul, W., et al. (2016) · Nature Communications · doi:10.1038/ncomms11653 · Cited by 515
Self-citationWilgenburg, B. V., Browne, C., Vowles, J., & Cowley, S. A. (2013) · PLoS ONE · doi:10.1371/journal.pone.0071098 · Cited by 353
MafB/c-Maf Deficiency Enables Self-Renewal of Differentiated Functional Macrophages
Aziz, A., Soucie, E., Sarrazin, S., & Sieweke, M. H. (2009) · Science · doi:10.1126/science.1176056 · Cited by 317
The human syndrome of dendritic cell, monocyte, B and NK lymphoid deficiency
Bigley, V., Haniffa, M. A., Doulatov, S. R., Wang, X., Dickinson, R. E., McGovern, N. N., Jardine, L., Pagan, S., Dimmick, I., Chua, I. C., et al. (2011) · The Journal of Experimental Medicine · doi:10.1084/jem.20101459 · Cited by 304
Ivanovs, A., Александрович, Р. С., Welch, L. A., Anderson, R. A., Turner, M. L., & Medvinsky, A. (2011) · The Journal of Experimental Medicine · doi:10.1084/jem.20111688 · Cited by 289
Haniffa, M. A., Ginhoux, F., Wang, X., Bigley, V., Abel, M., Dimmick, I., Bullock, S., Grisotto, M. A. G., Booth, T. A., Taub, P. J., et al. (2009) · The Journal of Experimental Medicine · doi:10.1084/jem.20081633 · Cited by 268
Macrophage-specific gene functions in Spi1-directed innate immunity
Zakrzewska, A., Cui, C., Stockhammer, O. W., Benard, E. L., Spaink, H. P., & Meijer, A. H. (2010) · Blood · doi:10.1182/blood-2010-01-262873 · Cited by 199
Myeloid Development Is Selectively Disrupted in PU.1 Null Mice
Anderson, K. L., Smith, K. A., Conners, K., McKercher, S. R., Maki, R. A., & Torbett, B. E. (1998) · Blood · doi:10.1182/blood.v91.10.3702 · Cited by 193
Palis, J., Chan, R. J., Koniski, A. D., Patel, R., Starr, M. D., & Yöder, M. C. (2001) · Proceedings of the National Academy of Sciences · doi:10.1073/pnas.071002398 · Cited by 192
Karlsson, K. R., Cowley, S., Martinez, F. O., Shaw, M., Minger, S. L., & James, W. (2008) · Experimental Hematology · doi:10.1016/j.exphem.2008.04.009 · Cited by 164
Self-citationTissue-resident versus monocyte-derived macrophages in the tumor microenvironment
Lahmar, Q., Keirsse, J., Laoui, D., Movahedi, K., Overmeire, E. V., & Ginderachter, J. A. V. (2015) · Biochimica et Biophysica Acta (BBA) - Reviews on Cancer · doi:10.1016/j.bbcan.2015.06.009 · Cited by 161
Lieu, Y. K., & Reddy, E. P. (2009) · Proceedings of the National Academy of Sciences · doi:10.1073/pnas.0907623106 · Cited by 144
Flynn, R., Grundmann, A., Renz, P. F., Haenseler, W., James, W., Cowley, S. A., & Moore, M. D. (2015) · Experimental Hematology · doi:10.1016/j.exphem.2015.06.002 · Cited by 128
Self-citationOkada, H., Watanabe, T., Niki, M., Takano, H., Chiba, N., Yanai, N., Tani, K., Hibino, H., Asano, S., Mucenski, M. L., et al. (1998) · Oncogene · doi:10.1038/sj.onc.1202151 · Cited by 122
Sumner, R., Crawford, A., Mucenski, M. L., & Frampton, J. (2000) · Oncogene · doi:10.1038/sj.onc.1203660 · Cited by 115
Rafii, S., Kloss, C. C., Butler, J. M., Ginsberg, M. D., Gars, E. J., Lis, R., Zhan, Q., Josipović, P., Ding, B., Xiang, J., et al. (2012) · Blood · doi:10.1182/blood-2012-07-444208 · Cited by 102
Lost in translation: pluripotent stem cell‐derived hematopoiesis
Ackermann, M., Liebhaber, S., Klusmann, J., & Lachmann, N. (2015) · EMBO Molecular Medicine · doi:10.15252/emmm.201505301 · Cited by 98
Kanitakis, J., Morélon, E., Petruzzo, P., Badet, L., & Dubernard, J. (2010) · Experimental Dermatology · doi:10.1111/j.1600-0625.2010.01146.x · Cited by 96
Macrophage proliferation, provenance, and plasticity in macroparasite infection
Rückerl, D., & Allen, J. E. (2014) · Immunological Reviews · doi:10.1111/imr.12221 · Cited by 87
Sandor, C., Robertson, P., Lang, C., Heger, A., Booth, H., Vowles, J., Witty, L., Bowden, R. J., Hu, M., Cowley, S. A., et al. (2016) · Human Molecular Genetics · doi:10.1093/hmg/ddw412 · Cited by 75
Jiang, Y., Cowley, S. A., Siler, U., Melguizo, D., Tilgner, K., Browne, C., Dewilton, A., Przyborski, S., Saretzki, G., James, W. S., et al. (2012) · Stem Cells · doi:10.1002/stem.1053 · Cited by 71
Self-citationMukouyama, Y., Chiba, N., Mucenski, M. L., Satake, M., Miyajima, A., Hara, T., & Watanabe, T. (1999) · Current Biology · doi:10.1016/s0960-9822(99)80368-6 · Cited by 58
In vitro human embryonic stem cell hematopoiesis mimics MYB-independent yolk sac hematopoiesis
Vanhee, S., De Mulder, K., Van Caeneghem, Y., Verstichel, G., Van Roy, N., Menten, B., Velghe, I., Philippe, J., De Bleser, D., Lambrecht, B. N., et al. (2015) · Haematologica · doi:10.3324/haematol.2014.112144 · Cited by 51
Klimchenko, O., Stefano, A. D., Geoerger, B., Hamidi, S., Opolon, P., Robert, T., Routhier, M., Benna, J. E., Delezoide, A., Boukour, S., et al. (2010) · Blood · doi:10.1182/blood-2010-07-295246 · Cited by 50
van Wilgenburg, B., Moore, M. D., James, W., & Cowley, S. A. (2014) · PLoS ONE · doi:10.1371/journal.pone.0086071 · Cited by 49
Self-citationAlveolar-like Stem Cell–derived Myb − Macrophages Promote Recovery and Survival in Airway Disease
Litvack, M. L., Wigle, T. J., Lee, J., Wang, J., Ackerley, C. A., Grunebaum, E., & Post, M. (2016) · American Journal of Respiratory and Critical Care Medicine · doi:10.1164/rccm.201509-1838oc · Cited by 46
Clarke, D., Vegiopoulos, A., Crawford, A., Mucenski, M. L., Bonifer, C., & Frampton, J. (2000) · Oncogene · doi:10.1038/sj.onc.1203661 · Cited by 42
Bigley, V., & Collin, M. (2011) · Haematologica · doi:10.3324/haematol.2011.048355 · Cited by 40
Veen, T., Hjernquist, M. B., Wilgenburg, S. L. V., Hobson, K. A., Folmer, E. O., Font, L., & Klaassen, M. (2014) · PLoS ONE · doi:10.1371/journal.pone.0098075 · Cited by 30
Handbook of macrophages : life cycle, functions and diseases
Takahashi, R., & Kai, H. (2012) · Nova Science Publishers eBooks · Cited by 11
Cited by
Sorted by citations
Haenseler, W., Sansom, S. N., Buchrieser, J., Newey, S. E., Moore, C. S., Nicholls, F. J., Chintawar, S., Schnell, C., Antel, J. P., Allen, N. D., et al. (2017) · Stem Cell Reports · doi:10.1016/j.stemcr.2017.05.017 · Cited by 593
Self-citationModeling Steatohepatitis in Humans with Pluripotent Stem Cell-Derived Organoids
Ouchi, R., Togo, S., Kimura, M., Shinozawa, T., Koido, M., Koike, H., Thompson, W., Karns, R. A., Mayhew, C. N., McGrath, P. S., et al. (2019) · Cell Metabolism · doi:10.1016/j.cmet.2019.05.007 · Cited by 537
Xu, R., Boreland, A. J., Li, X., Erickson, C., Jin, M., Atkins, C., Pang, Z. P., Daniels, B. P., & Jiang, P. (2021) · Stem Cell Reports · doi:10.1016/j.stemcr.2021.06.011 · Cited by 229
Malainou, C., Abdin, S. M., Lachmann, N., Matt, U., & Herold, S. (2023) · Journal of Clinical Investigation · doi:10.1172/jci170501 · Cited by 215
Xu, R., Li, X., Boreland, A. J., Posyton, A., Kwan, K. Y., Hart, R. P., & Jiang, P. (2020) · Nature Communications · doi:10.1038/s41467-020-15411-9 · Cited by 200
Metadata
- Authors
- Buchrieser, J., James, W., & Moore, M. D.
- Affiliations
- University of Oxford (GB)
- Corresponding author
- Buchrieser, Julian
- Venue
- Stem Cell Reports
- Publisher
- Elsevier BV
- Published
- 2017-02
- Volume
- 8
- Issue
- 2
- Pages
- 334-345
- ISSN
- 2213-6711 (ISSN-L)
- PMC
- PMC5312255
- OpenAlex
- W2575042032
- Cited by
- 215
- References
- 50
- Citations by year
- 2026: 24 · 2025: 18 · 2024: 27 · 2023: 19 · 2022: 25 · 2021: 26 · 2020: 30 · 2019: 15 · 2018: 22 · 2017: 9
- FWCI
- 8.49
- Type
- journal article
- Language
- en
- Open access
- gold
- doi.org
- Licence
- Locations
- Stem Cell Reports (publishedVersion, cc-by)
- PubMed Central (publishedVersion, cc-by)
- PubMed (publishedVersion)
- DOAJ (DOAJ: Directory of Open Access Journals) (submittedVersion, cc-by-sa)
- Funders
- Parkinson's UK (2581970, SC037554)
- Research Councils UK
- Wellcome Trust (WTISSF121302)
- National Institute for Health and Care Research (090532/Z/09/Z.)
- Medical Research Council
- Topics
- Life Sciences › Biochemistry, Genetics and Molecular Biology › Molecular Biology › Pluripotent Stem Cells Research
- Health Sciences › Medicine › Hematology › Hematopoietic Stem Cell Transplantation
- Life Sciences › Immunology and Microbiology › Immunology › Immune cells in cancer
- Keywords
- tissue-resident macrophages, iPSC-derived macrophages, macrophage ontogeny, hematopoietic development, RUNX1, yolk sac macrophages, microglia, Kupffer cells, Langerhans cells, alveolar macrophages, kidney macrophages, monocytes, CRISPR/Cas9 knockout
- MeSH terms
- Proto-Oncogene Protein Spi-1, Cell Differentiation, Cell Line, Erythrocytes, Granulocytes, Hematopoietic Stem Cells, Humans, Macrophages, Monocytes, Organ Specificity, Phenotype, Proto-Oncogene Proteins, Biomarkers, Trans-Activators, Gene Expression, Gene Expression Regulation, Developmental, Genes, myb, Core Binding Factor Alpha 2 Subunit, Gene Knockout Techniques, Induced Pluripotent Stem Cells, Embryoid Bodies
About these checks
Registry, retraction, Cites and statistics results are computed, not judged, with one exception: a printed reference that no index lists is read once by a model before it counts as a citation error. Claims are extracted by a model and kept only when their quote appears verbatim in the text; each cited source is then checked, with a model’s help, for whether it says what the claim relies on. Those verdicts can be wrong — read the claim’s quote and the cited source before relying on one.
Statistics and arithmetic are recomputed, not judged.
Confidence bands are shown only for fields calibrated on our annotated test set. None is calibrated yet, so no band is shown.
What counts as a claim ›How we measure confidence ›How we check this ›
Are you an author, or do you see a problem with this page? Request a review
