

The DOI matches its Crossref record; 12 of the 12 references it cites were found in a registry or an index.
Divergent Effects of Dnmt3a and Tet2 Mutations on Hematopoietic Progenitor Cell Fitness
Overview
The claims and statistics of this paper haven’t been checked yet.
Run the check — free, no account needed. It reads the open-access text and checks the sources it cites.
Integrity signals
Registry
Cites
Statistics
Figures
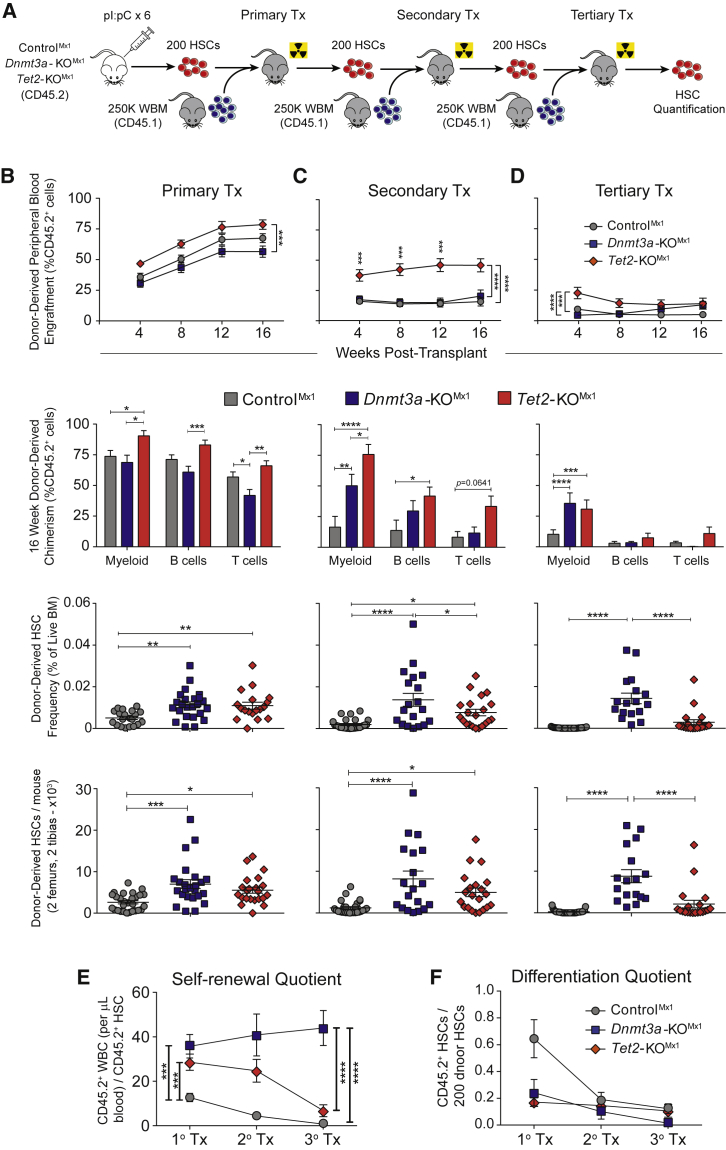
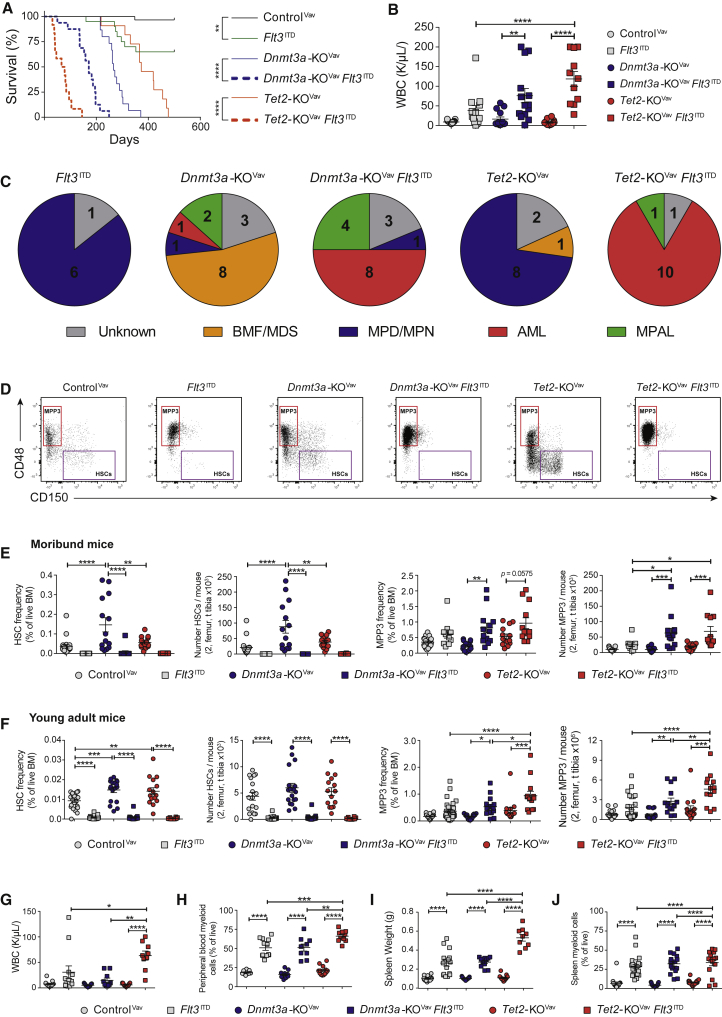
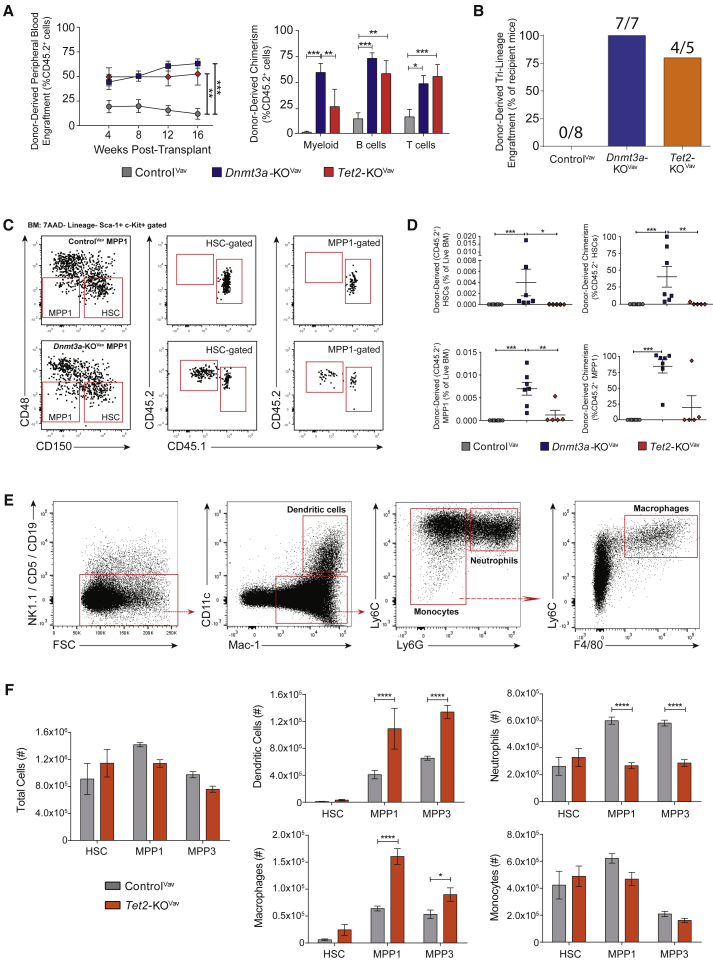
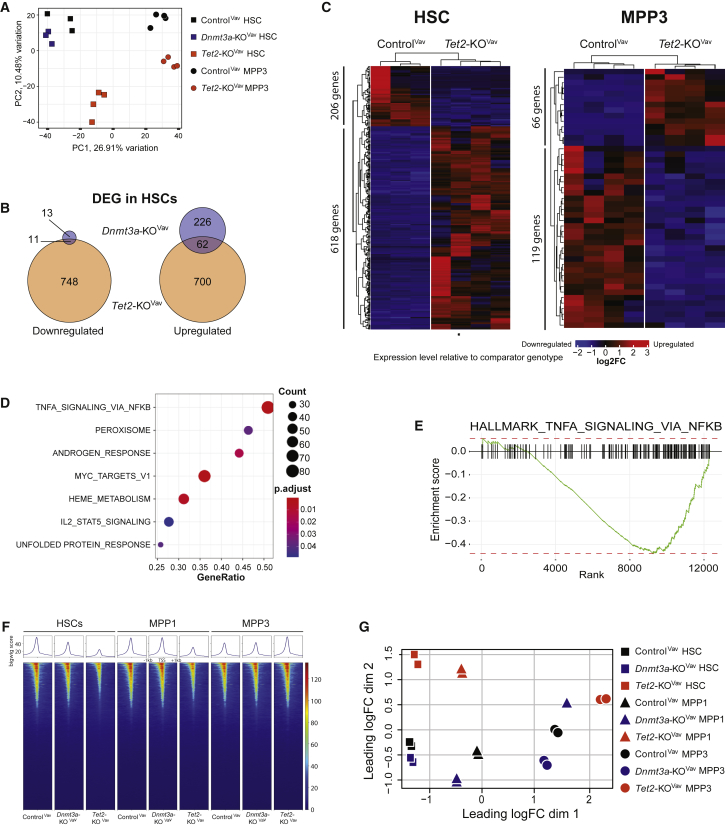
Verification
Claims the paper makes
The claims and statistics of this paper haven’t been checked yet.
Run the check — free, no account needed. It reads the open-access text and checks the sources it cites.
Claims other papers make about this one
Each is checked against this paper’s own text: does it say what the citing paper says it does?
In the citing paper
“Further, we identified a strong enrichment of the transcriptional signature specific to old HSCs25 and AP-1 members (Jun, Jund, Fos, Fosb) which are downstream of IL1β and other pro-inflammatory signaling at steady state48 and were exaggerated by IL1β stimulation in Tet2-KO HSCs relative to WT, suggesting Tet2-KO cells are primed to respond to pro-inflammatory stimulation.”
From Clonal hematopoiesis related TET2 loss-of-function impedes IL1β-mediated epigenetic reprogramming in hematopoietic stem and progenitor cells (2023) · cites this paper as [48]
In the citing paper
“Similarly, Tet2−/− and Tet2+/− HSCs have a competitive advantage in transplantation assays.39,40,41,42,43”
From Selective advantage of mutant stem cells in human clonal hematopoiesis is associated with attenuated response to inflammation and aging (2024) · cites this paper as [43]
Self-check
Percentages, sums and reported differences re-computed from the paper’s own numbers.
The self-check needs the paper’s full text.
Citations
Cites
Genomic and Epigenomic Landscapes of Adult De Novo Acute Myeloid Leukemia
The Cancer Genome Atlas Research Network (2013) · New England Journal of Medicine · doi:10.1056/nejmoa1301689 · Cited by 5,078
Age-related clonal hematopoiesis associated with adverse outcomes
Jaiswal, S., Fontanillas, P., Flannick, J., Manning, A., Grauman, P. V., Mar, B. G., Lindsley, R. C., Mermel, C. H., Burtt, N., Chavez, A., et al. (2014) · New England Journal of Medicine · doi:10.1056/nejmoa1408617 · Cited by 4,841
Clonal hematopoiesis and blood-cancer risk inferred from blood DNA sequence
Genovese, G., Kähler, A. K., Handsaker, R. E., Lindberg, J., Rose, S. A., Bakhoum, S. F., Chambert, K., Mick, E., Neale, B. M., Fromer, M., et al. (2014) · New England Journal of Medicine · doi:10.1056/nejmoa1409405 · Cited by 3,531
Figueroa, M. E., Abdel-Wahab, O., Lu, C., Ward, P. S., Patel, J., Shih, A., Li, Y., Bhagwat, N., Vasanthakumar, A., Fernandez, H. F., et al. (2010) · Cancer Cell · doi:10.1016/j.ccr.2010.11.015 · Cited by 2,766
Hematopoiesis: An Evolving Paradigm for Stem Cell Biology
Orkin, S. H., & Zon, L. I. (2008) · Cell · doi:10.1016/j.cell.2008.01.025 · Cited by 2,570
Identification of pre-leukaemic haematopoietic stem cells in acute leukaemia
Shlush, L. I., Zandi, S., Mitchell, A., Chen, W. C., Brandwein, J. M., Gupta, V., Kennedy, J. A., Schimmer, A. D., Schuh, A. C., Yee, K. W., et al. (2014) · Nature · doi:10.1038/nature13038 · Cited by 1,443
Tet2 loss leads to increased hematopoietic stem cell self-renewal and myeloid transformation
Moran-Crusio, K., Reavie, L., Shih, A., Abdel-Wahab, O., Ndiaye-Lobry, D., Lobry, C., Figueroa, M. E., Vasanthakumar, A., Patel, J., Zhao, X., et al. (2011) · Cancer Cell · doi:10.1016/j.ccr.2011.06.001 · Cited by 1,339
Prediction of acute myeloid leukaemia risk in healthy individuals
Abelson, S., Collord, G., Ng, S. W. K., Weissbrod, O., Mendelson Cohen, N., Niemeyer, E., Barda, N., Zuzarte, P. C., Heisler, L., Sundaravadanam, Y., et al. (2018) · Nature · doi:10.1038/s41586-018-0317-6 · Cited by 850
Clonal haematopoiesis harbouring AML-associated mutations is ubiquitous in healthy adults
Young, A. L., Challen, G. A., Birmann, B. M., & Druley, T. E. (2016) · Nature Communications · doi:10.1038/ncomms12484 · Cited by 692
Buscarlet, M., Provost, S., Zada, Y. F., Barhdadi, A., Bourgoin, V., Lépine, G., Mollica, L., Szuber, N., Dubé, M.-P., & Busque, L. (2017) · Blood · doi:10.1182/blood-2017-04-777029 · Cited by 383
Research works printed but not linked: 18
- Buscarlet, 2018, Lineage restriction analyses in CHIP indicate myeloid bias for TET2 and multipotent stem cell origin for DNMT3A, Blood, 132, 277, 10.1182/blood-2018-01-829937 · DOI · Paper page
- Celik, 2018, JARID2 functions as a tumor suppressor in myeloid neoplasms by repressing self-renewal in hematopoietic progenitor cells, Cancer Cell, 34, 741, 10.1016/j.ccell.2018.10.008 · DOI
- Challen, 2012, Dnmt3a is essential for hematopoietic stem cell differentiation, Nat. Genet., 44, 23, 10.1038/ng.1009 · DOI · Paper page
- Challen, 2014, Dnmt3a and Dnmt3b have overlapping and distinct functions in hematopoietic stem cells, Cell Stem Cell, 15, 350, 10.1016/j.stem.2014.06.018 · DOI · Paper page
- Corces, 2017, An improved ATAC-seq protocol reduces background and enables interrogation of frozen tissues, Nat. Methods, 14, 959, 10.1038/nmeth.4396 · DOI · Paper page
- Georgiades, 2002, VavCre transgenic mice: a tool for mutagenesis in hematopoietic and endothelial lineages, Genesis, 34, 251, 10.1002/gene.10161 · DOI
- Kaneda, 2004, Essential role for de novo DNA methyltransferase Dnmt3a in paternal and maternal imprinting, Nature, 429, 900, 10.1038/nature02633 · DOI
- Koh, 2011, Tet1 and Tet2 regulate 5-hydroxymethylcytosine production and cell lineage specification in mouse embryonic stem cells, Cell Stem Cell, 8, 200, 10.1016/j.stem.2011.01.008 · DOI · Paper page
- Kramer, 2017, Dnmt3a regulates T-cell development and suppresses T-ALL transformation, Leukemia, 31, 2479, 10.1038/leu.2017.89 · DOI · Paper page
- Kuhn, 1995, Inducible gene targeting in mice, Science, 269, 1427, 10.1126/science.7660125 · DOI · Paper page
- Lee, 2007, FLT3 mutations confer enhanced proliferation and survival properties to multipotent progenitors in a murine model of chronic myelomonocytic leukemia, Cancer Cell, 12, 367, 10.1016/j.ccr.2007.08.031 · DOI
- Li, 2011, Deletion of Tet2 in mice leads to dysregulated hematopoietic stem cells and subsequent development of myeloid malignancies, Blood, 118, 4509, 10.1182/blood-2010-12-325241 · DOI · Paper page
- Mallaney, 2019, Kdm6b regulates context-dependent hematopoietic stem cell self-renewal and leukemogenesis, Leukemia, 33, 2506, 10.1038/s41375-019-0462-4 · DOI · Paper page
- Okano, 1999, DNA methyltransferases Dnmt3a and Dnmt3b are essential for de novo methylation and mammalian development, Cell, 99, 247, 10.1016/S0092-8674(00)81656-6 · DOI · Paper page
- Sardina, 2018, Transcription factors drive tet2-mediated enhancer demethylation to reprogram cell fate, Cell Stem Cell, 23, 905, 10.1016/j.stem.2018.11.001 · DOI
- Spencer, 2017, CpG island hypermethylation mediated by DNMT3A is a consequence of AML progression, Cell, 168, 801, 10.1016/j.cell.2017.01.021 · DOI · Paper page
- Wang, 2018, TET2 coactivates gene expression through demethylation of enhancers, Sci. Adv., 4, eaau6986, 10.1126/sciadv.aau6986 · DOI
- Xie, 2014, Age-related mutations associated with clonal hematopoietic expansion and malignancies, Nat. Med., 20, 1472, 10.1038/nm.3733 · DOI · Paper page
Cited by
Clonal Hematopoiesis: Mechanisms Driving Dominance of Stem Cell Clones
Challen, G., & Goodell, M. A. (2020) · Blood · doi:10.1182/blood.2020006510 · Cited by 131
Self-citationJakobsen, N. A., Turkalj, S., Zeng, A. G. X., Stoilova, B., Metzner, M., Rahmig, S., Nagree, M. S., Shah, S., Moore, R., Usukhbayar, B., et al. (2024) · Cell Stem Cell · doi:10.1016/j.stem.2024.05.010 · Cited by 130
Clonal hematopoiesis: Mutation-specific adaptation to environmental change
Florez, M. A., Tran, B. T., Wathan, T. K., DeGregori, J., Pietras, E. M., & King, K. Y. (2022) · Cell Stem Cell · doi:10.1016/j.stem.2022.05.006 · Cited by 129
McClatchy, J., Strogantsev, R., Wolfe, E., Lin, H. Y., Mohammadhosseini, M., Davis, B. A., Eden, C., Goldman, D., Fleming, W. H., Conley, P., et al. (2023) · Nature Communications · doi:10.1038/s41467-023-43697-y · Cited by 95
Metadata
- Authors
- Ostrander, E. L., Kramer, A. C., Mallaney, C., Celik, H., Koh, W. K., Fairchild, J., Haussler, E., Zhang, C. R. C., & Challen, G. A.
- Venue
- Stem Cell Reports
- Publisher
- Elsevier BV
- Published
- 2020-04
- Volume
- 14
- Issue
- 4
- Pages
- 551-560
- ISSN
- 2213-6711
- PMC
- PMC7160307
- Cited by
- 94
- References
- 12
- Language
- en
- Licence
- Funders
- National Institutes of Health
- Gabrielle’s Angel Foundation for Cancer Research
- American Society of Hematology
- Leukemia and Lymphoma Society
- Longer Life Foundation
- Edward P. Evans Foundation
- Edward Mallinckrodt, Jr. Foundation
- National Institute of Diabetes and Digestive and Kidney Diseases
About these checks
Registry, retraction, Cites and statistics results are computed, not judged, with one exception: a printed reference that no index lists is read once by a model before it counts as a citation error. Claims are extracted by a model and kept only when their quote appears verbatim in the text; each cited source is then checked, with a model’s help, for whether it says what the claim relies on. Those verdicts can be wrong — read the claim’s quote and the cited source before relying on one.
Statistics and arithmetic are recomputed, not judged.
Confidence bands are shown only for fields calibrated on our annotated test set. None is calibrated yet, so no band is shown.
What counts as a claim ›How we measure confidence ›How we check this ›
Are you an author, or do you see a problem with this page? Request a review
