

The DOI matches its Crossref record; 56 of the 58 references it cites were found in a registry or an index.
Comprehensive analysis of T cell immunodominance and immunoprevalence of SARS-CoV-2 epitopes in COVID-19 cases
Open accessPublished version of a preprint
Abstract
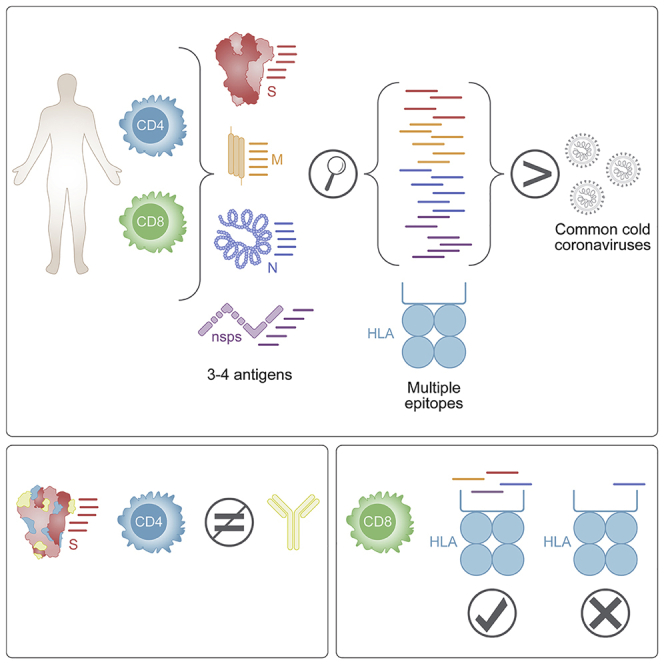
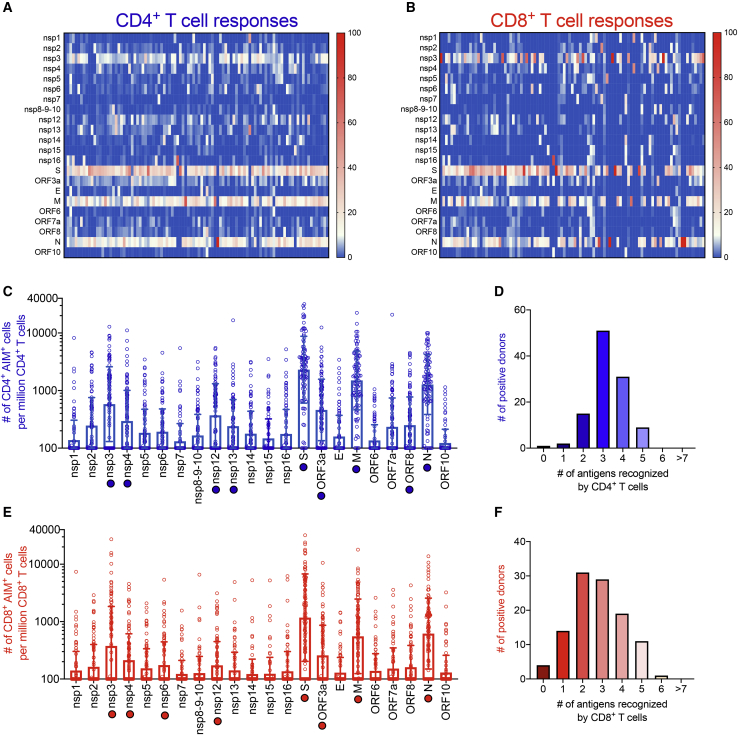
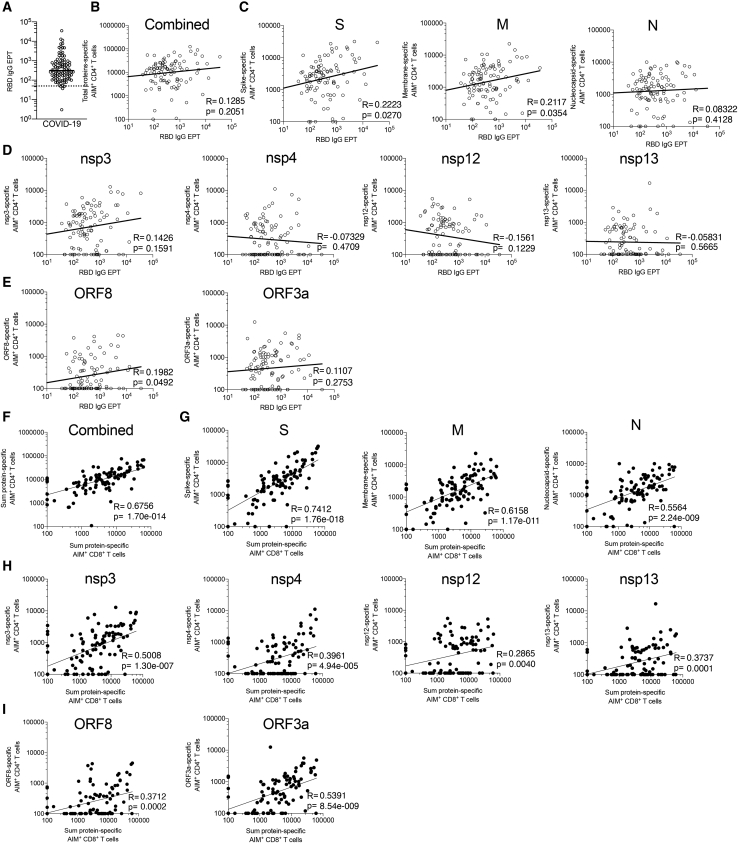
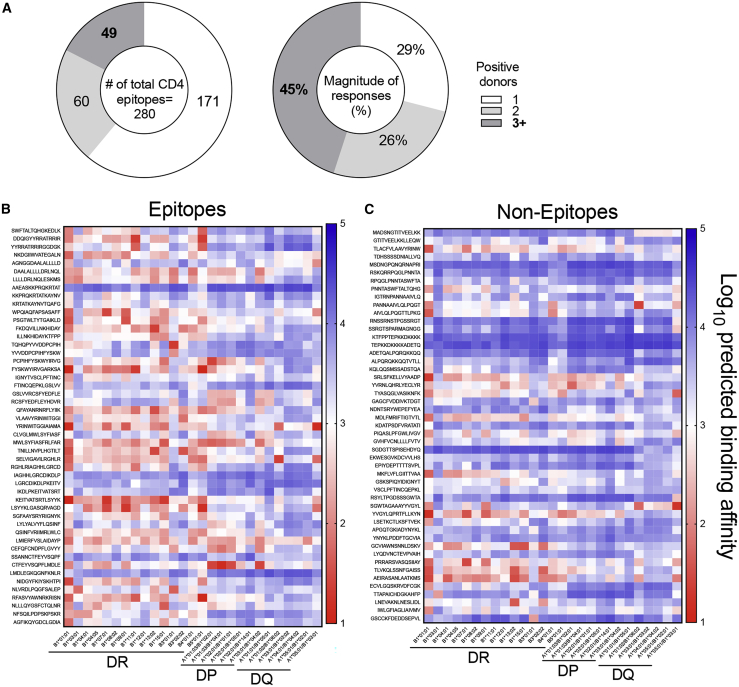
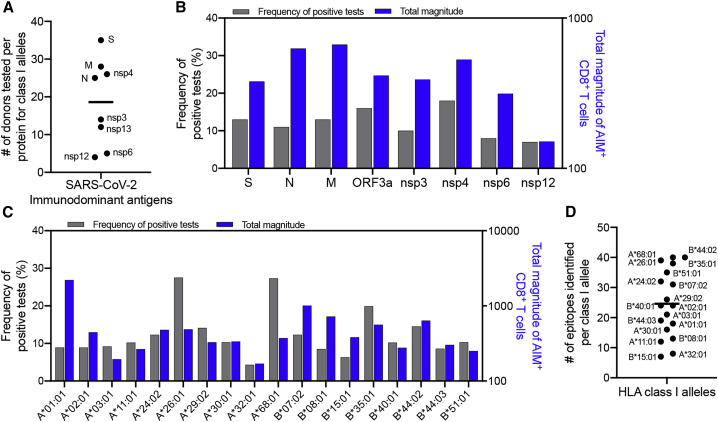
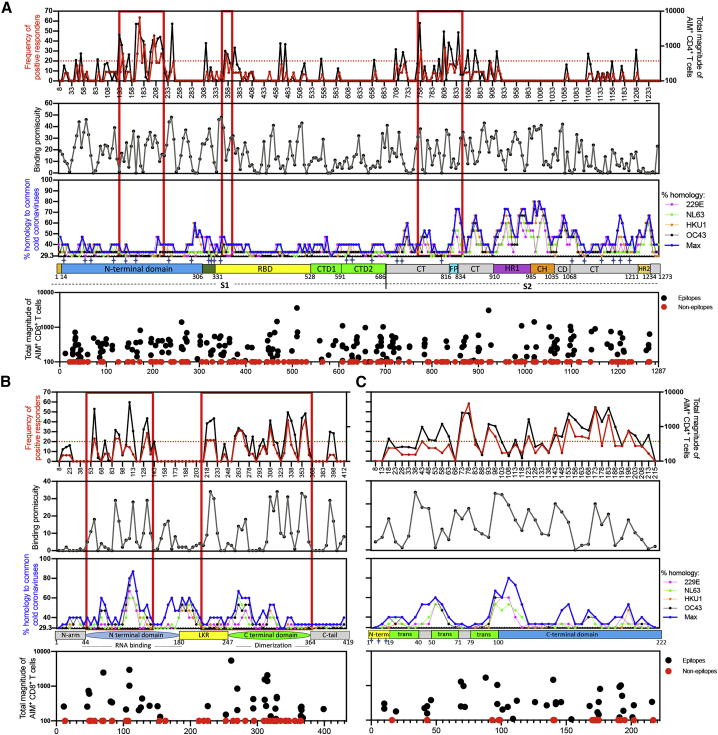
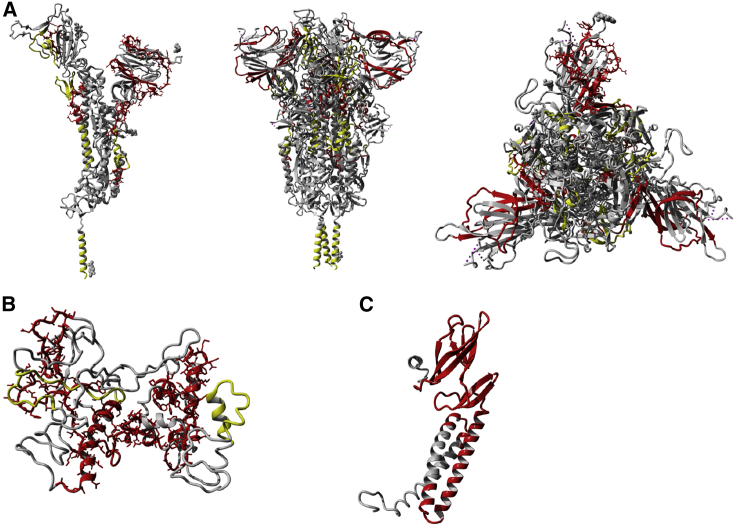
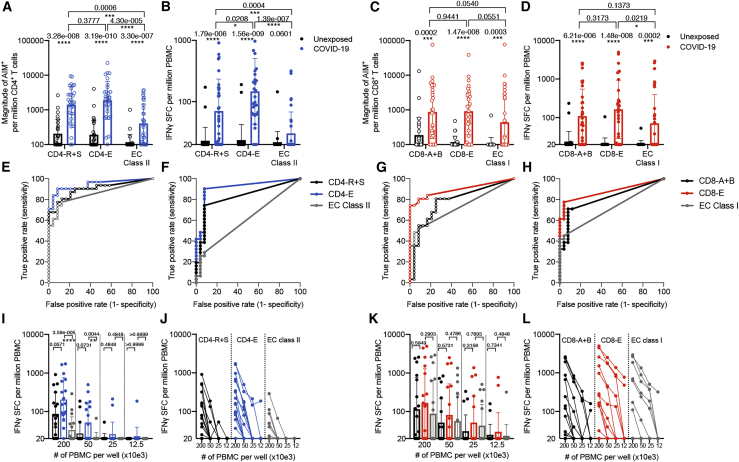
T cells are involved in control of SARS-CoV-2 infection. To establish the patterns of immunodominance of different SARS-CoV-2 antigens and precisely measure virus-specific CD4 + and CD8 + T cells, we study epitope-specific T cell responses of 99 convalescent coronavirus disease 2019 (COVID-19) cases. The SARS-CoV-2 proteome is probed using 1,925 peptides spanning the entire genome, ensuring an unbiased coverage of human leukocyte antigen (HLA) alleles for class II responses. For HLA class I, we study an additional 5,600 predicted binding epitopes for 28 prominent HLA class I alleles, accounting for wide global coverage. We identify several hundred HLA-restricted SARS-CoV-2-derived epitopes. Distinct patterns of immunodominance are observed, which differ for CD4 + T cells, CD8 + T cells, and antibodies. The class I and class II epitopes are combined into epitope megapools to facilitate identification and quantification of SARS-CoV-2-specific CD4 + and CD8 + T cells.
Overview
The claims and statistics of this paper haven’t been checked yet.
Run the check — free, no account needed. It reads the open-access text and checks the sources it cites.
Integrity signals
Registry
Cites
Statistics
Figures
Verification
Claims the paper makes
The claims and statistics of this paper haven’t been checked yet.
Run the check — free, no account needed. It reads the open-access text and checks the sources it cites.
Claims other papers make about this one
Each is checked against this paper’s own text: does it say what the citing paper says it does?
The source backs part of the claim, not all of it — or backs it for a different population, condition or comparison.
In the citing paper
“Using HLA class I and II predicted peptide “megapools,” circulating SARS-CoV-2-specific CD8+ and CD4+ T cells were identified in COVID-19 acute, mild and convalescent patients [110, 118-125].”
From Guidelines for the use of flow cytometry and cell sorting in immunological studies (third edition) (2021) · cites this paper as [121]
Experimental — accuracy not yet measuredIn the citing paper
“509 (97.3%) within the B.1.351 and P.1 variants”
From Impact of SARS-CoV-2 variants on the total CD4+ and CD8+ T cell reactivity in infected or vaccinated individuals (2021) · cites this paper as [51]
In the citing paper
“the T cell responses against SARS-CoV-2 are highly multi-antigenic and multi-specific, with tens of different epitopes recognized by CD4+ and CD8+ T cells in a given individual.”
From Impact of SARS-CoV-2 variants on the total CD4+ and CD8+ T cell reactivity in infected or vaccinated individuals (2021) · cites this paper as [51]
In the citing paper
“509 (97.3%) within the B.1.351 and P.1 variants”
From Impact of SARS-CoV-2 variants on the total CD4+ and CD8+ T cell reactivity in infected or vaccinated individuals (2021) · cites this paper as [51]
In the citing paper
“508 (97.1%) of these 523 CD8+ T cell epitopes are totally conserved within the B.1.1.7 variant”
From Impact of SARS-CoV-2 variants on the total CD4+ and CD8+ T cell reactivity in infected or vaccinated individuals (2021) · cites this paper as [51]
In the citing paper
“512 (97.9%) within the CAL.20C variant”
From Impact of SARS-CoV-2 variants on the total CD4+ and CD8+ T cell reactivity in infected or vaccinated individuals (2021) · cites this paper as [51]
Self-check
Percentages, sums and reported differences re-computed from the paper’s own numbers.
The self-check needs the paper’s full text.
Citations
Cites
Protein structure prediction on the Web: a case study using the Phyre server
Kelley, L. A., & Sternberg, M. J. E. (2009) · Nature Protocols · doi:10.1038/nprot.2009.2 · Cited by 4,154
Grifoni, A., Weiskopf, D., Ramirez, S. I., Mateus, J., Dan, J. M., Moderbacher, C. R., Rawlings, S. A., Sutherland, A., Premkumar, L., Jadi, R. S., et al. (2020) · Cell · doi:10.1016/j.cell.2020.05.015 · Cited by 3,595
Self-citationThe Immune Epitope Database (IEDB): 2018 update
Vita, R., Mahajan, S., Overton, J. A., Dhanda, S. K., Martini, S. R., Cantrell, J. R., Wheeler, D. K., Sette, A., & Peters, B. (2018) · Nucleic Acids Research · doi:10.1093/nar/gky1006 · Cited by 2,194
Self-citationSARS-CoV-2-specific T cell immunity in cases of COVID-19 and SARS, and uninfected controls
Le Bert, N., Tan, A. T., Kunasegaran, K., Tham, C. Y. L., Hafezi, M., Chia, A., Chng, M. H. Y., Lin, M., Tan, N., Linster, M., et al. (2020) · Nature · doi:10.1038/s41586-020-2550-z · Cited by 1,887
Rydyznski Moderbacher, C., Ramirez, S. I., Dan, J. M., Grifoni, A., Hastie, K. M., Weiskopf, D., Belanger, S., Abbott, R. K., Kim, C., Choi, J., et al. (2020) · Cell · doi:10.1016/j.cell.2020.09.038 · Cited by 1,790 · cited 3×
“A growing body of evidence points to a key role for SARS-CoV2-specific T cell responses in COVID-19 disease resolution and modulation of disease severity.(2,6,9) Milder cases of acute COVID-19 were associated with coordinated antibody, CD4 and CD8 T cell responses, whereas severe cases correlated with a lack of coordi…”
InfluentialSelf-citationRobust T Cell Immunity in Convalescent Individuals with Asymptomatic or Mild COVID-19
Sekine, T., Perez-Potti, A., Rivera-Ballesteros, O., Strålin, K., Gorin, J.-B., Olsson, A., Llewellyn-Lacey, S., Kamal, H., Bogdanovic, G., Muschiol, S., et al. (2020) · Cell · doi:10.1016/j.cell.2020.08.017 · Cited by 1,788
Jurtz, V. I., Paul, S., Andreatta, M., Marcatili, P., Peters, B., & Nielsen, M. (2017) · The Journal of Immunology · doi:10.4049/jimmunol.1700893 · Cited by 1,476
Self-citationSARS-CoV-2-reactive T cells in healthy donors and patients with COVID-19
Braun, J., Loyal, L., Frentsch, M., Wendisch, D., Georg, P., Kurth, F., Hippenstiel, S., Dingeldey, M., Kruse, B., Fauchere, F., et al. (2020) · Nature · doi:10.1038/s41586-020-2598-9 · Cited by 1,310
Distinct conformational states of SARS-CoV-2 spike protein
Cai, Y., Zhang, J., Xiao, T., Peng, H., Sterling, S. M., Walsh, R. M., Rawson, S., Rits-Volloch, S., & Chen, B. (2020) · Science · doi:10.1126/science.abd4251 · Cited by 1,221
Peng, Y., Mentzer, A. J., Liu, G., Yao, X., Yin, Z., Dong, D., Dejnirattisai, W., Rostron, T., Supasa, P., Liu, C., et al. (2020) · Nature Immunology · doi:10.1038/s41590-020-0782-6 · Cited by 1,179
Cited by
Sorted by citations
Items 301–400 of 539
Huang, R., Ying, L., Wang, J., Xia, J. L., Zhang, Y., Mao, H., Zhang, R., Zang, R., Le, Z., Shu, Q., et al. (2023) · Frontiers in Immunology · doi:10.3389/fimmu.2023.1139620 · Cited by 9
Soni, M., Migliori, E., Fu, J., Assal, A., Chan, H. T., Pan, J., Khatiwada, P., Ciubotariu, R., May, M. S., Pereira, M. R., et al. (2023) · Frontiers in Immunology · doi:10.3389/fimmu.2023.1212203 · Cited by 12
Zhang, D., Kukkar, D., Kim, K., & Bhatt, P. (2024) · International Journal of Biological Macromolecules · doi:10.1016/j.ijbiomac.2024.129284 · Cited by 6
A Structural Voyage Toward the Landscape of Humoral and Cellular Immune Escapes of SARS ‐ CoV ‐2
Liu, J., Wu, Y., & Gao, G. F. (2025) · Immunological Reviews · doi:10.1111/imr.70000 · Cited by 8
Understanding COVID-19 Vaccines Today: Are T-cells Key Players?
Shafqat, A., Arabi, T. Z., Sabbah, B. N., Abdulkader, H. S., Shafqat, S., Razak, A., Kashir, J., AlKattan, K. M., & Yaqinuddin, A. (2022) · Vaccines · doi:10.3390/vaccines10060904 · Cited by 8
Parn, S., Savsani, K., & Dakshanamurthy, S. (2022) · ImmunoInformatics · doi:10.1016/j.immuno.2022.100020 · Cited by 8
Li, L., Gao, M., Li, J., Xie, X., Zhao, H., Wang, Y., Xu, X., Zu, S., Chen, C., Wan, D., et al. (2022) · EBioMedicine · doi:10.1016/j.ebiom.2022.104401 · Cited by 8
Clonal structure and the specificity of vaccine-induced T cell response to SARS-CoV-2 Spike protein
Sheetikov, S. A., Khmelevskaya, A. A., Zornikova, K. V., Zvyagin, I. V., Shomuradova, A. S., Serdyuk, Y. V., Shakirova, N. T., Peshkova, I. O., Titov, A., Romaniuk, D. S., et al. (2024) · Frontiers in Immunology · doi:10.3389/fimmu.2024.1369436 · Cited by 8
Picture of the Favourable Immune Profile Induced by Anti-SARS-CoV-2 Vaccination
Lanuti, P., Rossi, C., Cicalini, I., Pierdomenico, L., Damiani, V., Semeraro, D., Verrocchio, S., Boccio, P. D., Evangelista, A., Sarra, A., et al. (2021) · Biomedicines · doi:10.3390/biomedicines9081035 · Cited by 8
Stamatakis, G. M., Samiotaki, M. K., Temponeras, I., Panayotou, G., & Stratikos, E. (2021) · Journal of Biological Chemistry · doi:10.1016/j.jbc.2021.101329 · Cited by 7
Arslan, F., Goren, B. I., Baysal, B., & Vahaboğlu, H. (2021) · Expert Review of Vaccines · doi:10.1080/14760584.2022.2012457 · Cited by 8
Jiang, C., Jiang, K., Li, X., Zhang, N., Zhu, W., Meng, L., Zhang, Y., & Lu, S. (2022) · Journal of Pharmaceutical Analysis · doi:10.1016/j.jpha.2022.10.003 · Cited by 7
Mahalingam, S. S., Jayaraman, S., Arunkumar, A., Dudley, H. M., Anthony, D. D., Shive, C. L., Jacobson, J. M., & Pandiyan, P. (2023) · Frontiers in Immunology · doi:10.3389/fimmu.2023.1231087 · Cited by 7
Technology Revolution in Learning: Building the Future of Education
Meisuri, M., Nuswantoro, P., Mardikawati, B., & Judijanto, L. (2023) · Journal of Social Science Utilizing Technology · doi:10.55849/jssut.v1i4.660 · Cited by 8
SARS-CoV-2 Spike-Derived Peptides Presented by HLA Molecules
Nguyen, A., Szeto, C. W., Jayasinghe, D., Lobos, C. A., Halim, H., Chatzileontiadou, D. S. M., Grant, E. J., & Gras, S. (2021) · Biophysica · doi:10.3390/biophysica1020015 · Cited by 10
Next-generation probiotic Bacteroides. dorei: Improving the efficacy of COVID-19 vaccinations
He, S., Lu, S., Huang, Y., Song, L., Yang, T., Xiao, Y., & Ren, Z. (2024) · Journal of Functional Foods · doi:10.1016/j.jff.2024.106190 · Cited by 7
Decreased progenitor TCF1 + T-cells correlate with COVID-19 disease severity
Tu, T. H., Grunbaum, A., Santinon, F., Kazanova, A., Rozza, N., Kremer, R. B., Mihalcioiu, C. L. D., & Rudd, C. E. (2024) · Communications Biology · doi:10.1038/s42003-024-05922-2 · Cited by 7
Hojo-Souza, N. S., de Castro, J. T., Rivelli, G. G., de Azevedo, P. O., Oliveira, E. R., Faustino, L., Salazar, N., Bagno, F. F., de Carvalho, A. F., Rattis, B. A. D. C., et al. (2024) · Vaccine · doi:10.1016/j.vaccine.2024.126394 · Cited by 7
Design of a Multi-Valent SARS-CoV-2 Peptide Vaccine for Broad Immune Protection via Deep Learning
Feng, Z., Pang, X., Xu, Q., Gu, Z., Li, S., Zhu, L., & Li, H. (2025) · Engineering · doi:10.1016/j.eng.2025.04.025 · Cited by 7
Evaluation of an RBD-nucleocapsid fusion protein as a booster candidate for COVID-19 vaccine
Valiate, B. V. S., de Castro, J. T., Marçal, T. G., Andrade, L. A. F., Oliveira, L. I., MAIA, G. B. F., Faustino, L., Hojo-Souza, N. S., dos Reis, M. A. A., Bagno, F. F., et al. (2024) · iScience · doi:10.1016/j.isci.2024.110177 · Cited by 7
Rastogi, A., Gautam, S., & Kumar, M. (2024) · Heliyon · doi:10.1016/j.heliyon.2024.e35129 · Cited by 8
Sariol, C. A., Serrano-Collazo, C., Ortiz, E. J., Pantoja, P., Cruz, L. A., Arana, T., Atehortua, D., Pabon-Carrero, C., & Espino, A. M. (2021) · Viruses · doi:10.3390/v13122405 · Cited by 6
Khaitan, A., Datta, D., Bond, C., Goings, M. J., Co, K., Odhiambo, E. O., Miller, L., Zhang, L., Beasley, S., Poorbaugh, J., et al. (2022) · ImmunoHorizons · doi:10.4049/immunohorizons.2200029 · Cited by 7
Rosa, C. L., Chiuppesi, F., Park, Y., Zhou, Q., Yang, D., Gendzekhadze, K., Ly, M., Li, J., Kaltcheva, T. I., Ortega‐Francisco, S., et al. (2023) · Frontiers in Immunology · doi:10.3389/fimmu.2023.1114131 · Cited by 7
Antunes, R. D. S., Grifoni, A., Frazier, A., Weiskopf, D., & Sette, A. (2023) · International Immunology · doi:10.1093/intimm/dxad014 · Cited by 8
Self-citationImmunogenicity and efficacy of a novel multi-patch SARS-CoV-2/COVID-19 vaccine candidate
Perdiguero, B., Marcos-Villar, L., López‐Bravo, M., Sánchez‐Cordón, P. J., Zamora, C., Valverde, J. R., Sorzano, C. Ó. S., Sin, L., Álvarez, E. A., Ramos, M., et al. (2023) · Frontiers in Immunology · doi:10.3389/fimmu.2023.1160065 · Cited by 8
Vivekanandam, R., Rajagopalan, K., Jeevanandam, M., Ganesan, H., Jagannathan, V., Christyraj, J. D. S., Kalishwaralal, K., Christyraj, J. R. S. S., & Mohan, M. (2021) · Journal of Biomolecular Structure and Dynamics · doi:10.1080/07391102.2021.1993338 · Cited by 7
Ruiz-Rodríguez, P., Francés-Gómez, C., Chiner‐Oms, Á., López, M. G., Jiménez-Serrano, S., Cancino‐Muñoz, I., Ruiz-Hueso, P., Torres‐Puente, M., Bracho, M. A., D’Auria, G., et al. (2021) · mBio · doi:10.1128/mbio.02315-21 · Cited by 8
Garushyants, S. K., Rogozin, I. B., & Koonin, E. V. (2021) · bioRxiv (Cold Spring Harbor Laboratory) · doi:10.1101/2021.04.23.441209 · Cited by 8
Painter, M. M., Johnston, T. S., Lundgreen, K. A., Santos, J. J. D. S., Qin, J. S., Goel, R. R., Apostolidis, S. A., Mathew, D., Fulmer, B., Williams, J. C., et al. (2023) · bioRxiv (Cold Spring Harbor Laboratory) · doi:10.1101/2023.02.05.527215 · Cited by 7
Self-citationGao, Z., Liu, X., Lei, Y., Shao, J., Zhang, G., Zhou, G., Zhou, G., Wu, J., Guo, H., Chang, H., et al. (2024) · Antiviral Research · doi:10.1016/j.antiviral.2024.106011 · Cited by 6
Gan, M., Cao, J., Zhang, Y., Fu, H., Lin, X., Ouyang, Q., Xu, X., Yuan, Y., & Fan, X. (2024) · Journal of Medical Virology · doi:10.1002/jmv.29452 · Cited by 6
Pinto, P. B. A., Timis, J., Chuensirikulchai, K., Li, Q. H., Lu, H.-H., Maule, E., Nguyen, M. N., Alves, R. P. D. S., Verma, S. K., Ana‐Sosa‐Batiz, F., et al. (2024) · npj Vaccines · doi:10.1038/s41541-024-01043-3 · Cited by 8
Bozkus, C. C., Brown, M., Velazquez, L. G., Thomas, M., Wilson, E. A., O’Donnell, T. J., Kaminska, A., Ruchnewitz, D., Geertz, D., Bykov, Y., et al. (2025) · iScience · doi:10.1016/j.isci.2025.113044 · Cited by 9
The T Cell Epitope Landscape of SARS-CoV-2 Variants of Concern
Tennøe, S., Gheorghe, M., Stratford, R., & Clancy, T. (2022) · Vaccines · doi:10.3390/vaccines10071123 · Cited by 5
Al‐Akioui‐Sanz, K., Pascual-Miguel, B., Díaz‐Almirón, M., Mestre‐Durán, C., Navarro‐Zapata, A., Villa, L. C., Martín-Cortázar, C., Vicario, J. L., Moreno, M. Á., Balas, A., et al. (2022) · Cytotherapy · doi:10.1016/j.jcyt.2022.12.001 · Cited by 5
Schnizer, C., Andreas, N., Vivas, W., Kamradt, T., Baier, M., Kiehntopf, M., Glöckner, S., Scherag, A., Löffler, B., Kolanos, S., et al. (2023) · Frontiers in Immunology · doi:10.3389/fimmu.2022.1095129 · Cited by 6
Somogyi, E., Kremlitzka, M., Csiszovszki, Z., Molnár, L., Lőrincz, O., Tóth, J., de Waal, L., Pattijn, S., Reineking, W., Beineke, A., et al. (2023) · Frontiers in Immunology · doi:10.3389/fimmu.2023.1111629 · Cited by 5
sCXCL16 as a prognostic biomarker for COVID‐19 outcome
Boukhalfa, Y., Stambouli, N., Driss, A., Daiki, M., Abouda, A., Razgallah, R., Gharsallah, H., Sellami, W., Abid, R., Hannachi, S., et al. (2023) · Journal of Medical Virology · doi:10.1002/jmv.28728 · Cited by 6
Fan, X., Song, J., Cao, W., Zhou, M., Yang, T., Wang, J., Meng, F.-P., Shi, M., Zhang, C., & Wang, F. (2024) · Viruses · doi:10.3390/v16071006 · Cited by 6
Mustajab, T., Kwamboka, M. S., Khan, I., Song, D., Lee, S., Han, K. R., Han, Y., Kim, J., & Chwae, Y. (2025) · Vaccine · doi:10.1016/j.vaccine.2025.127407 · Cited by 6
Macchia, I., Sorsa, V. L., Ciervo, A., Ruspantini, I., Negri, D. R. M., Borghi, M., Angelis, M. L. D., Luciani, F., Martina, A., Taglieri, S., et al. (2024) · Biomolecules · doi:10.3390/biom14101217 · Cited by 6
Deng, S., Xu, Z., Hu, J., Yang, Y., Zhu, F., Liu, Z., Zhang, H., Wu, S., & Jin, T. (2024) · Frontiers in Immunology · doi:10.3389/fimmu.2024.1468456 · Cited by 5
Barreto, A. S., de Franca, M. N. F., dos Reis, T. L. D. S., Silva, J. A. B. M., dos Santos, P. L., de Oliveira, F. A., da Silva, Â. M., Magalhães, L. S., Secco, D., de Andrade, M. C., et al. (2025) · Frontiers in Immunology · doi:10.3389/fimmu.2025.1540537 · Cited by 5
Self-citationAssessment of the cellular immunity response to the new coronavirus infection COVID-19
Lobov, A. V., Ivanova, P. I., Pogodina, E. A., Kazey, V. I., Maksimova, E. D., & Shubina, I. Z. (2021) · Russian Journal of Biotherapy · doi:10.17650/1726-9784-2021-20-4-10-17 · Cited by 5
Improved Survival of Lymphoma Patients with COVID-19 in the Modern Treatment and Vaccination Era
Pia, A. D., Zhao, C., Jandir, P., Gupta, A., Batistick, M., Kim, G. Y., Xia, Y., Ahn, J., Magarelli, G., Lukasik, B., et al. (2022) · Cancers · doi:10.3390/cancers14174252 · Cited by 5
Prospects of animal models and their application in studies on adaptive immunity to SARS-CoV-2
Wei, X., Rong, N., & Liu, J. (2022) · Frontiers in Immunology · doi:10.3389/fimmu.2022.993754 · Cited by 6
HLA-I and HLA-II Peptidomes of SARS-CoV-2: A Review
El‐Baky, N. A., Amara, A. A. A. F., & Redwan, E. M. M. M. (2023) · Vaccines · doi:10.3390/vaccines11030548 · Cited by 7
Mora‐Buch, R., Tomás‐Marín, M., Enrich, E., Antón-Iborra, M., Martorell, L., Valdivia, E., Lara‐de‐León, A. G., Aran, G., Pirón, M., Querol, S., et al. (2023) · Transplantation and Cellular Therapy · doi:10.1016/j.jtct.2023.06.001 · Cited by 5
Lee, J. S., Karthikeyan, D., Fini, M., Vincent, B. G., & Rubinsteyn, A. (2023) · Briefings in Bioinformatics · doi:10.1093/bib/bbad495 · Cited by 5
Wu, Y., Liu, X. K., Mao, Y., Ji, R., Xia, L., Zhou, Z., Ding, Y., Li, P., Zhao, Y., Peng, M., et al. (2024) · Journal of Translational Medicine · doi:10.1186/s12967-024-05062-5 · Cited by 5
Kakugawa, T., Mimura, Y., Mimura‐Kimura, Y., Doi, K., Ohteru, Y., Kakugawa, H., Oishi, K., Kakugawa, M., Hirano, T., & Matsunaga, K. (2024) · Immunity & Ageing · doi:10.1186/s12979-024-00444-1 · Cited by 6
Gangaev, A., van Sleen, Y., Brandhorst, N., Hoefakker, K., Prajapati, B., Singh, A. D., Boerma, A., van der Heiden, M., Oosting, S. F., van der Veldt, A. A. M., et al. (2024) · Frontiers in Immunology · doi:10.3389/fimmu.2024.1447555 · Cited by 5
The characteristics of TCR CDR3 repertoire in COVID-19 patients and SARS-CoV-2 vaccine recipients
Zhou, D., Luo, Y. Q., Ma, Q., Xu, Y., & Yao, X. (2024) · Virulence · doi:10.1080/21505594.2024.2421987 · Cited by 5
Abt, E. R., Lam, A. K., Noguchi, M., Rashid, K., McLaughlin, J., Teng, P.-L., Tran, W., Cheng, D., Nesterenko, P. A., Mao, Z., et al. (2024) · Proceedings of the National Academy of Sciences · doi:10.1073/pnas.2406332121 · Cited by 6
The protective immunity induced by SARS-CoV-2 infection and vaccination: a critical appraisal
Tosta, E. (2021) · Exploration of Immunology · doi:10.37349/ei.2021.00014 · Cited by 5
COVID-19 Pandemic: Escape of Pathogenic Variants and MHC Evolution
Pontarotti, P., & Paganini, J. (2022) · International Journal of Molecular Sciences · doi:10.3390/ijms23052665 · Cited by 5
Fernández‐Rivas, G., Barallat, J., Quirant‐Sánchez, B., González, V., Doladé, M., Martínez-Cáceres, E. M., Piña, M., Matlló, J., Blanco, I., & Cardona, P.-J. (2022) · Viruses · doi:10.3390/v14071385 · Cited by 5
SARS-CoV-2 Omicron (B.1.1.529) shows minimal neurotropism in a double-humanized mouse model
Alves, R. P. D. S., Wang, Y.-T., Mikulski, Z., McArdle, S., Shafee, N., Valentine, K. M., Miller, R., Verma, S. K., Ana‐Sosa‐Batiz, F., Maule, E., et al. (2023) · Antiviral Research · doi:10.1016/j.antiviral.2023.105580 · Cited by 5
Self-citationPostovskaya, A., Vujkovic, A., de Block, T., van Petersen, L., Frankenhuijsen, M. V., Brosius, I., Bottieau, E., Dijck, C. V., Theunissen, C., van Ierssel, S. H., et al. (2023) · Frontiers in Immunology · doi:10.3389/fimmu.2023.1130876 · Cited by 6
Asashima, H., Kim, D., Wang, K., Lele, N., Buitrago-Pocasangre, N., Lutz, R., Cruz, I., Raddassi, K., Ruff, W. E., Racke, M. K., et al. (2023) · JCI Insight · doi:10.1172/jci.insight.168102 · Cited by 5
Self-citationImmunology and controlling of coronaviruses; the current enemy for humanity: A review
Othman, S. I., Nayel, M. A., Alwaele, M. A., Alfassam, H. E., Abu-Taweel, G. M., Altoom, N. G., Almalki, A. M., Allam, A. A., Alturki, A. M., & El-Shabasy, R. M. (2021) · International Journal of Biological Macromolecules · doi:10.1016/j.ijbiomac.2021.10.216 · Cited by 5
Zhang, Y., Yang, Z., Tang, M., Li, H., Tang, T., Li, G., Zhong, Y., Zhang, X., Wang, X., & Wang, C. (2022) · Frontiers in Immunology · doi:10.3389/fimmu.2022.752622 · Cited by 5
Garushyants, S., Rogozin, I. B., & Koonin, E. V. (2021) · Research Square · doi:10.21203/rs.3.rs-456574/v1 · Cited by 5
Parn, S., Jabbour, G., Nguyenkhoa, V., & Dakshanamurthy, S. (2021) · bioRxiv (Cold Spring Harbor Laboratory) · doi:10.1101/2021.09.21.461301 · Cited by 5
Time-dependent contraction of the SARS-CoV-2–specific T-cell responses in convalescent individuals
Fernandes, E. R., Apostólico, J. D. S., Jacintho, L. C., Marin, M. L. C., Júnior, R. C. V. D. S., Rodrigues, H., Santos, K. S., Coelho, V. P. C. V., Boscardin, S. B., Kalil, J. E., et al. (2022) · Journal of Allergy and Clinical Immunology Global · doi:10.1016/j.jacig.2022.05.002 · Cited by 4
Live attenuated COVID-19 vaccines: approaches to development and prospects for clinical use
Korchevaya, E. R., Gracheva, A. V., Dyakov, I. N., Зверев, В. В., & Файзулоев, Е. Б. (2023) · Journal of microbiology epidemiology immunobiology · doi:10.36233/0372-9311-404 · Cited by 5
Chen, R., Fulton, K. M., Tran, A., Duque, D., Kovalchik, K. A., Caron, É., Twine, S. M., & Li, J. (2023) · Molecular & Cellular Proteomics · doi:10.1016/j.mcpro.2023.100645 · Cited by 4
Identification of conserved immunogenic peptides of SARS-CoV-2 nucleocapsid protein
Verma, J., Kaushal, N., Manish, M., Subbarao, N., Shakirova, V., Martynova, E., Liu, R.-Z., Hamza, S., Rizvanov, A., Khaiboullina, S., et al. (2023) · Journal of Biomolecular Structure and Dynamics · doi:10.1080/07391102.2023.2260484 · Cited by 5
Analysis of the immune response in COVID-19
Hromić‐Jahjefendić, A., & Aljabali, A. A. A. (2025) · Progress in molecular biology and translational science · doi:10.1016/bs.pmbts.2024.10.004 · Cited by 4
T cell receptor usage and epitope specificity amongst CD8+ and CD4+ SARS-CoV-2-specific T cells
Fahnøe, U., Feng, S., Underwood, A. P., Jacobsen, K., Ameri, A., Blicher, T. H., Sølund, C. S., Rosenberg, B. R., Brix, L., Weis, N. M., et al. (2025) · Frontiers in Immunology · doi:10.3389/fimmu.2025.1510436 · Cited by 4
Endemic coronavirus infection is associated with SARS-CoV-2 Fc receptor-binding antibodies
Bean, D. J., Liang, Y. M., Avila, F., He, X., Asundi, A., & Sagar, M. (2025) · Journal of Virology · doi:10.1128/jvi.00550-25 · Cited by 4
Reinfection by SARS-CoV-2: The first one in a family reported in Spain
Aguilar-Shea, A. L., Gutiérrez-Martín-Arroyo, J., Vacas-Córdoba, M., & Gallardo-Mayo, C. (2021) · Medicina Clínica (English Edition) · doi:10.1016/j.medcle.2021.04.010 · Cited by 4
Sсherbak, S. G., Vologzhanin, D. A., Голота, А. С., Kamilova, Т. A., & Макаренко, С. В. (2022) · Journal of clinical practice · doi:10.17816/clinpract106239 · Cited by 5
Prediction of the SARS-CoV-2 Derived T-Cell Epitopes’ Response Against COVID Variants
Tahir, H. A., Khan, M. S., Ahmed, F., Albarrak, A. M., Qasem, S. N., & Ahmad, J. (2023) · Computers, materials & continua/Computers, materials & continua (Print) · doi:10.32604/cmc.2023.035410 · Cited by 4
Ternette, N., Adamopoulou, E., & Purcell, A. W. (2023) · Seminars in Immunology · doi:10.1016/j.smim.2023.101780 · Cited by 4
Highly Networked SARS-CoV-2 Peptides Elicit T Cell Responses with Enhanced Specificity
Duette, G., Lee, E., Gomes, G. M. C., Tungatt, K., Doyle, C. M., Stylianou, V. V., Lee, A., Maddocks, S., Taylor, J., Khanna, R., et al. (2023) · ImmunoHorizons · doi:10.4049/immunohorizons.2300034 · Cited by 4
Structural Framework for Analysis of CD4+ T-Cell Epitope Dominance in Viral Fusion Proteins
Landry, S. J., Mettu, R. R., Kolls, J. K., Aberle, J. H., Norton, E. B., Zwezdaryk, K. J., & Robinson, J. E. (2023) · Biochemistry · doi:10.1021/acs.biochem.3c00335 · Cited by 4
Global COVID-19 vaccination in infants and children: Effectiveness, safety, and challenges
Jantarabenjakul, W., Chantasrisawad, N., Nantanee, R., Ganguli, S., & Puthanakit, T. (2023) · Asian Pacific Journal of Allergy and Immunology · doi:10.12932/ap-300423-1596 · Cited by 5
Bykonia, E. N., Kleymenov, D. A., Gushchin, V. А., Siniavin, A. E., Mazunina, E. P., Kuznetsova, N. A., Kozlova, S. R., Zolotar, A. N., Shidlovskaya, E. V., Usachev, E. V., et al. (2024) · Vaccines · doi:10.3390/vaccines12040379 · Cited by 4
Zhang, J., Yue, C., Lin, Y., Tian, J., Guo, Y., Zhang, D., Guo, Y., Ye, B., Chai, Y., Qi, J., et al. (2024) · ImmunoHorizons · doi:10.4049/immunohorizons.2400026 · Cited by 4
Selection and T-cell antigenicity of synthetic long peptides derived from SARS-CoV-2
Piadel, K., Haybatollahi, A., Dalgleish, A. G., & Smith, P. L. (2022) · Journal of General Virology · doi:10.1099/jgv.0.001698 · Cited by 4
Jabbour, G., Rego, S., Nguyenkhoa, V., & Dakshanamurthy, S. (2021) · bioRxiv (Cold Spring Harbor Laboratory) · doi:10.1101/2021.09.11.459907 · Cited by 4
Chun, J., Yoon, D., Nowakowska, A., Lee, H. D., Lee, C., Kim, J., Kim, S., Bang, H., Lee, H.-J., & Kim, Y. B. (2024) · Vaccine · doi:10.1016/j.vaccine.2024.126355 · Cited by 3
van den Dijssel, J., Konijn, V. A. L., Duurland, M. C., de Jongh, R., Koets, L., Veldhuisen, B., Raaphorst, H., Turksma, A. W., Heeren, J. J. F., Steenhuis, M., et al. (2025) · European Journal of Immunology · doi:10.1002/eji.202451565 · Cited by 3
Zhang, W., Liu, Y., Zeng, H., Liao, X., Zhao, J., Tang, X., & Zhang, Z. (2025) · iScience · doi:10.1016/j.isci.2025.113600 · Cited by 3
Peptide MegaPools Approach to Evaluate the Dengue-Specific CD4 and CD8 T-Cell Response
Tiberi, M., Petrone, L., Salmi, A., Vanini, V., Cuzzi, G., D’Abramo, A., Marco, P. D., Grifoni, A., Weiskopf, D., Sette, A., et al. (2025) · Pathogens · doi:10.3390/pathogens15010005 · Cited by 3
Self-citationФайзулоев, Е. Б., Gracheva, A. V., Korchevaya, E. R., Ammour, Y. I., Smirnova, D. I., Khokhlova, D. M., Drokov, A. O., Pankratov, A. A., Trunova, G. V., Андреевна, Х. В., et al. (2024) · Journal of microbiology epidemiology immunobiology · doi:10.36233/0372-9311-496 · Cited by 3
Zornikova, K. V., Dianov, D. V., Ivanova, N. O., Davydova, V. D., Nenasheva, T. A., Fefelova, E. I., & Васильевна, Б. А. (2024) · International Journal of Molecular Sciences · doi:10.3390/ijms252312591 · Cited by 3
Florian, D. M., Bauer, M. W., Popovitsch, A., Faé, I., Springer, D. N., Graninger, M., Traugott, M. T., Weseslindtner, L., Aberle, S. W., Fischer, G., et al. (2025) · Frontiers in Immunology · doi:10.3389/fimmu.2025.1501704 · Cited by 4
Incorporating antigen processing into CD4+ T cell epitope prediction with integer linear programming
Bhattacharya, A., Lyons, M. C., Landry, S. J., & Mettu, R. R. (2022) · ACM International Conference on Bioinformatics, Computational Biology, and Health Informatics (ACM-BCB) · doi:10.1145/3535508.3545545 · Cited by 3
An Update on Complications Associated with SARS-CoV-2 Infection and COVID-19 Vaccination
Chowdhury, P., Bhattacharya, S., Gogoi, B., Veeranna, R. P., & Kumar, S. (2022) · Vaccines · doi:10.3390/vaccines10101639 · Cited by 3
Meza, L. A., Zengin, Z. B., Salgia, S. K., Malhotra, J., Karczewska, E., Dorff, T. B., Tripathi, A., Ely, J. L., Kelley, E., Mead, H., et al. (2023) · The Oncologist · doi:10.1093/oncolo/oyad067 · Cited by 3
Integration of the immune memory into the pathogen‐driven MHC polymorphism hypothesis
Radwan, J., Kohi, C., Ejsmond, M. J., Paganini, J., & Pontarotti, P. (2023) · HLA · doi:10.1111/tan.15216 · Cited by 3
HLA-DQ2/8 and COVID-19 in Celiac Disease: Boon or Bane
Lerner, A., Benzvi, C., & Vojdani, A. (2023) · Microorganisms · doi:10.3390/microorganisms11122977 · Cited by 3
Adaptive Cellular Responses following SARS-CoV-2 Vaccination in Primary Antibody Deficiency Patients
Gupta, S., Su, H., Agrawal, S., Demirdağ, Y. Y., Tran, M., & Gollapudi, S. V. S. (2024) · Pathogens · doi:10.3390/pathogens13060514 · Cited by 3
Natural heteroclitic-like peptides are generated by SARS-CoV-2 mutations
Tiezzi, C., Vecchi, A. L., Rossi, M., Cavazzini, D., Bolchi, A., Laccabue, D., Doselli, S., Penna, A., Sacchelli, L., Brillo, F., et al. (2023) · iScience · doi:10.1016/j.isci.2023.106940 · Cited by 3
Carro, B. (2021) · All Life · doi:10.1080/26895293.2021.1977186 · Cited by 2
Sedegah, M., Porter, C. K., Hollingdale, M. R., Ganeshan, H. D., Huang, J., Goforth, C. W., Belmonte, M., Belmonte, A. D., Weir, D. L., Lizewski, R. A., et al. (2022) · PLoS ONE · doi:10.1371/journal.pone.0266691 · Cited by 4
Wnuk, K., Sudol, J., Spilman, P., & Soon‐Shiong, P. (2022) · Frontiers in Immunology · doi:10.3389/fimmu.2022.918928 · Cited by 3
Metadata
- Authors
- Tarke, A., Sidney, J., Kidd, C. K., Dan, J. M., Ramirez, S. I., Yu, E. D., Mateus, J., da Silva Antunes, R., Moore, E., Rubiro, P., Methot, N., Phillips, E., Mallal, S., Frazier, A., Rawlings, S. A., Greenbaum, J. A., Peters, B., Smith, D. M., Crotty, S., Weiskopf, D., Grifoni, A., & Sette, A.
- Affiliations
- La Jolla Institute for Immunology (US)
- Murdoch University (AU)
- University of California San Diego (US)
- Corresponding author
- Grifoni, Alba
- Sette, Alessandro
- ORCID
- Venue
- Cell Reports Medicine
- Publisher
- Elsevier BV
- Published
- 2021-02
- Volume
- 2
- Issue
- 2
- Pages
- 100204
- ISSN
- 2666-3791 (ISSN-L)
- PMC
- PMC7837622
- OpenAlex
- W3122458452
- Cited by
- 540
- References
- 58
- Citations by year
- 2026: 22 · 2025: 41 · 2024: 71 · 2023: 118 · 2022: 156 · 2021: 131
- FWCI
- 37.36
- Type
- journal article
- Language
- en
- Open access
- gold
- doi.org
- Licence
- Locations
- Cell Reports Medicine (publishedVersion, cc-by-nc-nd)
- bioRxiv (Cold Spring Harbor Laboratory) (acceptedVersion, other-oa)
- PubMed Central (publishedVersion, cc-by-nc-nd)
- PubMed (publishedVersion)
- eScholarship (California Digital Library) (submittedVersion, other-oa)
- PubMed Central (submittedVersion)
- Murdoch University Research Portal (submittedVersion)
- eScholarship (California Digital Library) (submittedVersion)
- ImmPort
- Funders
- University of California, San Diego (AI007036and AI007384)
- National Institute of Allergy and Infectious Diseases (75N93019C00001, AI42742, 75N9301900065)
- National Institutes of Health (AI036214, U01 CA260541-01, AI135078)
- John and Mary Tu Foundation
- Gilead Sciences
- Università degli Studi di Genova
- Topics
- Life Sciences › Biochemistry, Genetics and Molecular Biology › Molecular Biology › vaccines and immunoinformatics approaches
- Health Sciences › Medicine › Infectious Diseases › SARS-CoV-2 and COVID-19 Research
- Life Sciences › Immunology and Microbiology › Immunology › Immunotherapy and Immune Responses
- Keywords
- SARS-CoV-2, COVID-19 pandemic, epitope-specific T cell responses, HLA-restricted epitopes, CD4+ T cells, CD8+ T cells, HLA class II, convalescent patients, virus-specific T cells
About these checks
Registry, retraction, Cites and statistics results are computed, not judged, with one exception: a printed reference that no index lists is read once by a model before it counts as a citation error. Claims are extracted by a model and kept only when their quote appears verbatim in the text; each cited source is then checked, with a model’s help, for whether it says what the claim relies on. Those verdicts can be wrong — read the claim’s quote and the cited source before relying on one.
Statistics and arithmetic are recomputed, not judged.
Confidence bands are shown only for fields calibrated on our annotated test set. None is calibrated yet, so no band is shown.
What counts as a claim ›How we measure confidence ›How we check this ›
Are you an author, or do you see a problem with this page? Request a review
