

The DOI matches its Crossref record; 32 of the 33 references it cites were found in a registry or an index, and 1 are not checked yet.
Does happiness itself directly affect mortality? The prospective UK Million Women Study
Open accessAbstract
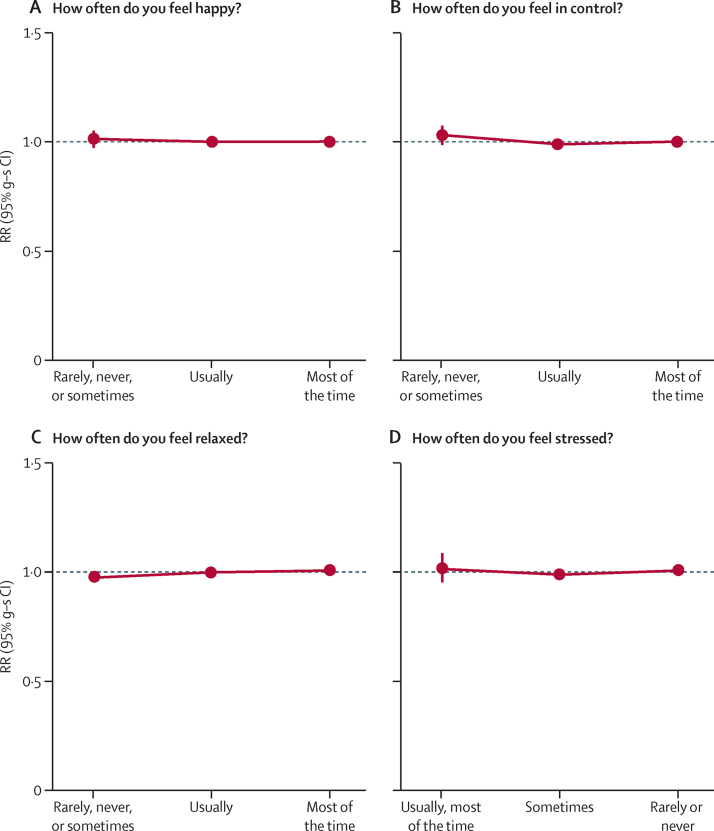
BACKGROUND: Poor health can cause unhappiness and poor health increases mortality. Previous reports of reduced mortality associated with happiness could be due to the increased mortality of people who are unhappy because of their poor health. Also, unhappiness might be associated with lifestyle factors that can affect mortality. We aimed to establish whether, after allowing for the poor health and lifestyle of people who are unhappy, any robust evidence remains that happiness or related subjective measures of wellbeing directly reduce mortality. METHODS: The Million Women Study is a prospective study of UK women recruited between 1996 and 2001 and followed electronically for cause-specific mortality. 3 years after recruitment, the baseline questionnaire for the present report asked women to self-rate their health, happiness, stress, feelings of control, and whether they felt relaxed. The main analyses were of mortality before Jan 1, 2012, from all causes, from ischaemic heart disease, and from cancer in women who did not have heart disease, stroke, chronic obstructive lung disease, or cancer at the time they answered this baseline questionnaire. We used Cox regression, adjusted for baseline self-rated health and lifestyle factors, to calculate mortality rate ratios (RRs) comparing mortality in women who reported being unhappy (ie, happy sometimes, rarely, or never) with those who reported being happy most of the time. FINDINGS: Of 719,671 women in the main analyses (median age 59 years [IQR 55-63]), 39% (282,619) reported being happy most of the time, 44% (315,874) usually happy, and 17% (121,178) unhappy. During 10 years (SD 2) follow-up, 4% (31,531) of participants died. Self-rated poor health at baseline was strongly associated with unhappiness. But after adjustment for self-rated health, treatment for hypertension, diabetes, asthma, arthritis, depression, or anxiety, and several sociodemographic and lifestyle factors (including smoking, deprivation, and body-mass index), unhappiness was not associated with mortality from all causes (adjusted RR for unhappy vs happy most of the time 0·98, 95% CI 0·94-1·01), from ischaemic heart disease (0·97, 0·87-1·10), or from cancer (0·98, 0·93-1·02). Findings were similarly null for related measures such as stress or lack of control. INTERPRETATION: In middle-aged women, poor health can cause unhappiness. After allowing for this association and adjusting for potential confounders, happiness and related measures of wellbeing do not appear to have any direct effect on mortality. FUNDING: UK Medical Research Council, Cancer Research UK.
Overview
The claims and statistics of this paper haven’t been checked yet.
Run the check — free, no account needed. It reads the open-access text and checks the sources it cites.
Integrity signals
Registry
Cites
Statistics
Figures
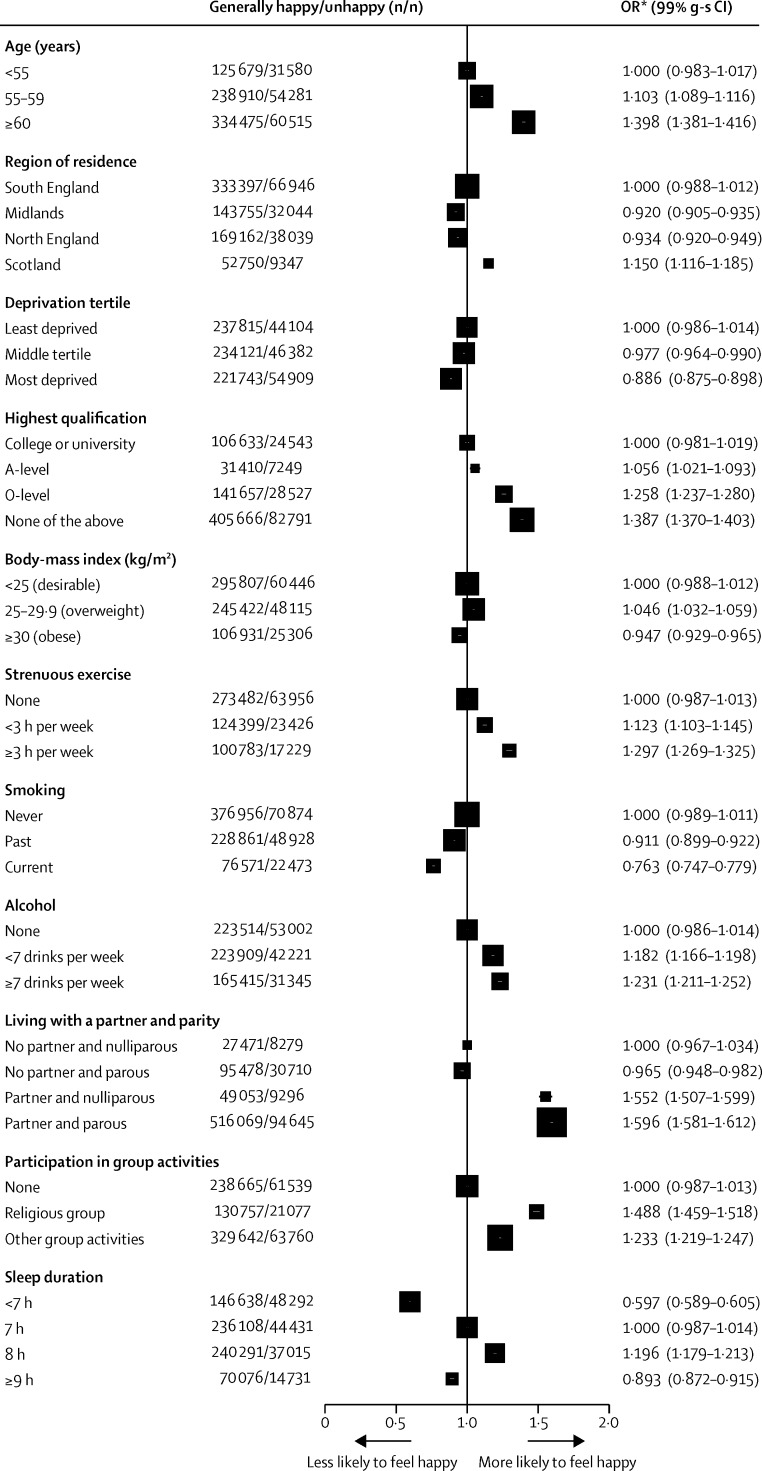
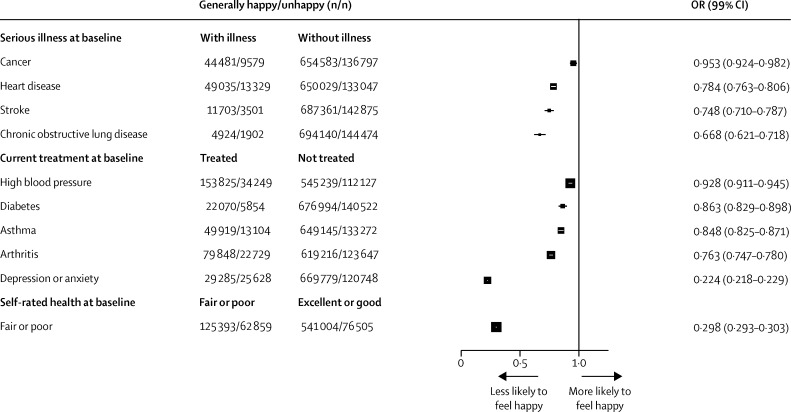
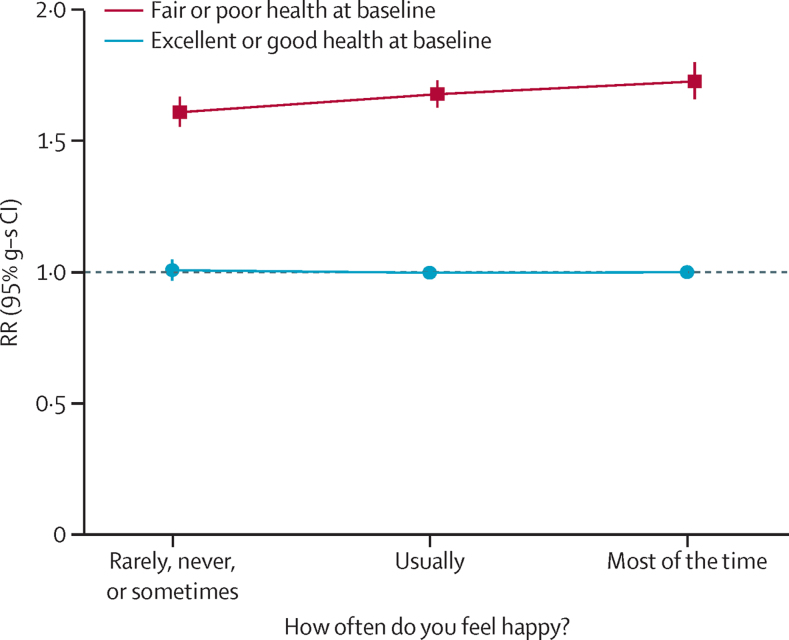
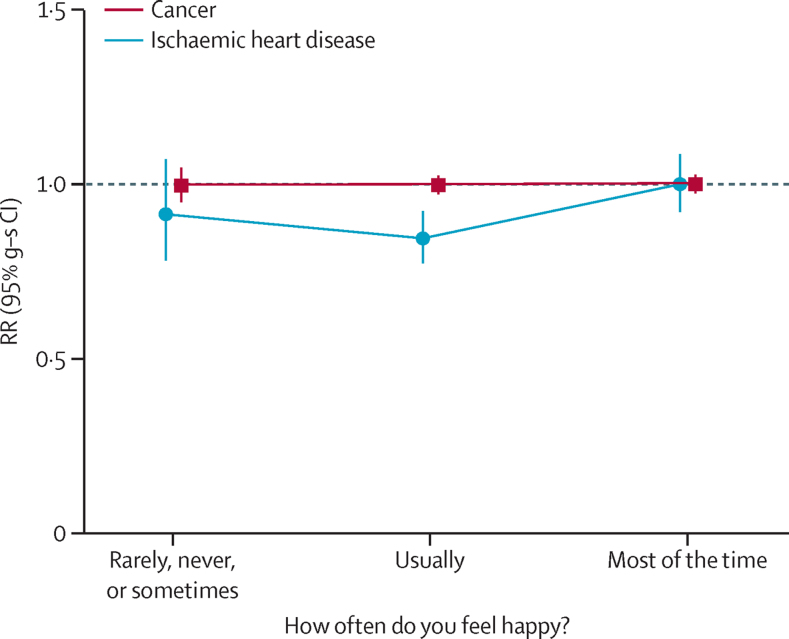
Verification
Claims the paper makes
The claims and statistics of this paper haven’t been checked yet.
Run the check — free, no account needed. It reads the open-access text and checks the sources it cites.
Claims other papers make about this one
Each is checked against this paper’s own text: does it say what the citing paper says it does?
The cited source says what the claim attributes to it.
In the citing paper
“However, in the Million Women Study, there was no association of happiness with risk of mortality after accounting for health status, although concerns have been raised about the study methodology. 79,80”
From Psychological Health, Well-Being, and the Mind-Heart-Body Connection: A Scientific Statement From the American Heart Association (2021) · cites this paper as [79]
Self-check
Percentages, sums and reported differences re-computed from the paper’s own numbers.
The self-check needs the paper’s full text.
Citations
Cites
Self-rated health and mortality: a review of twenty-seven community studies.
Idler, E. L., & Benyamini, Y. (1997) · Journal of Health and Social Behavior · doi:10.2307/2955359 · Cited by 8,598
Breast cancer and hormone-replacement therapy in the Million Women Study
Beral, V. (2003) · The Lancet · doi:10.1016/s0140-6736(03)14065-2 · Cited by 2,986
Self-citationWell-Being Over Time in Britain and the USA
Oswald, A. J., & Blanchflower, D. G. (1999) · Cited by 2,774
Subjective wellbeing, health, and ageing
Steptoe, A., Deaton, A., & Stone, A. A. (2014) · The Lancet · doi:10.1016/s0140-6736(13)61489-0 · Cited by 2,538
Happy People Live Longer: Subjective Well‐Being Contributes to Health and Longevity
Diener, E., & Chan, M. Y. (2011) · Applied Psychology: Health and Well-Being · doi:10.1111/j.1758-0854.2010.01045.x · Cited by 2,260
Does positive affect influence health?
Pressman, S. D., & Cohen, S. (2005) · Psychological Bulletin · doi:10.1037/0033-2909.131.6.925 · Cited by 2,087
Chida, Y., & Steptoe, A. (2008) · Psychosomatic Medicine · doi:10.1097/psy.0b013e31818105ba · Cited by 1,592
Health and Deprivation: Inequality and the North
Townsend, P. D., Phillimore, P., & Beattie, A. (1987) · DOAJ (DOAJ: Directory of Open Access Journals) · Cited by 1,473
Breast cancer and hormone-replacement therapy: the Million Women Study
Beral, V., Banks, E., REEVES, G. K., & Bull, D. (2003) · The Lancet · doi:10.1016/s0140-6736(03)14596-5 · Cited by 1,270
Self-citationPERCEIVED HEALTH AND MORTALITY: A NINE-YEAR FOLLOW-UP OF THE HUMAN POPULATION LABORATORY COHORT1
Kaplan, G. A., & Camacho, T. C. (1983) · American Journal of Epidemiology · doi:10.1093/oxfordjournals.aje.a113541 · Cited by 1,078
Boehm, J. K., & Kubzansky, L. D. (2012) · Psychological Bulletin · doi:10.1037/a0027448 · Cited by 909
Pirie, K., Peto, R., Reeves, G. K., Green, J., & Beral, V. (2013) · The Lancet · doi:10.1016/s0140-6736(12)61720-6 · Cited by 799
Self-citationHealth and Deprivation: Inequality and the North
Blane, D., Townsend, P. D., Phillimore, P., & Beattie, A. (1989) · British Journal of Sociology · doi:10.2307/590279 · Cited by 756
Happy People Live Longer: Subjective Well-Being Contributes to Health and Longevity
Diener, E., & Chan, M. Y. (2010) · PsycEXTRA Dataset · doi:10.1037/e675972011-001 · Cited by 727
Haller, M., & Hadler, M. (2006) · Social Indicators Research · doi:10.1007/s11205-004-6297-y · Cited by 620
Strine, T. W., Chapman, D. P., Balluz, L. S., Moriarty, D. G., & Mokdad, A. H. (2007) · Journal of Community Health · doi:10.1007/s10900-007-9066-4 · Cited by 522
Health and Ways of Living: The Alameda County Study
Berkman, L. F., & Breslow, L. (1983) · Medical Entomology and Zoology · Cited by 488
Tindle, H. A., Chang, Y.-F., Kuller, L. H., Manson, J. E., Robinson, J. G., Rosal, M. C., Siegle, G. J., & Matthews, K. A. (2009) · Circulation · doi:10.1161/circulationaha.108.827642 · Cited by 483
Giltay, E. J., Geleijnse, J. M., Zitman, F. G., Hoekstra, T., & Schouten, E. G. (2004) · Archives of General Psychiatry · doi:10.1001/archpsyc.61.11.1126 · Cited by 396
Health and Ways of Living: The Alameda County Study.
Sorensen, G., Berkman, L. F., & Breslow, L. (1984) · Contemporary Sociology A Journal of Reviews · doi:10.2307/2069097 · Cited by 368
Davidson, K. W., Mostofsky, E., & Whang, W. (2010) · European Heart Journal · doi:10.1093/eurheartj/ehp603 · Cited by 334
Xu, J., & ROBERTS, R. E. (2010) · Health Psychology · doi:10.1037/a0016767 · Cited by 304
Improved estimates of floating absolute risk
Plummer, M. (2003) · Statistics in Medicine · doi:10.1002/sim.1485 · Cited by 269
A prospective study of positive psychological well-being and coronary heart disease.
Boehm, J. K., Peterson, C., Mika Kivimaki, B., & Kubzansky, L. D. (2011) · Health Psychology · doi:10.1037/a0023124 · Cited by 218
Heart health when life is satisfying: evidence from the Whitehall II cohort study
Boehm, J. K., Peterson, C., Mika Kivimaki, B., & Kubzansky, L. D. (2011) · European Heart Journal · doi:10.1093/eurheartj/ehr203 · Cited by 157
Nabi, H., Mika Kivimaki, B., Vogli, R. D., Marmot, M. G., & Singh‐Manoux, A. (2008) · BMJ · doi:10.1136/bmj.a118 · Cited by 128
What Symptoms of Depression Predict Mortality in Community‐Dwelling Elders?
Blazer, D. G., & Hybels, C. F. (2004) · Journal of the American Geriatrics Society · doi:10.1111/j.1532-5415.2004.52564.x · Cited by 121
Effects of Happiness on All-Cause Mortality During 15 Years of Follow-Up: The Arnhem Elderly Study
Koopmans, T. A., Geleijnse, J. M., Zitman, F. G., & Giltay, E. J. (2008) · Journal of Happiness Studies · doi:10.1007/s10902-008-9127-0 · Cited by 110
Perceived Level of Life Enjoyment and Risks of Cardiovascular Disease Incidence and Mortality
Shirai, K., Iso, H., Ohira, T., Ikeda, A., Noda, H., Honjo, K., Inoue, M., & Tsugane, S. (2009) · Circulation · doi:10.1161/circulationaha.108.834176 · Cited by 105
Exploring Determinants of Subjective Wellbeing in OECD Countries
Flèche, S., Smith, C., & Sorsa, P. (2012) · OECD statistics working papers · doi:10.1787/5k9ffc6p1rvb-en · Cited by 72
Roddam, A., Spencer, E. A., Banks, E., Beral, V., REEVES, G. K., Appleby, P. N., Barnes, I. M., Whiteman, D. C., & Keyal, T. J. (2005) · Public Health Nutrition · doi:10.1079/phn2004676 · Cited by 65
Self-citationMeasuring National Well-being - What matters most to Personal Well-being?
Oguz, S., Merad, S., & Snape, D. (2013) · Cited by 49
Exploring Determinants of Subjective Wellbeing in OECD Countries
Flèche, S., Smith, C., & Sorsa, P. (2011) · OECD Economics Department working papers · doi:10.1787/5kg0k6zlcm5k-en · Cited by 31
Cited by
Sorted by citations
Advances and Open Questions in the Science of Subjective Well-Being
Diener, E., Lucas, R. E., & Oishi, S. (2018) · Collabra Psychology · doi:10.1525/collabra.115 · Cited by 1,333
“Earlier we described a study by Liu et al. (2016) in which they attempted to determine whether happiness can affect longevity after controlling many other variables such as self-rated health at baseline, having a partner, income, exercise, and smoking.”
Levine, G. N., Cohen, B. E., Commodore-Mensah, Y., Fleury, J., Huffman, J. C., Khalid, U., Labarthe, D. R., Lavretsky, H., Michos, E. D., Spatz, E. S., et al. (2021) · Circulation · doi:10.1161/cir.0000000000000947 · Cited by 865
If, Why, and When Subjective Well‐Being Influences Health, and Future Needed Research
Diener, E., Pressman, S. D., Hunter, J. F., & Delgadillo‐Chase, D. (2017) · Applied Psychology Health and Well-Being · doi:10.1111/aphw.12090 · Cited by 816
“An example of statistical controls, and the issues they present, is the study by Liu et al. (2016) on the Million Women sample in the United Kingdom.”
BackgroundFindings all psychologists should know from the new science on subjective well-being.
Diener, E., Heintzelman, S. J., Kushlev, K., Tay, L., Wirtz, D., Lutes, L. D., & Oishi, S. (2016) · Canadian Psychology/Psychologie canadienne · doi:10.1037/cap0000063 · Cited by 786
“, & Lucas, R. E. (2014). Testing set-point theory in a Swiss national sample: Reaction and adaptation to major life events.”
BackgroundPositive Affect and Health: What Do We Know and Where Next Should We Go?
Pressman, S. D., Jenkins, B. N., & Moskowitz, J. T. (2019) · Annual Review of Psychology · doi:10.1146/annurev-psych-010418-102955 · Cited by 452
Metadata
- Authors
- Liu, B., Floud, S., Pirie, K., Green, J., Peto, R., & Beral, V.
- Affiliations
- UNSW Sydney (AU)
- University of Oxford (GB)
- Corresponding author
- Liu, Bette
- Venue
- The Lancet
- Publisher
- Elsevier BV
- Published
- 2016-02
- Volume
- 387
- Issue
- 10021
- Pages
- 874-881
- ISSN
- 0099-5355 (ISSN-L)
- 0140-6736
- PMC
- PMC5075047
- OpenAlex
- W2192905344
- Cited by
- 259
- References
- 32
- Citations by year
- 2026: 11 · 2025: 15 · 2024: 14 · 2023: 20 · 2022: 19 · 2021: 18 · 2020: 64 · 2019: 19 · 2018: 27 · 2017: 33 · 2016: 18
- FWCI
- 43.20
- Type
- journal article
- Language
- en
- Open access
- hybrid
- doi.org
- Locations
- The Lancet (publishedVersion, cc-by)
- Europe PMC (PubMed Central) (publishedVersion, cc-by)
- PubMed Central (publishedVersion, cc-by)
- PubMed (publishedVersion)
- UNSWorks (UNSW Sydney) (submittedVersion, cc-by)
- The Sydney eScholarship Repository (The University of Sydney) (submittedVersion)
- UNSWorks (University of New South Wales, Sydney, Australia) (submittedVersion, cc-by)
- Funders
- Cancer Research UK (16491)
- British Heart Foundation
- Medical Research Council (MR/K02700X/1)
- National Health and Medical Research Council
- Topics
- Social Sciences › Psychology › Social Psychology › Psychological Well-being and Life Satisfaction
- Social Sciences › Health › Health disparities and outcomes
- Health Sciences › Health Professions › General Health Professions › Health, psychology, and well-being
- Keywords
- happiness, mortality, subjective well-being, self-rated health, ischemic heart disease, cancer mortality, stress, perceived control, relaxation, lifestyle factors, women's health, Million Women Study, anxiety and depression, smoking, socioeconomic deprivation, body mass index, hypertension, diabetes mellitus, asthma, arthritis, cause-specific mortality
- MeSH terms
- Aged, Female, Follow-Up Studies, United Kingdom, Happiness, Health Status, Humans, Middle Aged, Mortality, Neoplasms, Prospective Studies, Proportional Hazards Models, Myocardial Ischemia
About these checks
Registry, retraction, Cites and statistics results are computed, not judged, with one exception: a printed reference that no index lists is read once by a model before it counts as a citation error. Claims are extracted by a model and kept only when their quote appears verbatim in the text; each cited source is then checked, with a model’s help, for whether it says what the claim relies on. Those verdicts can be wrong — read the claim’s quote and the cited source before relying on one.
Statistics and arithmetic are recomputed, not judged.
Confidence bands are shown only for fields calibrated on our annotated test set. None is calibrated yet, so no band is shown.
What counts as a claim ›How we measure confidence ›How we check this ›
Are you an author, or do you see a problem with this page? Request a review
