

The DOI matches its Crossref record; 149 of the 149 references it cites were found in a registry or an index.
Using Deep Graph Neural Networks Improves Physics-Based Hydration Free Energy Predictions Even for Molecules Outside of the Training Set Distribution
Open accessPublished version of a preprint
Abstract
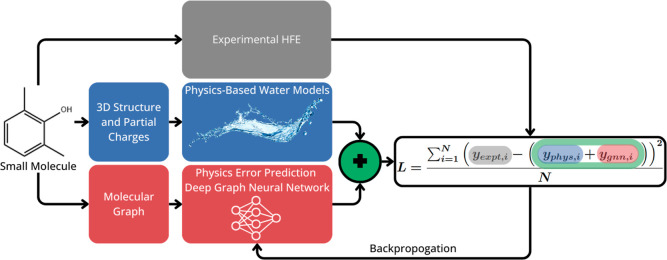
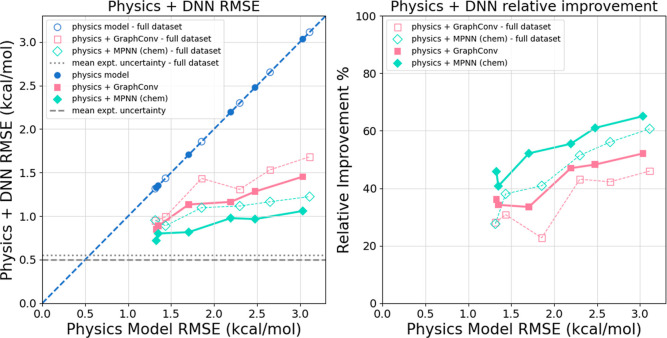
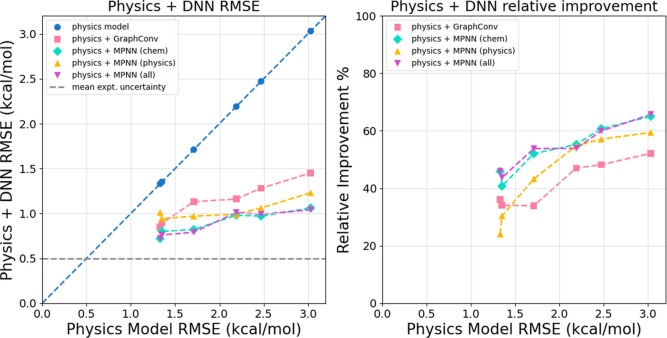
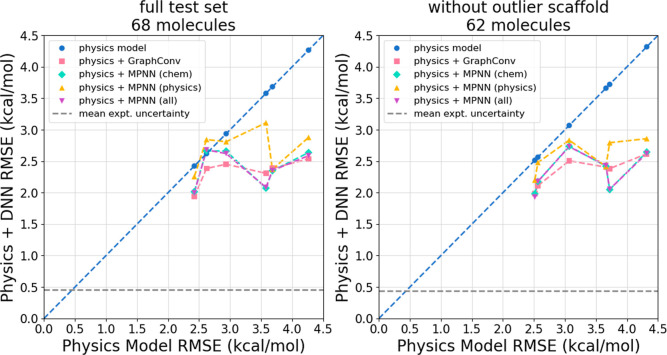
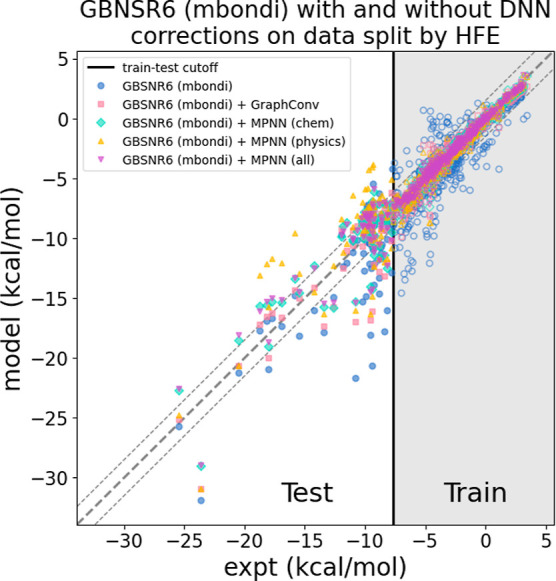
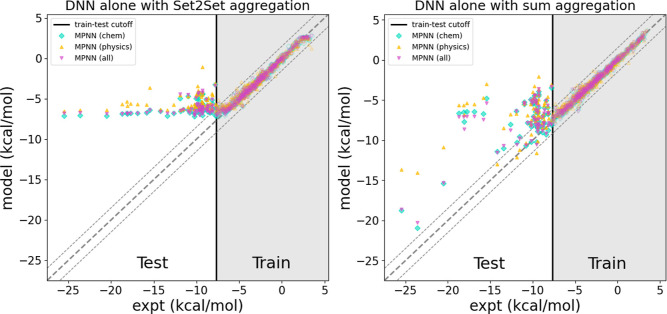
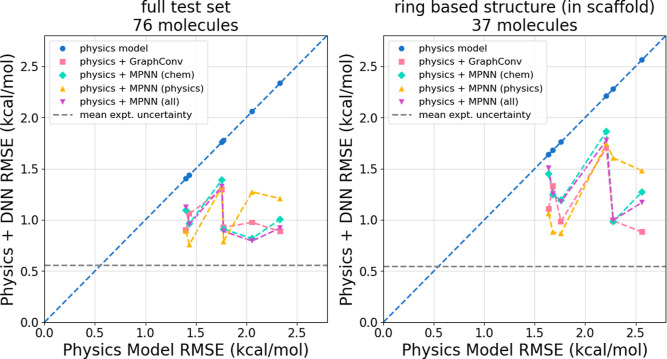
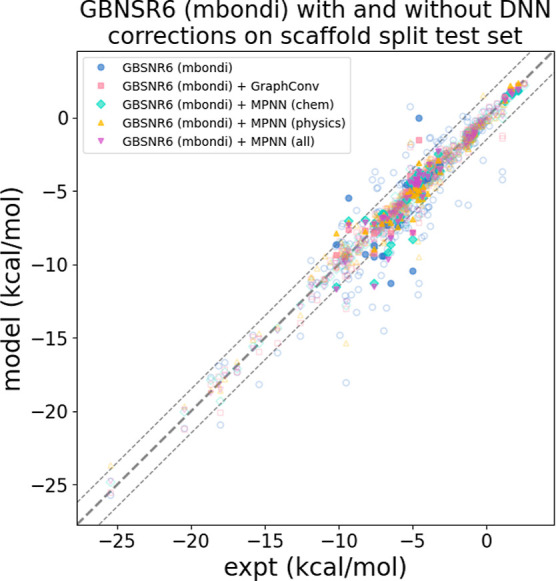
The accuracy of computational water models is crucial to atomistic simulations of biomolecules. Here we explore a decoupled framework that combines classical physics-based models with deep neural networks (DNNs) to correct residual error in hydration free energy (HFE) prediction. Our main goal is to evaluate this framework on out-of-distribution data (molecules that differ significantly from those used in training), where DNNs are known to struggle. Several common physics-based solvation models are used in the evaluation. Graph neural network architectures are tested for their ability to generalize using multiple data set splits, including out-of-distribution HFEs and unseen molecular scaffolds. Our most important finding is that for out-of-distribution data, where DNNs alone often struggle, the physics + DNN models consistently improve physics model predictions. For in-distribution data, the DNN corrections significantly improve the accuracy of physics-based models, with a final RMSE below 1 kcal/mol and a relative improvement between 40% and 65% in most cases. The accuracy of physics + DNN models tends to improve when the 6% of molecules with the highest experimental uncertainty are removed. This study provides insights into the potential and limitations of combining physics and machine learning for molecular modeling, offering a practical and generalizable strategy of using DNN as independent postprocessing correction.
Overview
The claims and statistics of this paper haven’t been checked yet.
Run the check — free, no account needed. It reads the open-access text and checks the sources it cites.
Integrity signals
Registry
Cites
Statistics
Figures
Verification
Claims the paper makes
The claims and statistics of this paper haven’t been checked yet.
Run the check — free, no account needed. It reads the open-access text and checks the sources it cites.
Self-check
Percentages, sums and reported differences re-computed from the paper’s own numbers.
The self-check needs the paper’s full text.
Citations
Cites
LeCun, Y., Bengio, Y., & Hinton, G. (2015) · Nature · doi:10.1038/nature14539 · Cited by 84,126
Highly accurate protein structure prediction with AlphaFold
Jumper, J., Evans, R., Pritzel, A., Green, T., Figurnov, M., Ronneberger, O., Tunyasuvunakool, K., Bates, R., Žídek, A., Potapenko, A., et al. (2021) · Nature · doi:10.1038/s41586-021-03819-2 · Cited by 43,764
Comparison of simple potential functions for simulating liquid water
Jorgensen, W. L., Chandrasekhar, J., Madura, J. D., Impey, R. W., & Klein, M. L. (1983) · The Journal of Chemical Physics · doi:10.1063/1.445869 · Cited by 41,298
PyTorch: An Imperative Style, High-Performance Deep Learning Library
Paszke, A., Gross, S., Massa, F., Lerer, A., Bradbury, J., Chanan, G., Killeen, T., Lin, Z., Gimelshein, N., Antiga, L., et al. (2019) · arXiv · doi:10.48550/arxiv.1912.01703 · Cited by 31,473
Advances in neural information processing systems 7
Cios, K., & Shields, M. (1997) · Neurocomputing · doi:10.1016/s0925-2312(97)90018-7 · Cited by 22,059
Raissi, M., Perdikaris, P., & Karniadakis, G. E. (2019) · Journal of Computational Physics · doi:10.1016/j.jcp.2018.10.045 · Cited by 20,384
Quantum Mechanical Continuum Solvation Models
Tomasi, J., Mennucci, B., & Cammi, R. (2005) · Chemical Reviews · doi:10.1021/cr9904009 · Cited by 16,868
Unified Approach for Molecular Dynamics and Density-Functional Theory
Car, R., & Parrinello, M. (1985) · Physical Review Letters · doi:10.1103/physrevlett.55.2471 · Cited by 10,754
TensorFlow: Large-Scale Machine Learning on Heterogeneous Distributed Systems
Abadi, M., Agarwal, A., Barham, P., Brevdo, E., Chen, Z., Citro, C., Corrado, G. S., Davis, A., Dean, J., Devin, M., et al. (2016) · arXiv · doi:10.48550/arxiv.1603.04467 · Cited by 9,408
Physics-informed machine learning
Karniadakis, G. E., Kevrekidis, I. G., Lu, L., Perdikaris, P., Wang, S., & Yang, L. (2021) · Nature Reviews Physics · doi:10.1038/s42254-021-00314-5 · Cited by 8,718
Machine learning: Algorithms, real-world applications and research directions
Sarker, I. H. (2021) · SN Computer Science · doi:10.1007/s42979-021-00592-x · Cited by 5,583
Kollman, P. A., Massova, I., Reyes, C., Kuhn, B., Huo, S., Chong, L., Lee, M., Lee, T., Duan, Y., Wang, W., et al. (2000) · Accounts of Chemical Research · doi:10.1021/ar000033j · Cited by 4,978
Machine learning for molecular and materials science
Butler, K. T., Davies, D. W., Cartwright, H., Isayev, O., & Walsh, A. (2018) · Nature · doi:10.1038/s41586-018-0337-2 · Cited by 4,968
Structure and Dynamics of the TIP3P, SPC, and SPC/E Water Models at 298 K
Mark, P., & Nilsson, L. (2001) · The Journal of Physical Chemistry A · doi:10.1021/jp003020w · Cited by 4,571
Semianalytical treatment of solvation for molecular mechanics and dynamics
Still, W. C., Tempczyk, A., Hawley, R. C., & Hendrickson, T. F. (1990) · Journal of the American Chemical Society · doi:10.1021/ja00172a038 · Cited by 3,653
Neural Message Passing for Quantum Chemistry
Gilmer, J., Schoenholz, S. S., Riley, P. F., Vinyals, O., & Dahl, G. E. (2017) · arXiv (Cornell University) · doi:10.48550/arxiv.1704.01212 · Cited by 3,440
Molecular dynamics simulations of biomolecules
Karplus, M., & McCammon, J. A. (2002) · Nature Structural Biology · doi:10.1038/nsb0902-646 · Cited by 3,386
MoleculeNet: a benchmark for molecular machine learning
Wu, Z., Ramsundar, B., Feinberg, E. N., Gomes, J., Geniesse, C., Pappu, A. S., Leswing, K., & Pande, V. (2018) · Chemical Science · doi:10.1039/c7sc02664a · Cited by 3,107
Classical Electrostatics in Biology and Chemistry
Honig, B. H., & Nicholls, A. O. (1995) · Science · doi:10.1126/science.7761829 · Cited by 2,891
The Parable of Google Flu: Traps in Big Data Analysis
Lazer, D., Kennedy, R., King, G., & Vespignani, A. (2014) · Science · doi:10.1126/science.1248506 · Cited by 2,523
Onufriev, A., Bashford, D., & Case, D. A. (2004) · Proteins: Structure, Function, and Bioinformatics · doi:10.1002/prot.20033 · Cited by 2,507
Self-citationImplicit Solvation Models: Equilibria, Structure, Spectra, and Dynamics
Cramer, C. J., & Truhlar, D. G. (1999) · Chemical Reviews · doi:10.1021/cr960149m · Cited by 2,308
ANI-1: an extensible neural network potential with DFT accuracy at force field computational cost
Smith, J. S., Isayev, O., & Roitberg, A. E. (2017) · Chemical Science · doi:10.1039/c6sc05720a · Cited by 1,921
Theory-Guided Data Science: A New Paradigm for Scientific Discovery from Data
Karpatne, A., Atluri, G., Faghmous, J. H., Steinbach, M., Banerjee, A., Ganguly, A., Shekhar, S., Samatova, N., & Kumar, V. (2017) · IEEE Transactions on Knowledge and Data Engineering · doi:10.1109/tkde.2017.2720168 · Cited by 1,752
IEEE Transactions on Knowledge and Data Engineering
(2023) · IEEE Transactions on Knowledge and Data Engineering · doi:10.1109/tkde.69 · Cited by 1,671
Molecular graph convolutions: moving beyond fingerprints
Kearnes, S., McCloskey, K., Berndl, M., Pande, V., & Riley, P. (2016) · Journal of Computer-Aided Molecular Design · doi:10.1007/s10822-016-9938-8 · Cited by 1,631
Jorgensen, W. L., & Tirado-Rives, J. (2005) · Proceedings of the National Academy of Sciences · doi:10.1073/pnas.0408037102 · Cited by 1,621
The Many Roles of Computation in Drug Discovery
Jorgensen, W. L. (2004) · Science · doi:10.1126/science.1096361 · Cited by 1,586
JOURNAL OF CHEMICAL INFORMATION AND MODELING
(2005) · Chemical & Engineering News · doi:10.1021/cen-v083n019.p031 · Cited by 1,534
Integrating Scientific Knowledge with Machine Learning for Engineering and Environmental Systems
Willard, J., Jia, X., Xu, S., Steinbach, M. S., & Kumar, V. (2022) · ACM Computing Surveys · doi:10.1145/3514228 · Cited by 1,530
Building Water Models: A Different Approach
Izadi, S., Anandakrishnan, R., & Onufriev, A. V. (2014) · The Journal of Physical Chemistry Letters · doi:10.1021/jz501780a · Cited by 1,472
Self-citationMolecular Dynamics: Survey of Methods for Simulating the Activity of Proteins
Adcock, S. A., & McCammon, J. A. (2006) · Chemical Reviews · doi:10.1021/cr040426m · Cited by 1,316
Journal of Chemical Theory and Computation
(2008) · Journal of Chemical Theory and Computation · doi:10.1021/issn.1549-9618 · Cited by 1,193
Generalized Born Models of Macromolecular Solvation Effects
Bashford, D., & Case, D. A. (2000) · Annual Review of Physical Chemistry · doi:10.1146/annurev.physchem.51.1.129 · Cited by 1,146
Molecular dynamics and protein function
Karplus, M., & Kuriyan, J. (2005) · Proceedings of the National Academy of Sciences · doi:10.1073/pnas.0408930102 · Cited by 1,144
Modification of the Generalized Born Model Suitable for Macromolecules
Onufriev, A., Bashford, D., & Case, D. A. (2000) · The Journal of Physical Chemistry B · doi:10.1021/jp994072s · Cited by 1,074
Self-citationSimulating water with rigid non-polarizable models: a general perspective
Vega, C., & Abascal, J. L. F. (2011) · Physical Chemistry Chemical Physics · doi:10.1039/c1cp22168j · Cited by 991
Qiu, D., Shenkin, P. S., Hollinger, F. P., & Still, W. C. (1997) · The Journal of Physical Chemistry A · doi:10.1021/jp961992r · Cited by 962
A reappraisal of what we have learnt during three decades of computer simulations on water
Guillot, B. (2002) · Journal of Molecular Liquids · doi:10.1016/s0167-7322(02)00094-6 · Cited by 958
GNINA 1.0: molecular docking with deep learning
McNutt, A. T., Francoeur, P. G., Aggarwal, R., Masuda, T., Meli, R., Ragoza, M., Sunseri, J., & Koes, D. R. (2021) · Journal of Cheminformatics · doi:10.1186/s13321-021-00522-2 · Cited by 955
Roux, B., & Simonson, T. (1999) · Biophysical Chemistry · doi:10.1016/s0301-4622(98)00226-9 · Cited by 922
Big Data Meets Quantum Chemistry Approximations: The Δ-Machine Learning Approach
Ramakrishnan, R., Dral, P. O., Rupp, M., & von Lilienfeld, O. A. (2015) · Journal of Chemical Theory and Computation · doi:10.1021/acs.jctc.5b00099 · Cited by 911
A survey of machine learning for big data processing
Qiu, J., Wu, Q., Ding, G., Xu, Y., & Feng, S. (2016) · EURASIP Journal on Advances in Signal Processing · doi:10.1186/s13634-016-0355-x · Cited by 894
Hawkins, G. D., Cramer, C. J., & Truhlar, D. G. (1996) · The Journal of Physical Chemistry · doi:10.1021/jp961710n · Cited by 891
Piana, S., Donchev, A. G., Robustelli, P., & Shaw, D. E. (2015) · The Journal of Physical Chemistry B · doi:10.1021/jp508971m · Cited by 852
EURASIP Journal on Advances in Signal Processing
(2013) · EURASIP Journal on Advances in Signal Processing · doi:10.1007/13634.1687-6180 · Cited by 767
Pairwise solute descreening of solute charges from a dielectric medium
Hawkins, G. D., Cramer, C. J., & Truhlar, D. G. (1995) · Chemical Physics Letters · doi:10.1016/0009-2614(95)01082-k · Cited by 704
Deep Graph Library: A Graph-Centric, Highly-Performant Package for Graph Neural Networks
Wang, M., Zheng, D., Ye, Z., Gan, Q., Li, M., Song, X. H., Zhou, J., Ma, C., Yu, L., Gai, Y. L., et al. (2019) · arXiv (Cornell University) · doi:10.48550/arxiv.1909.01315 · Cited by 666
Generalized born model with a simple smoothing function
Im, W., Lee, M. S., & Brooks, C. L. (2003) · Journal of Computational Chemistry · doi:10.1002/jcc.10321 · Cited by 664
van der Spoel, D., van Maaren, P. J., & Berendsen, H. J. C. (1998) · The Journal of Chemical Physics · doi:10.1063/1.476482 · Cited by 659
Modeling chemical processes using prior knowledge and neural networks'
Thompson, M. L., & Kramer, M. A. (1994) · AIChE Journal · doi:10.1002/aic.690400806 · Cited by 596
Deep learning improves antimicrobial peptide recognition
Veltri, D., Kamath, U., & Shehu, A. (2018) · Bioinformatics · doi:10.1093/bioinformatics/bty179 · Cited by 593
A Comprehensive Analytical Treatment of Continuum Electrostatics
Schaefer, M., & Karplus, M. (1996) · The Journal of Physical Chemistry · doi:10.1021/jp9521621 · Cited by 561
Building Force Fields: An Automatic, Systematic, and Reproducible Approach
Wang, L.-P., Martinez, T. J., & Pande, V. S. (2014) · The Journal of Physical Chemistry Letters · doi:10.1021/jz500737m · Cited by 559
Li, L., Li, C., Zhang, Z., & Alexov, E. (2013) · Journal of Chemical Theory and Computation · doi:10.1021/ct400065j · Cited by 543
SchNet: A continuous-filter convolutional neural network for modeling quantum interactionsPreprint
Schütt, K. T., Kindermans, P.-J., Sauceda, H. E., Chmiela, S., Tkatchenko, A., & Müller, K. (2017) · arXiv (Cornell University) · Cited by 523
FreeSolv: a database of experimental and calculated hydration free energies, with input files
Mobley, D. L., & Guthrie, J. P. (2014) · Journal of Computer-Aided Molecular Design · doi:10.1007/s10822-014-9747-x · Cited by 517
Labute, P. (2008) · Journal of Computational Chemistry · doi:10.1002/jcc.20933 · Cited by 510
Machine Learning Methods for Small Data Challenges in Molecular Science
Dou, B., Zhu, Z., Merkurjev, E., Ke, L., Chen, L., Jiang, J., Zhu, Y., Liu, J., Zhang, B., & Wei, G.-W. (2023) · Chemical Reviews · doi:10.1021/acs.chemrev.3c00189 · Cited by 499
Deep Graph Library: Towards Efficient and Scalable Deep Learning on GraphsPreprint
Wang, M., Yu, L., Zheng, D., Gan, Q., Gai, Y. L., Ye, Z., Li, M., Zhou, J., Huang, Q., Ma, C., et al. (2019) · arXiv (Cornell University) · Cited by 490
Lee, M. S., Feig, M., Salsbury, F. R., & Brooks, C. L. (2003) · Journal of Computational Chemistry · doi:10.1002/jcc.10272 · Cited by 474
Accelerated Poisson–Boltzmann calculations for static and dynamic systems
Luo, R., David, L., & Gilson, M. K. (2002) · Journal of Computational Chemistry · doi:10.1002/jcc.10120 · Cited by 462
Effective Born radii in the generalized Born approximation: The importance of being perfect
Onufriev, A., Case, D. A., & Bashford, D. (2002) · Journal of Computational Chemistry · doi:10.1002/jcc.10126 · Cited by 454
Self-citationNovel generalized Born methods
Lee, M. S., Salsbury, F. R., & Brooks, C. L. (2002) · The Journal of Chemical Physics · doi:10.1063/1.1480013 · Cited by 441
Molecular Dynamics Simulations of Nucleic Acids with a Generalized Born Solvation Model
Tsui, V., & Case, D. A. (2000) · Journal of the American Chemical Society · doi:10.1021/ja9939385 · Cited by 433
Predicting Binding Free Energies: Frontiers and Benchmarks
Mobley, D. L., & Gilson, M. K. (2017) · Annual Review of Biophysics · doi:10.1146/annurev-biophys-070816-033654 · Cited by 411
Polarizable Force Fields for Biomolecular Simulations: Recent Advances and Applications
Jing, Z., Liu, C., Cheng, S. Y., Qi, R., Walker, B., Piquemal, J., & Ren, P. Y. (2019) · Annual Review of Biophysics · doi:10.1146/annurev-biophys-070317-033349 · Cited by 407
Journal of Computer-Aided Molecular Design
(2013) · Journal of Computer-Aided Molecular Design · doi:10.1007/10822.1573-4951 · Cited by 401
Generalized Born Model Based on a Surface Integral Formulation
Ghosh, A., Rapp, C. S., & Friesner, R. A. (1998) · The Journal of Physical Chemistry B · doi:10.1021/jp982533o · Cited by 386
Development of a Generalized Born Model Parametrization for Proteins and Nucleic Acids
Dominy, B. N., & Brooks, C. L. (1999) · The Journal of Physical Chemistry B · doi:10.1021/jp984440c · Cited by 375
Improving scoring-docking-screening powers of protein-ligand scoring functions using random forest
Wang, C., & Zhang, Y. (2017) · Journal of Computational Chemistry · doi:10.1002/jcc.24667 · Cited by 334
Gallicchio, E., & Levy, R. M. (2004) · Journal of Computational Chemistry · doi:10.1002/jcc.10400 · Cited by 328
Srinivasan, J., Trevathan, M. W., Beroza, P., & Case, D. A. (1999) · Theoretical Chemistry Accounts: Theory, Computation, and Modeling (Theoretica Chimica Acta) · doi:10.1007/s002140050460 · Cited by 310
Physics-guided Neural Networks (PGNN): An Application in Lake Temperature Modeling
Daw, A., Karpatne, A., Watkins, W., Read, J. S., & Kumar, V. (2017) · arXiv (Cornell University) · doi:10.48550/arxiv.1710.11431 · Cited by 300
Jia, X., Willard, J., Karpatne, A., Read, J. S., Zwart, J. A., Steinbach, M., & Kumar, V. (2021) · ACM/IMS Transactions on Data Science · doi:10.1145/3447814 · Cited by 299
Nicholls, A., Mobley, D. L., Guthrie, J. P., Chodera, J. D., Bayly, C. I., Cooper, M. D., & Pande, V. S. (2008) · Journal of Medicinal Chemistry · doi:10.1021/jm070549+ · Cited by 275
A systematic study of key elements underlying molecular property prediction
Deng, J., Yang, Z., Wang, H., Ojima, I., Samaras, D., & Wang, F. (2023) · Nature Communications · doi:10.1038/s41467-023-41948-6 · Cited by 270
FACTS: Fast analytical continuum treatment of solvation
Haberthür, U., & Caflisch, A. (2008) · Journal of Computational Chemistry · doi:10.1002/jcc.20832 · Cited by 265
Nymeyer, H., & Garcı́a, A. E. (2003) · Proceedings of the National Academy of Sciences · doi:10.1073/pnas.2232868100 · Cited by 261
Electrostatics and dynamics of proteins
Simonson, T. (2003) · Reports on Progress in Physics · doi:10.1088/0034-4885/66/5/202 · Cited by 238
Data-assisted reduced-order modeling of extreme events in complex dynamical systems
Wan, Z. Y., Vlachas, P. R., Koumoutsakos, P., & Sapsis, T. P. (2018) · PLoS ONE · doi:10.1371/journal.pone.0197704 · Cited by 222
Water models for biomolecular simulations
Onufriev, A. V., & Izadi, S. (2017) · Wiley Interdisciplinary Reviews Computational Molecular Science · doi:10.1002/wcms.1347 · Cited by 219
Self-citationTheory of electrostatic interactions in macromolecules
Gilson, M. K. (1995) · Current Opinion in Structural Biology · doi:10.1016/0959-440x(95)80079-4 · Cited by 216
Generating 3D molecules conditional on receptor binding sites with deep generative models
Ragoza, M., Masuda, T., & Koes, D. R. (2022) · Chemical Science · doi:10.1039/d1sc05976a · Cited by 208
Reduction potentials of various aromatic hydrocarbons and their univalent anions
Hoijtink, G. J., BOER, E. D., van der Meij, P. H., & Weijland, W. P. (1956) · Recueil des Travaux Chimiques des Pays-Bas · doi:10.1002/recl.19560750502 · Cited by 205
Moon, S., Zhung, W., Yang, S., Lim, J., & Kim, W. Y. (2022) · Chemical Science · doi:10.1039/d1sc06946b · Cited by 200
Anandakrishnan, R., Drozdetski, A. V., Walker, R. C., & Onufriev, A. V. (2015) · Biophysical Journal · doi:10.1016/j.bpj.2014.12.047 · Cited by 196
Self-citationChoosing the right molecular machine learning potential
Pinheiro, M., Ge, F., Ferré, N., Dral, P. O., & Barbatti, M. (2021) · Chemical Science · doi:10.1039/d1sc03564a · Cited by 190
Transfer learning for solvation free energies: From quantum chemistry to experiments
Vermeire, F. H., & Green, W. H. (2021) · Chemical Engineering Journal · doi:10.1016/j.cej.2021.129307 · Cited by 184
Extending machine learning beyond interatomic potentials for predicting molecular properties
Fedik, N. S., Zubatyuk, R. I., Kulichenko, M., Lubbers, N., Smith, J. S., Nebgen, B. T., Messerly, R. A., Li, Y. W., Boldyrev, A. I., Barros, K. M., et al. (2022) · Nature Reviews Chemistry · doi:10.1038/s41570-022-00416-3 · Cited by 184
Statistical significance of climate sensitivity predictors obtained by data mining
Caldwell, P. M., Bretherton, C. S., Zelinka, M. D., Klein, S. A., Santer, B. D., & Sanderson, B. M. (2014) · Geophysical Research Letters · doi:10.1002/2014gl059205 · Cited by 153
Neural network closures for nonlinear model order reduction
San, O., & Maulik, R. (2018) · Advances in Computational Mathematics · doi:10.1007/s10444-018-9590-z · Cited by 153
Implicit solvation based on generalized Born theory in different dielectric environments.
Feig, M., Im, W., & Brooks, C. L. (2004) · Journal of Chemical Physics · doi:10.1063/1.1631258 · Cited by 145
Continuum Electrostatic Energies of Macromolecules in Aqueous Solutions
Scarsi, M., Apostolakis, J., & Caflisch, A. (1997) · The Journal of Physical Chemistry A · doi:10.1021/jp9714227 · Cited by 140
Single-ion solvation : experimental and theoretical approaches to elusive thermodynamic quantities
Hünenberger, P. H., & Reif, M. (2011) · Cited by 134
Biological Applications of Electrostatic Calculations and Brownian Dynamics Simulations
Madura, J. D., Davist, M. E., Gilson, M. K., Wades, R. C., Luty, B. A., & McCammon, J. A. (1994) · Reviews in computational chemistry · doi:10.1002/9780470125823.ch4 · Cited by 134
An Overview of Electrostatic Free Energy Computations for Solutions and Proteins
Lin, Y.-L., Aleksandrov, A. V., Simonson, T., & Roux, B. (2014) · Journal of Chemical Theory and Computation · doi:10.1021/ct500195p · Cited by 130
Polarizable Mean-Field Model of Water for Biological Simulations with AMBER and CHARMM Force Fields
Leontyev, I. V., & Stuchebrukhov, A. A. (2012) · Journal of Chemical Theory and Computation · doi:10.1021/ct300011h · Cited by 120
Jayaram, B., Liu, Y., & Beveridge, D. L. (1998) · The Journal of Chemical Physics · doi:10.1063/1.476697 · Cited by 119
Lu, J., Hou, X., Wang, C., & Zhang, Y. (2019) · Journal of Chemical Information and Modeling · doi:10.1021/acs.jcim.9b00645 · Cited by 116
Protein molecular dynamics with the generalized born/ACE solvent model
Calimet, N., Schaefer, M. R., & Simonson, T. (2001) · Proteins Structure Function and Bioinformatics · doi:10.1002/prot.1134 · Cited by 114
Zeng, J., Giese, T. J., Ekesan, Ş., & York, D. M. (2021) · Journal of Chemical Theory and Computation · doi:10.1021/acs.jctc.1c00201 · Cited by 112
Huang, J., Lemkul, J. A., Eastman, P. K., & MacKerell, A. D. (2018) · Journal of Computational Chemistry · doi:10.1002/jcc.25339 · Cited by 111
Alibakhshi, A., & Hartke, B. (2021) · Nature Communications · doi:10.1038/s41467-021-23724-6 · Cited by 106
Knowledge-Guided Machine Learning
Karpatne, A., Kannan, R., & Kumar, V. (2022) · Chapman & Hall/CRC eBooks · doi:10.1201/9781003143376 · Cited by 106
GBr 6 : A Parameterization-Free, Accurate, Analytical Generalized Born Method
Tjong, H., & Zhou, H. (2007) · The Journal of Physical Chemistry B · doi:10.1021/jp066284c · Cited by 97
Generalized born fragment charge model for solvation effects as a function of reaction coordinate
Tucker, S. C., & Truhlar, D. G. (1989) · Chemical Physics Letters · doi:10.1016/0009-2614(89)87227-6 · Cited by 93
DR-RNN: A deep residual recurrent neural network for model reductionPreprint
Kani, J. N., & Elsheikh, A. H. (2017) · arXiv (Cornell University) · doi:10.48550/arxiv.1709.00939 · Cited by 92
New Algorithms for Macromolecular Simulation
Leimkuhler, B., Skeel, R. D., Schütte, C., Tamar Schlick, A., Mark, A. E., Laaksonen, A., Elber, R., & Chipot, C. J. (2006) · Lecture notes in computational science and engineering · doi:10.1007/3-540-31618-3 · Cited by 83
Machine learning implicit solvation for molecular dynamics
Chen, Y., Krämer, A., Charron, N. E., Husic, B. E., Clementi, C., & Noé, F. (2021) · The Journal of Chemical Physics · doi:10.1063/5.0059915 · Cited by 82
Improving Structure-Based Virtual Screening with Ensemble Docking and Machine Learning
Ricci-López, J., Águila, S. A., Gilson, M. K., & Brizuela, C. A. (2021) · Journal of Chemical Information and Modeling · doi:10.1021/acs.jcim.1c00511 · Cited by 81
Implicit solvent models for flexible protein–protein docking by molecular dynamics simulation
Wang, T., & Wade, R. C. (2002) · Proteins Structure Function and Bioinformatics · doi:10.1002/prot.10248 · Cited by 79
Zhai, Y., Caruso, A., Bore, S. L., Luo, Z., & Paesani, F. (2023) · The Journal of Chemical Physics · doi:10.1063/5.0142843 · Cited by 78
Yang, C., & Zhang, Y. (2022) · Journal of Chemical Information and Modeling · doi:10.1021/acs.jcim.2c00485 · Cited by 74
Combining Semi-Physical and Neural Network Modeling: An Example ofIts Usefulness
Forssell, U., & Lindskog, P. (1997) · IFAC Proceedings Volumes · doi:10.1016/s1474-6670(17)42938-7 · Cited by 73
Modeling aqueous solvation with semi-explicit assembly
Fennell, C. J., Kehoe, C. W., & Dill, K. A. (2011) · Proceedings of the National Academy of Sciences · doi:10.1073/pnas.1017130108 · Cited by 73
Moine, É., Privat, R., Sirjean, B., & Jaubert, J. (2017) · Journal of Physical and Chemical Reference Data · doi:10.1063/1.5000910 · Cited by 72
Biomolecular Modeling and Simulation: A Prospering Multidisciplinary Field
Tamar Schlick, A., Portillo‐Ledesma, S., Myers, C. G., Beljak, L., Chen, J. B., Dakhel, S., Darling, D., Ghosh, S., Hall, J. W., Jan, M., et al. (2021) · Annual Review of Biophysics · doi:10.1146/annurev-biophys-091720-102019 · Cited by 69
How good are polarizable and flexible models for water: Insights from a many-body perspective
Lambros, E., & Paesani, F. (2020) · The Journal of Chemical Physics · doi:10.1063/5.0017590 · Cited by 66
Machine learning implicit solvation for molecular dynamics
Chen, Y., Krämer, A., Charron, N. E., Husic, B. E., Clementi, C., & Noé, F. (2022) · Refubium (Universitätsbibliothek der Freien Universität Berlin) · doi:10.17169/refubium-33988 · Cited by 64
The Gaussian Generalized Born model: application to small molecules
Grant, J., Pickup, B. T., Sykes, M. J., Kitchen, C. A., & Nicholls, A. O. (2007) · Physical Chemistry Chemical Physics · doi:10.1039/b707574j · Cited by 61
[9] Calculations of proton-binding thermodynamics in proteins
Beroza, P., & Case, D. A. (1998) · Methods in enzymology on CD-ROM/Methods in enzymology · doi:10.1016/s0076-6879(98)95040-6 · Cited by 59
Reducing the Secondary Structure Bias in the Generalized Born Model via R6 Effective Radii
Aguilar, B. H., Shadrach, R., & Onufriev, A. V. (2010) · Journal of Chemical Theory and Computation · doi:10.1021/ct100392h · Cited by 56
Self-citationImplicit Solvent Electrostatics in Biomolecular Simulation
Baker, N., Bashford, D., & Case, D. A. (2006) · Springer eBooks · doi:10.1007/3-540-31618-3_15 · Cited by 55
Deep Learning for the Life Sciences
Oskolkov, N. (2024) · doi:10.61700/zjxxse1x3u05y1846 · Cited by 54
Solvent-Specific Featurization for Predicting Free Energies of Solvation through Machine Learning
Hutchinson, S. T., & Kobayashi, R. (2019) · Journal of Chemical Information and Modeling · doi:10.1021/acs.jcim.8b00901 · Cited by 53
Continuum Electrostatics Solvent Modeling with the Generalized Born Model
Onufriev, A. V. (2010) · Wiley eBooks · doi:10.1002/9783527629251.ch6 · Cited by 52
Self-citationBiomolecular electrostatics—I want your solvation (model)
Bardhan, J. P. (2012) · Computational Science & Discovery · doi:10.1088/1749-4699/5/1/013001 · Cited by 49
Protein–Ligand Electrostatic Binding Free Energies from Explicit and Implicit Solvation
Izadi, S., Aguilar, B. H., & Onufriev, A. V. (2015) · Journal of Chemical Theory and Computation · doi:10.1021/acs.jctc.5b00483 · Cited by 49
Self-citationYu, J., Zhang, C., Cheng, Y., Yang, Y., She, Y., Liu, F., Su, W., & Su, A. (2023) · Digital Discovery · doi:10.1039/d2dd00107a · Cited by 47
Gebhardt, J., Kiesel, M., Riniker, S., & Hansen, N. (2020) · Journal of Chemical Information and Modeling · doi:10.1021/acs.jcim.0c00479 · Cited by 46
Accurate determination of solvation free energies of neutral organic compounds from first principles
Pereyaslavets, L. B., Kamath, G., Butin, O., Illarionov, A., Olevanov, M. A., Kurnikov, I. V., Sakipov, S. N., Leontyev, I. V., Воронина, Е. Н., Gannon, T., et al. (2022) · Nature Communications · doi:10.1038/s41467-022-28041-0 · Cited by 44
Introducing Charge Hydration Asymmetry into the Generalized Born Model
Mukhopadhyay, A., Aguilar, B. H., Tolokh, I. S., & Onufriev, A. V. (2014) · Journal of Chemical Theory and Computation · doi:10.1021/ct4010917 · Cited by 41
Self-citationLange, A. W., & Herbert, J. M. (2012) · Journal of Chemical Theory and Computation · doi:10.1021/ct300111m · Cited by 41
Elhamod, M., Bu, J., Singh, C. N., Redell, M. D., Ghosh, A., Podolskiy, V. A., Lee, W., & Karpatne, A. (2022) · ACM Transactions on Intelligent Systems and Technology · doi:10.1145/3530911 · Cited by 41
Gao, K.-F., Yin, J., Henriksen, N. M., Fenley, A. T., & Gilson, M. (2015) · Journal of Chemical Theory and Computation · doi:10.1021/acs.jctc.5b00676 · Cited by 40
Explainable Supervised Machine Learning Model To Predict Solvation Gibbs Energy
Ferraz-Caetano, J., Teixeira, F., & Cordeiro, M. N. D. S. (2023) · Journal of Chemical Information and Modeling · doi:10.1021/acs.jcim.3c00544 · Cited by 40
Hydration free energies from kernel-based machine learning: Compound-database bias
Rauer, C., & Bereau, T. (2020) · The Journal of Chemical Physics · doi:10.1063/5.0012230 · Cited by 37
Bind3P: Optimization of a Water Model Based on Host–Guest Binding Data
Yin, J., Henriksen, N. M., Muddana, H. S., & Gilson, M. K. (2018) · Journal of Chemical Theory and Computation · doi:10.1021/acs.jctc.8b00318 · Cited by 35
Grid-Based Surface Generalized Born Model for Calculation of Electrostatic Binding Free Energies
Forouzesh, N., Izadi, S., & Onufriev, A. V. (2017) · Journal of Chemical Information and Modeling · doi:10.1021/acs.jcim.7b00192 · Cited by 34
Self-citationFast Polarizable Water Model for Atomistic Simulations
Xiong, Y., Izadi, S., & Onufriev, A. V. (2022) · Journal of Chemical Theory and Computation · doi:10.1021/acs.jctc.2c00378 · Cited by 34
Self-citationA strategy for reducing gross errors in the generalized Born models of implicit solvation
Onufriev, A. V., & Sigalov, G. (2011) · The Journal of Chemical Physics · doi:10.1063/1.3578686 · Cited by 28
Self-citationRaman, E. P., & MacKerell, A. D. (2015) · Journal of the American Chemical Society · doi:10.1021/ja512054f · Cited by 27
Manzoni, F., & Söderhjelm, P. (2014) · Journal of Computer-Aided Molecular Design · doi:10.1007/s10822-014-9733-3 · Cited by 21
Cain, S., Risheh, A., & Forouzesh, N. (2022) · Biomolecules · doi:10.3390/biom12070919 · Cited by 20
Bass, L. M., Elder, L. H., Folescu, D. E., Forouzesh, N., Tolokh, I. S., Karpatne, A., & Onufriev, A. V. (2023) · Journal of Chemical Theory and Computation · doi:10.1021/acs.jctc.3c00981 · Cited by 10
Self-citationMachine-Learned Molecular Surface and Its Application to Implicit Solvent Simulations
Wei, H., Zhao, Z., & Luo, R. (2021) · Journal of Chemical Theory and Computation · doi:10.1021/acs.jctc.1c00492 · Cited by 8
Yadav, A. K., Prakash, M. V., & Bandyopadhyay, P. (2025) · The Journal of Physical Chemistry B · doi:10.1021/acs.jpcb.4c07090 · Cited by 6
Ansari, R., & Ghorbani, A. (2021) · arXiv (Cornell University) · doi:10.48550/arxiv.2105.02048 · Cited by 4
Research works printed but not linked: 12
- 10.1021/jp994072s · DOI · Paper page
- Goodfellow I., 2016, Deep Learning
- 10.48550/arXiv.1706.08566 · DOI
- Duvenaud D. K., 2015, Adv. Neural Inf. Process. Syst., 28, 1
- 10.1039/D1SC06946B · DOI
- 10.48550/arXiv.1705.08532 · DOI
- 10.1002/wcms.1347 · DOI
- Srivastava N., 2014, J. Mach. Learn. Res., 15, 1929
- 10.48550/arXiv.1511.06391 · DOI · Paper page
- 10.1021/ct100392h · DOI
- Marenich, A. V.; Kelly, C. P.; Thompson, J. D.; Hawkins, G. D.; Chambers, C. C.; Giesen, D. J.; Winget, P.; Cramer, C. J.; Truhlar, D. G. Minnesota Solvation Database (MNSOL) version 2012. 2020, http://hdl.handle.net/11299/213300.
- 10.48550/arXiv.1612.01474 · DOI · Paper page
Metadata
- Authors
- Elder, L. H., & Onufriev, A. V.
- Affiliations
- Virginia Tech (US)
- Corresponding author
- Onufriev, Alexey V.
- Venue
- The Journal of Physical Chemistry B
- Publisher
- American Chemical Society (ACS)
- Published
- 2025-07-11
- Volume
- 129
- Issue
- 29
- Pages
- 7483-7498
- ISSN
- 1520-5207 (ISSN-L)
- 1520-6106
- PMC
- PMC12302205
- OpenAlex
- W4412188548
- Cited by
- 2
- References
- 149
- Citations by year
- 2026: 2
- FWCI
- 0.73
- Type
- journal article
- Language
- en
- Open access
- hybrid
- doi.org
- Licence
- Locations
- The Journal of Physical Chemistry B (publishedVersion, cc-by)
- ChemRxiv (acceptedVersion, cc-by)
- PubMed Central (publishedVersion, cc-by)
- PubMed (publishedVersion)
- Funders
- National Institute of General Medical Sciences (R01 GM144596)
- Topics
- Physical Sciences › Physics and Astronomy › Atomic and Molecular Physics, and Optics › Advanced Chemical Physics Studies
- Life Sciences › Pharmacology, Toxicology and Pharmaceutics › Drug Discovery › Computational Drug Discovery Methods
- Physical Sciences › Materials Science › Materials Chemistry › Machine Learning in Materials Science
- Keywords
- hydration free energy, graph neural networks, out-of-distribution generalization, hybrid physics-machine learning models, molecular solvation, experimental uncertainty
About these checks
Registry, retraction, Cites and statistics results are computed, not judged, with one exception: a printed reference that no index lists is read once by a model before it counts as a citation error. Claims are extracted by a model and kept only when their quote appears verbatim in the text; each cited source is then checked, with a model’s help, for whether it says what the claim relies on. Those verdicts can be wrong — read the claim’s quote and the cited source before relying on one.
Statistics and arithmetic are recomputed, not judged.
Confidence bands are shown only for fields calibrated on our annotated test set. None is calibrated yet, so no band is shown.
What counts as a claim ›How we measure confidence ›How we check this ›
Are you an author, or do you see a problem with this page? Request a review
Data sources
Bibliographic data: Semantic Scholar, OpenAlex, Crossref.
Contains information from the Semantic Scholar Academic Graph Datasets, made available under the ODC Attribution License (ODC-BY 1.0).
Semantic Scholar’s data is described in: Kinney, R., et al. (2023). The Semantic Scholar Open Data Platform. arXiv:2301.10140.
