Cited by 202Autophagy in Disease and TherapyHepatocellular Carcinoma Treatment and PrognosisCell death mechanisms and regulation

The DOI matches its Crossref record; 43 of the 43 references it cites were found in a registry or an index.

Mcl-1-dependent activation of Beclin 1 mediates autophagic cell death induced by sorafenib and SC-59 in hepatocellular carcinoma cells

Open access
Tai, W-T, Shiau, C-W, Chen, H-L, Liu, C-Y, Lin, C-S, Cheng, A-L, Chen, P-J, Chen, K-F·2013·Cell Death & Disease

Abstract

We investigated the molecular mechanisms underlying the effect of sorafenib and SC-59, a novel sorafenib derivative, on hepatocellular carcinoma (HCC). Sorafenib activated autophagy in a dose- and time-dependent manner in the HCC cell lines PLC5, Sk-Hep1, HepG2 and Hep3B. Sorafenib downregulated phospho-STAT3 (P-STAT3) and subsequently reduced the expression of myeloid cell leukemia-1 (Mcl-1). Inhibition of Mcl-1 by sorafenib resulted in disruption of the Beclin 1-Mcl-1 complex; however, sorafenib did not affect the amount of Beclin 1, suggesting that sorafenib treatment released Beclin 1 from binding with Mcl-1. Silencing of SHP-1 by small interference RNA (siRNA) reduced the effect of sorafenib on P-STAT3 and autophagy. Ectopic expression of Mcl-1 abolished the effect of sorafenib on autophagy. Knockdown of Beclin 1 by siRNA protected the cells from sorafenib-induced autophagy. Moreover, SC-59, a sorafenib derivative, had a more potent effect on cancer cell viability than sorafenib. SC-59 downregulated P-STAT3 and induced autophagy in all tested HCC cell lines. Furthermore, our in vivo data showed that both sorafenib and SC-59 inhibited tumor growth, downregulated P-STAT3, enhanced the activity of SHP-1 and induced autophagy in PLC5 tumors, suggesting that sorafenib and SC-59 activate autophagy in HCC. In conclusion, sorafenib and SC-59 induce autophagy in HCC through a SHP-1-STAT3-Mcl-1-Beclin 1 pathway.

Overview

The claims and statistics of this paper haven’t been checked yet.

Run the check — free, no account needed. It reads the open-access text and checks the sources it cites.

A few free checks a day · papers already verified open instantly · results are public

Integrity signals

Registry

Crossref · 10.1038/cddis.2013.18

Cites

43 of 43 references verified0 citation errors · 0 not checkable

Statistics

Figures

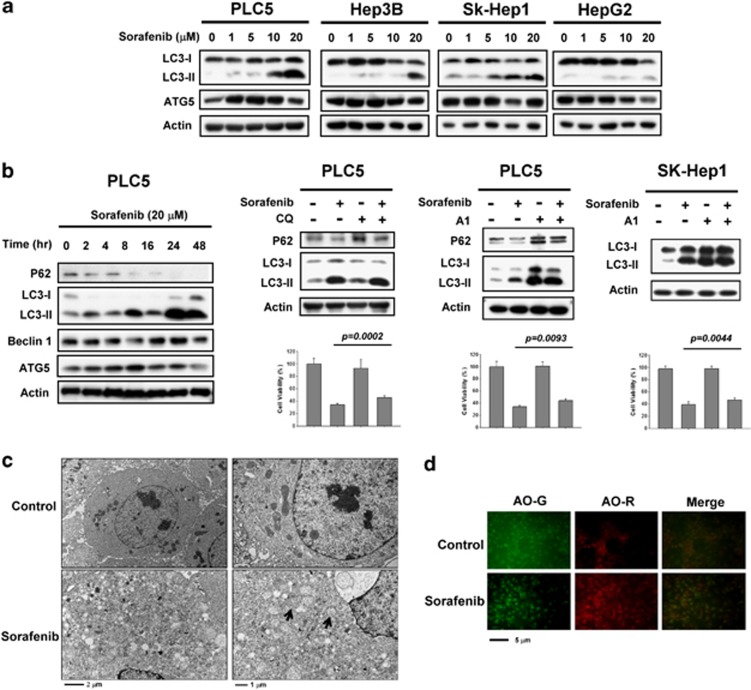
Figure 1 Sorafenib induces autophagy in HCC cells. (a) Sorafenib induces the conversion of LC3 in a dose-dependent manner. PLC5, Hep3B, SK-Hep1 and HepG2 were exposed to sorafenib at the indicated doses for 16 h and the expression levels of LC3-II were analyzed by western blot. (b) Time-dependent effect of sorafenib on autophagy-related proteins. PLC5 cells were exposed to 20 μM sorafenib for various periods of time (left). Sorafenib activates autophagic flux in PLC5 cells (middle). Western blot showing P62 degradation and LC3 lipidation in PLC5 cells treated with sorafenib and/or lysosomal inhibitor. The cells were treated with or without 20 μM sorafenib in the presence or absence of 10 μM chloroquine (CQ) for 16 h. PLC5 or SK-Hep1 cells were treated with or without 20 μM sorafenib in the presence or absence of 20 nM bafilomycin A1 (A1) for 16 h (right). The effect of CQ or A1 on cell viability was performed in MTT assay. (c) Transmission electron microscopy (TEM) images showing autophagosome (arrow) formation in PLC5 cells treated with 20 μM sorafenib for 16 h. (d) Images of acridine orange (AO) staining of HCC cells after 16 h treatment with 20 μM sorafenib as detected by fluorescence microscopy. AO-R indicates acidic vesicular organelle formation
Figure 1 Sorafenib induces autophagy in HCC cells. (a) Sorafenib induces the conversion of LC3 in a dose-dependent manner. PLC5, Hep3B, SK-Hep1 and HepG2 were exposed to sorafenib at the indicated doses for 16 h and the expression levels of LC3-II were analyzed by western blot. (b) Time-dependent effect of sorafenib on autophagy-related proteins. PLC5 cells were exposed to 20 μM sorafenib for various periods of time (left). Sorafenib activates autophagic flux in PLC5 cells (middle). Western blot showing P62 degradation and LC3 lipidation in PLC5 cells treated with sorafenib and/or lysosomal inhibitor. The cells were treated with or without 20 μM sorafenib in the presence or absence of 10 μM chloroquine (CQ) for 16 h. PLC5 or SK-Hep1 cells were treated with or without 20 μM sorafenib in the presence or absence of 20 nM bafilomycin A1 (A1) for 16 h (right). The effect of CQ or A1 on cell viability was performed in MTT assay. (c) Transmission electron microscopy (TEM) images showing autophagosome (arrow) formation in PLC5 cells treated with 20 μM sorafenib for 16 h. (d) Images of acridine orange (AO) staining of HCC cells after 16 h treatment with 20 μM sorafenib as detected by fluorescence microscopy. AO-R indicates acidic vesicular organelle formationCC BY-NC-ND · PubMed Central
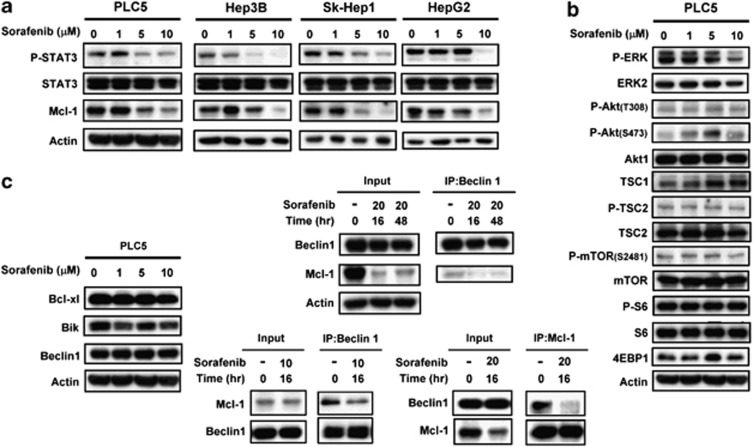
Figure 2 Sorafenib disrupts the Beclin 1–Mcl-1-complex through inhibition of the p-STAT3-related signaling pathway. (a) Effects of sorafenib on STAT3-related proteins in HCC cells. The cells were treated with sorafenib at the indicated dose for 16 h. (b) Effects of sorafenib on the Akt/mTOR-related signaling pathway in PLC5 cells. The cells were treated with sorafenib at the indicated dose for 16 h. (c) Effects of sorafenib on Bcl-2 related proteins (left). The cells were treated with sorafenib at the indicated dose for 16 h. Sorafenib does not affect the amount of Bcl-xl, Bik and Beclin 1. Sorafenib induces the disassociation of Beclin 1 and Mcl-1 (middle). Beclin 1 was immunoprecipitated from PLC5 cells treated with 10 or 20 μM sorafenib at 16 h or 48 h and analyzed for the presence of Mcl-1 and Beclin 1. Mcl-1 was immunoprecipitated from PLC5 cells treated with 20 μM sorafenib at 16 h and analyzed for the presence of Mcl-1 and Beclin 1 (right)
Figure 2 Sorafenib disrupts the Beclin 1–Mcl-1-complex through inhibition of the p-STAT3-related signaling pathway. (a) Effects of sorafenib on STAT3-related proteins in HCC cells. The cells were treated with sorafenib at the indicated dose for 16 h. (b) Effects of sorafenib on the Akt/mTOR-related signaling pathway in PLC5 cells. The cells were treated with sorafenib at the indicated dose for 16 h. (c) Effects of sorafenib on Bcl-2 related proteins (left). The cells were treated with sorafenib at the indicated dose for 16 h. Sorafenib does not affect the amount of Bcl-xl, Bik and Beclin 1. Sorafenib induces the disassociation of Beclin 1 and Mcl-1 (middle). Beclin 1 was immunoprecipitated from PLC5 cells treated with 10 or 20 μM sorafenib at 16 h or 48 h and analyzed for the presence of Mcl-1 and Beclin 1. Mcl-1 was immunoprecipitated from PLC5 cells treated with 20 μM sorafenib at 16 h and analyzed for the presence of Mcl-1 and Beclin 1 (right)CC BY-NC-ND · PubMed Central
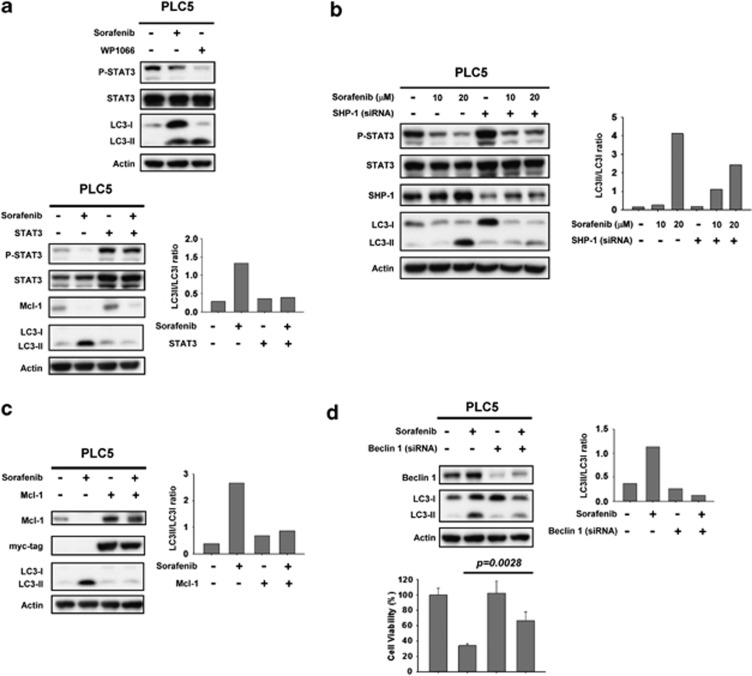
Figure 3 Inhibition of p-STAT3 is involved in sorafenib-induced autophagy through the induction of SHP phosphatase activity. (a) Specific inhibition of p-STAT3 induces significant autophagic activity. WP1066, a specific inhibitor of STAT3, induces autophagy in PLC5 cells (top). Cells ectopically expressing STAT3 were treated with sorafenib at 10 μM for 16 h and the level of expression of LC3-II was measured (bottom). (b) Silencing SHP-1 by siRNA reduces the effect of sorafenib on p-STAT3 and LC3-II in HCC cells. PLC5 cells were transfected with control siRNA or SHP-1 siRNA for 24 h and then treated with sorafenib for 16 h. (c) Effects of Mcl-1 on autophagy induced by sorafenib in HCC cells. Wild-type PLC5 or PLC5 transiently transfected with Mcl-1 were treated with sorafenib at 10 μM for 16 h. (d) Silencing Beclin 1 by siRNA reduces the effects of sorafenib on LC3-II in HCC cells. PLC5 cells were transfected with control siRNA or Beclin 1 siRNA for 24 h, then treated with sorafenib at 10 μM for 16 h. The effect of siBeclin 1 on cell viability was demonstrated in MTT assay
Figure 3 Inhibition of p-STAT3 is involved in sorafenib-induced autophagy through the induction of SHP phosphatase activity. (a) Specific inhibition of p-STAT3 induces significant autophagic activity. WP1066, a specific inhibitor of STAT3, induces autophagy in PLC5 cells (top). Cells ectopically expressing STAT3 were treated with sorafenib at 10 μM for 16 h and the level of expression of LC3-II was measured (bottom). (b) Silencing SHP-1 by siRNA reduces the effect of sorafenib on p-STAT3 and LC3-II in HCC cells. PLC5 cells were transfected with control siRNA or SHP-1 siRNA for 24 h and then treated with sorafenib for 16 h. (c) Effects of Mcl-1 on autophagy induced by sorafenib in HCC cells. Wild-type PLC5 or PLC5 transiently transfected with Mcl-1 were treated with sorafenib at 10 μM for 16 h. (d) Silencing Beclin 1 by siRNA reduces the effects of sorafenib on LC3-II in HCC cells. PLC5 cells were transfected with control siRNA or Beclin 1 siRNA for 24 h, then treated with sorafenib at 10 μM for 16 h. The effect of siBeclin 1 on cell viability was demonstrated in MTT assayCC BY-NC-ND · PubMed Central
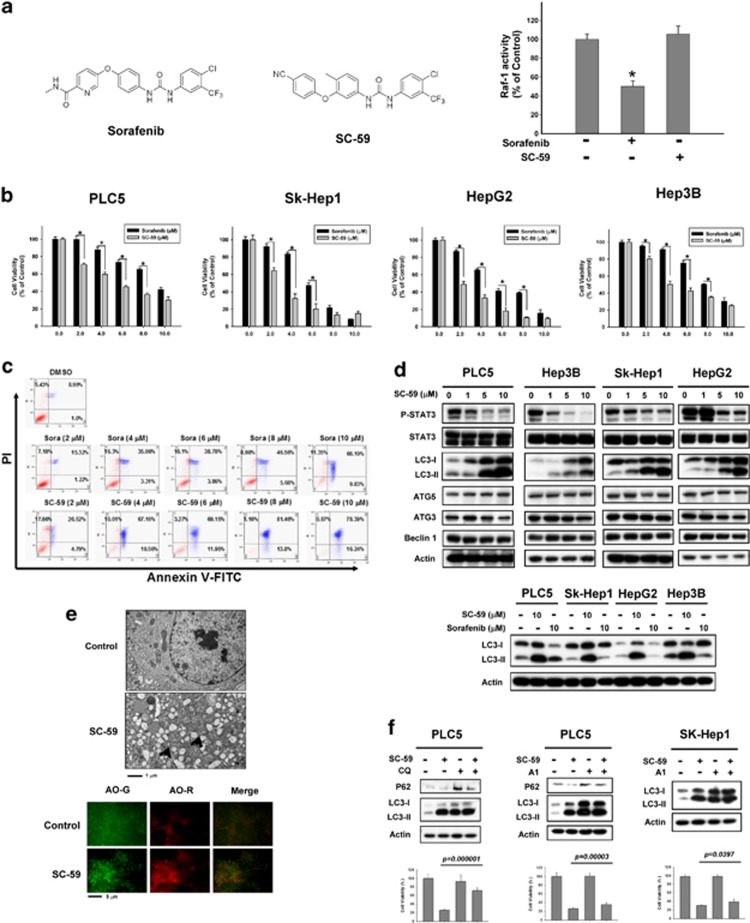
Figure 4 SC-59, a kinase-independent derivative of sorafenib, is a more effective anticancer agent than sorafenib in HCC cells. (a) Chemical structures of sorafenib and SC-59 (left). Effect of sorafenib and SC-59 on Raf-1 activity. Hep3B cells were treated with sorafenib or SC-59 at 10 μM for 24 h (right). Columns, mean; bars, S.D. (n=3). *P<0.05. (b) The cell viability of sorafenib and SC-59 in four HCC cell lines. The cells were treated with sorafenib or SC-59 at indicated dose for 48 h and cell viability was assessed by MTT assay. Columns, mean; bars, S.D. (n=8). *P<0.05. (c) Both sorafenib and SC-59 induced significant apoptosis in a dose-dependent manner. The early and late apoptosis was observed in sorafenib or SC-59-treated PLC5 cells. (d) SC-59 downregulates p-STAT3 and increases LC3-II in HCC cells (upper). The cells were treated with SC-59 at indicated dose for 16 h. SC-59 induces more LC3-II than sorafenib. The cells were treated with 10 μM SC-59 or sorafenib for 16 h (lower). (e) Transmission electron microscopy images showing autophagosome (arrow) formation in PLC5 cells treated with 10 μM SC-59 for 16 h (upper). fluorescence microscopy images of AO staining in HCC cells after 16 h treatment with 10 μM SC-59 (lower). AO-R indicates acidic vesicular organelle formation, which demonstrates the formation of autolysosomes. (f) SC-59 activates autophagic flux in PLC5 and SK-Hep1 (left). Western blot showing P62 degradation and LC3 lipidation in PLC5 cells treated with SC-59 and/or lysosomal inhibitor. The cells were treated with or without 10 μM SC-59 in the presence or absence of 10 μM chloroquine (CQ) for 16 h. PLC5 or SK-Hep1 cells were treated with or without 10 μM SC-59 in the presence or absence of 20 nM Bafilomycin A1 (A1) for 16 h (right). The effect of CQ or A1 on cell viability was performed in MTT assay
Figure 4 SC-59, a kinase-independent derivative of sorafenib, is a more effective anticancer agent than sorafenib in HCC cells. (a) Chemical structures of sorafenib and SC-59 (left). Effect of sorafenib and SC-59 on Raf-1 activity. Hep3B cells were treated with sorafenib or SC-59 at 10 μM for 24 h (right). Columns, mean; bars, S.D. (n=3). *P<0.05. (b) The cell viability of sorafenib and SC-59 in four HCC cell lines. The cells were treated with sorafenib or SC-59 at indicated dose for 48 h and cell viability was assessed by MTT assay. Columns, mean; bars, S.D. (n=8). *P<0.05. (c) Both sorafenib and SC-59 induced significant apoptosis in a dose-dependent manner. The early and late apoptosis was observed in sorafenib or SC-59-treated PLC5 cells. (d) SC-59 downregulates p-STAT3 and increases LC3-II in HCC cells (upper). The cells were treated with SC-59 at indicated dose for 16 h. SC-59 induces more LC3-II than sorafenib. The cells were treated with 10 μM SC-59 or sorafenib for 16 h (lower). (e) Transmission electron microscopy images showing autophagosome (arrow) formation in PLC5 cells treated with 10 μM SC-59 for 16 h (upper). fluorescence microscopy images of AO staining in HCC cells after 16 h treatment with 10 μM SC-59 (lower). AO-R indicates acidic vesicular organelle formation, which demonstrates the formation of autolysosomes. (f) SC-59 activates autophagic flux in PLC5 and SK-Hep1 (left). Western blot showing P62 degradation and LC3 lipidation in PLC5 cells treated with SC-59 and/or lysosomal inhibitor. The cells were treated with or without 10 μM SC-59 in the presence or absence of 10 μM chloroquine (CQ) for 16 h. PLC5 or SK-Hep1 cells were treated with or without 10 μM SC-59 in the presence or absence of 20 nM Bafilomycin A1 (A1) for 16 h (right). The effect of CQ or A1 on cell viability was performed in MTT assayCC BY-NC-ND · PubMed Central
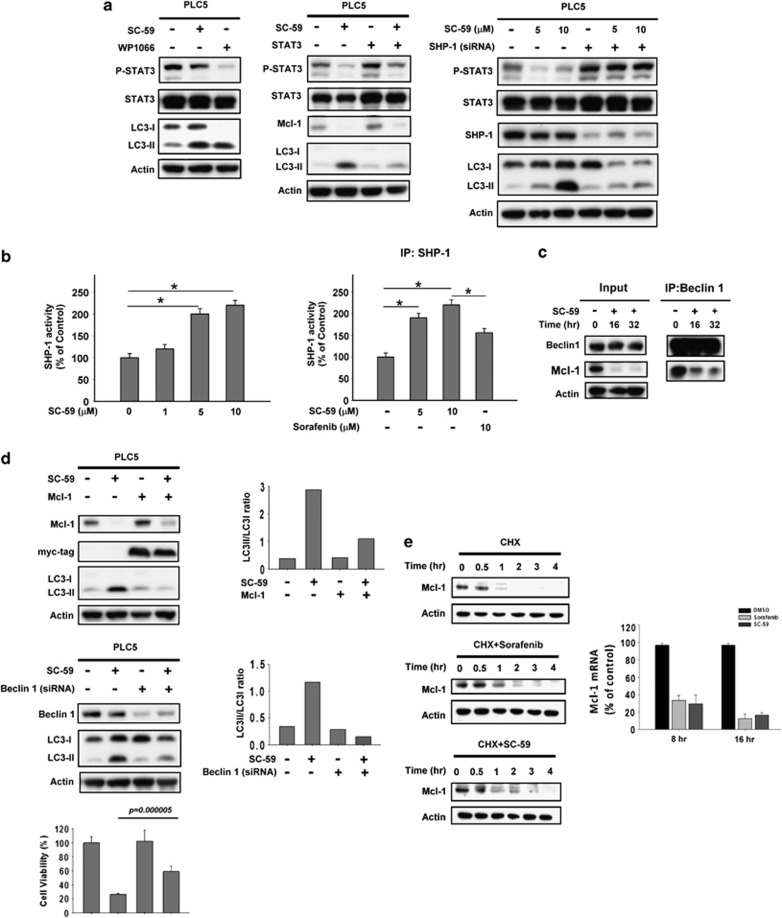
Figure 5 Target validation of SHP-1-STAT3-Mcl-1 in sorafenib-induced autophagy. (a) Effect of STAT3 on autophagy induced by SC-59 in HCC cells. WP1066, a specific STAT3 inhibitor (left). Cells with parental or ectopic expression of STAT3 were treated with SC-59 at 10 μM for 16 h (middle). Silencing SHP-1 by siRNA reduces effects of SC-59 on p-STAT3 and LC3-II in HCC cells (right). PLC5 cells were transfected with control siRNA or SHP-1 siRNA for 24 h, then treated with SC-59 for 16 h. (b) The activity of SHP-1 in PLC5 cells treated with SC-59 at indicated dose for 16 h (left). Columns, mean; bars, S.D. (n=3). *P<0.05. Effects of SC-59 and sorafenib on SHP-1 (right). Sorafenib or SC-59 was incubated with SHP-1-containing extract for 30 min in vitro. Columns, mean; bars, S.D. (n=3). *P<0.05. (c) Effects of SC-59 on protein interactions between Beclin1 and Mcl-1. Beclin1 was immunoprecipitated from PLC5 cells treated with 10 μM SC-59 at 16 h or 32 h and analyzed for the presence of Mcl-1 and Beclin 1. (d) Effects of Mcl-1 on autophagy induced by SC-59 in HCC cells (left). PLC5 wild type or transient transfected of Mcl-1 were treated with SC-59 at 10 μM for 16 h. Silencing Beclin 1 by siRNA reduces effects of SC-59 on LC3-II in HCC cells (right). PLC5 cells were transfected with control siRNA or Beclin 1 siRNA for 24 h, then treated with SC-59 at 10 μM or 16 h. The effect of suppressed Beclin 1 on cell viability was analyzed in MTT assay. (e) Sorafenib and SC-59 downregulates the transcription of Mcl-1. PLC5 cells were treated with 50 μg/ml cycloheximide in the absence (upper) or the presence of 20 μM sorafenib (middle) or 10 μM SC-59 (lower) for the indicated time (left). Both sorafenib and SC-59 inhibit Mcl-1 mRNA in a time-dependent manner as evident by real-time PCR (right)
Figure 5 Target validation of SHP-1-STAT3-Mcl-1 in sorafenib-induced autophagy. (a) Effect of STAT3 on autophagy induced by SC-59 in HCC cells. WP1066, a specific STAT3 inhibitor (left). Cells with parental or ectopic expression of STAT3 were treated with SC-59 at 10 μM for 16 h (middle). Silencing SHP-1 by siRNA reduces effects of SC-59 on p-STAT3 and LC3-II in HCC cells (right). PLC5 cells were transfected with control siRNA or SHP-1 siRNA for 24 h, then treated with SC-59 for 16 h. (b) The activity of SHP-1 in PLC5 cells treated with SC-59 at indicated dose for 16 h (left). Columns, mean; bars, S.D. (n=3). *P<0.05. Effects of SC-59 and sorafenib on SHP-1 (right). Sorafenib or SC-59 was incubated with SHP-1-containing extract for 30 min in vitro. Columns, mean; bars, S.D. (n=3). *P<0.05. (c) Effects of SC-59 on protein interactions between Beclin1 and Mcl-1. Beclin1 was immunoprecipitated from PLC5 cells treated with 10 μM SC-59 at 16 h or 32 h and analyzed for the presence of Mcl-1 and Beclin 1. (d) Effects of Mcl-1 on autophagy induced by SC-59 in HCC cells (left). PLC5 wild type or transient transfected of Mcl-1 were treated with SC-59 at 10 μM for 16 h. Silencing Beclin 1 by siRNA reduces effects of SC-59 on LC3-II in HCC cells (right). PLC5 cells were transfected with control siRNA or Beclin 1 siRNA for 24 h, then treated with SC-59 at 10 μM or 16 h. The effect of suppressed Beclin 1 on cell viability was analyzed in MTT assay. (e) Sorafenib and SC-59 downregulates the transcription of Mcl-1. PLC5 cells were treated with 50 μg/ml cycloheximide in the absence (upper) or the presence of 20 μM sorafenib (middle) or 10 μM SC-59 (lower) for the indicated time (left). Both sorafenib and SC-59 inhibit Mcl-1 mRNA in a time-dependent manner as evident by real-time PCR (right)CC BY-NC-ND · PubMed Central
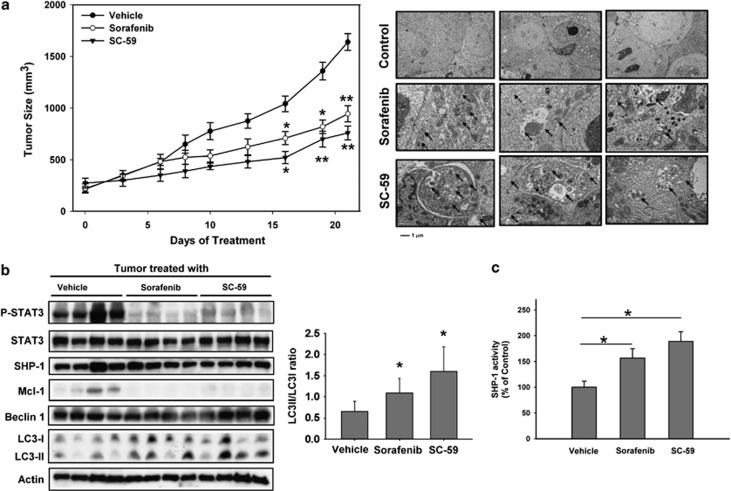
Figure 6 SC-59 exhibits more potent tumor growth inhibition and reveals significant SHP-1 activity and higher levels of expression of LC3-II than sorafenib in HCC-bearing mice. (a) Sorafenib (20 mg/kg) and SC-59 (20 mg/kg) inhibit PLC5 tumor growth (left). Points, mean; bars, S.E. (n=10). *P<0.05. **P<0.01. SC-59 and sorafenib-induced autophagosomes were demonstrated in the tumor sample (right). (b) Western blot analysis of p-STAT3, STAT3, SHP-1, Mcl-1, Beclin 1 and LC3 in PLC5 tumors. (c) SHP-1 activity in PLC5 tumors. Columns, mean; bars, S.D. (n=10). *P<0.05
Figure 6 SC-59 exhibits more potent tumor growth inhibition and reveals significant SHP-1 activity and higher levels of expression of LC3-II than sorafenib in HCC-bearing mice. (a) Sorafenib (20 mg/kg) and SC-59 (20 mg/kg) inhibit PLC5 tumor growth (left). Points, mean; bars, S.E. (n=10). *P<0.05. **P<0.01. SC-59 and sorafenib-induced autophagosomes were demonstrated in the tumor sample (right). (b) Western blot analysis of p-STAT3, STAT3, SHP-1, Mcl-1, Beclin 1 and LC3 in PLC5 tumors. (c) SHP-1 activity in PLC5 tumors. Columns, mean; bars, S.D. (n=10). *P<0.05CC BY-NC-ND · PubMed Central

Verification

Claims the paper makes

The claims and statistics of this paper haven’t been checked yet.

Run the check — free, no account needed. It reads the open-access text and checks the sources it cites.

A few free checks a day · papers already verified open instantly · results are public

Claims other papers make about this one

Each is checked against this paper’s own text: does it say what the citing paper says it does?

Self-check

Percentages, sums and reported differences re-computed from the paper’s own numbers.

The self-check needs the paper’s full text.

Citations

Cites

Show all 43 references

Cited by

Sorted by citations

See all 202

Metadata

Authors
Tai, W.-T., Shiau, C.-W., Chen, H.-L., Liu, C.-Y., Lin, C.-S., Cheng, A.-L., Chen, P.-J., & Chen, K.-F.
Affiliations
  • National Taiwan University Hospital (TW)
  • National Yang Ming University (TW)
  • Taipei Veterans General Hospital (TW)
  • National Taiwan University (TW)
Corresponding author
Chen, K-F
Venue
Cell Death & Disease
Published
2013-02-07
Volume
4
Issue
2
Pages
e485-e485
ISSN
2041-4889 (ISSN-L)
OpenAlex
W2076745136
Cited by
202
References
43
Citations by year
2026: 3 · 2025: 8 · 2024: 15 · 2023: 13 · 2022: 10 · 2021: 20 · 2020: 21 · 2019: 16 · 2018: 24 · 2017: 19 · 2016: 12 · 2015: 17 · 2014: 16 · 2013: 7
FWCI
12.65
Type
journal article
Language
en
Open access
Locations
  • Cell Death and Disease (publishedVersion, cc-by-nc-nd)
  • Europe PMC (PubMed Central) (publishedVersion, cc-by-nc-nd)
  • PubMed Central (publishedVersion, cc-by-nc-nd)
  • PubMed (publishedVersion)
Funders
  • National Science Council (100-2325-B-002 -032)
  • National Taiwan University Hospital (NTUH 101P01)
  • National Taiwan University
Topics
  • Life Sciences › Biochemistry, Genetics and Molecular Biology › Cell Biology › Autophagy in Disease and Therapy
  • Health Sciences › Medicine › Hepatology › Hepatocellular Carcinoma Treatment and Prognosis
  • Life Sciences › Biochemistry, Genetics and Molecular Biology › Molecular Biology › Cell death mechanisms and regulation
Keywords
sorafenib, hepatocellular carcinoma, autophagy, autophagic cell death, Beclin-1, Mcl-1, STAT3, SHP-1, anticancer agents
MeSH terms
Beclin-1, Sorafenib, Animals, Antineoplastic Agents, Carcinoma, Hepatocellular, Humans, Liver Neoplasms, Membrane Proteins, Mice, Nude, Niacinamide, Phenylurea Compounds, Phosphorylation, Transplantation, Heterologous, Down-Regulation, Apoptosis, Proto-Oncogene Proteins c-bcl-2, RNA Interference, RNA, Small Interfering, Cell Line, Tumor, STAT3 Transcription Factor, Apoptosis Regulatory Proteins, Mice, Protein Tyrosine Phosphatase, Non-Receptor Type 6, Hep G2 Cells, Myeloid Cell Leukemia Sequence 1 Protein

About these checks

Registry, retraction, Cites and statistics results are computed, not judged, with one exception: a printed reference that no index lists is read once by a model before it counts as a citation error. Claims are extracted by a model and kept only when their quote appears verbatim in the text; each cited source is then checked, with a model’s help, for whether it says what the claim relies on. Those verdicts can be wrong — read the claim’s quote and the cited source before relying on one.

Statistics and arithmetic are recomputed, not judged.

Confidence bands are shown only for fields calibrated on our annotated test set. None is calibrated yet, so no band is shown.

What counts as a claim ›How we measure confidence ›How we check this ›

Are you an author, or do you see a problem with this page? Request a review