

The DOI matches its Crossref record; 83 of the 83 references it cites were found in a registry or an index.
Dysfunctional autophagy in RPE, a contributing factor in age-related macular degeneration
Open accessAbstract
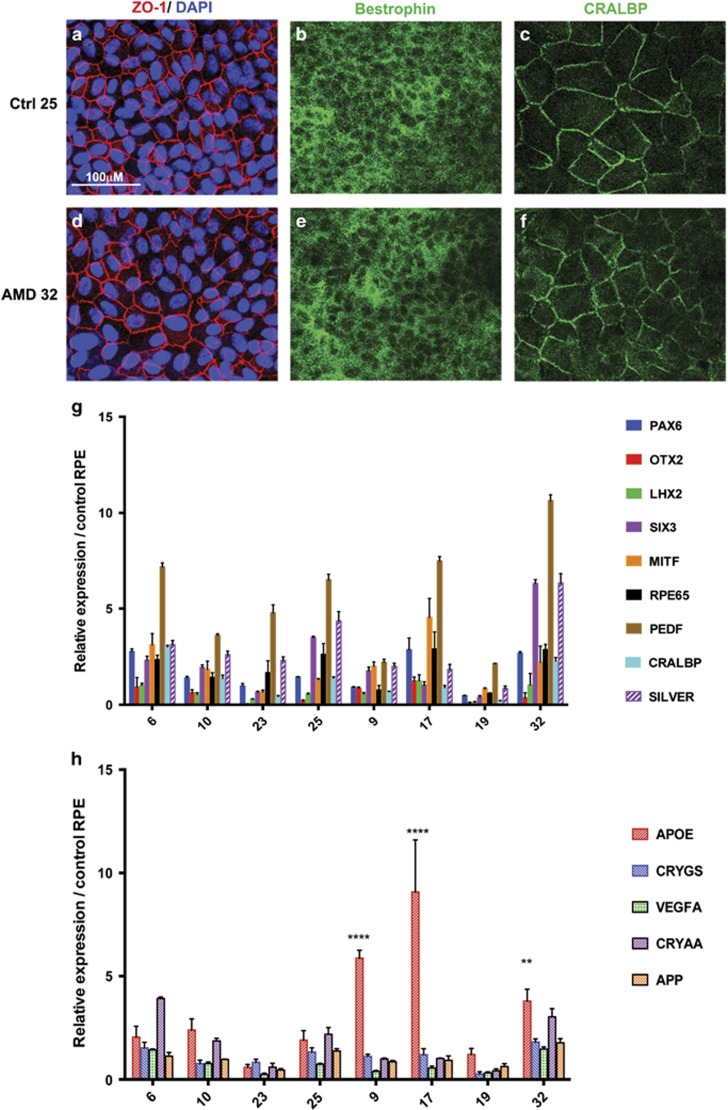
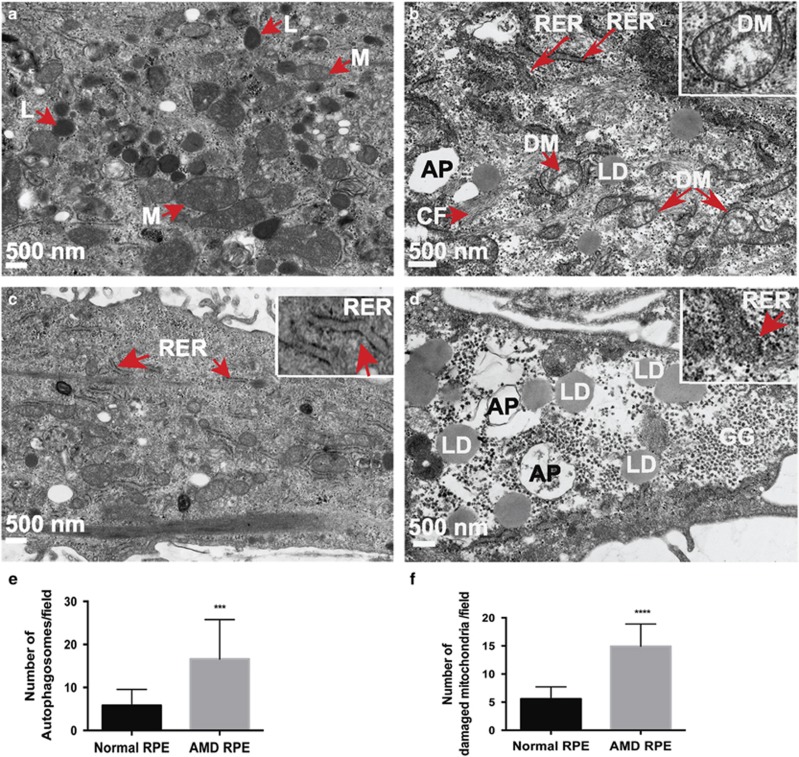
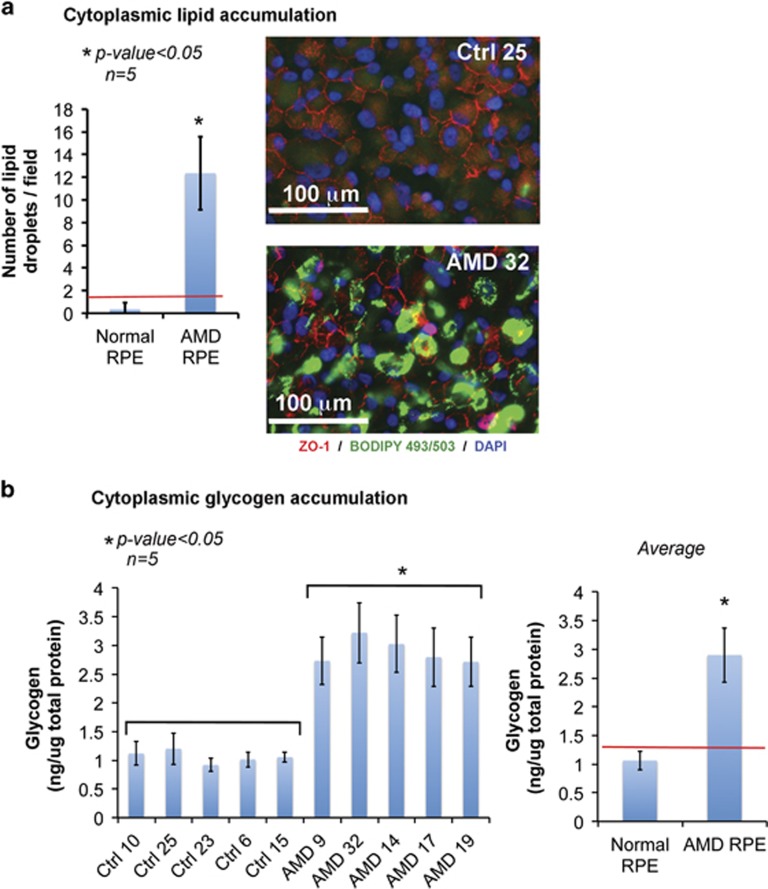
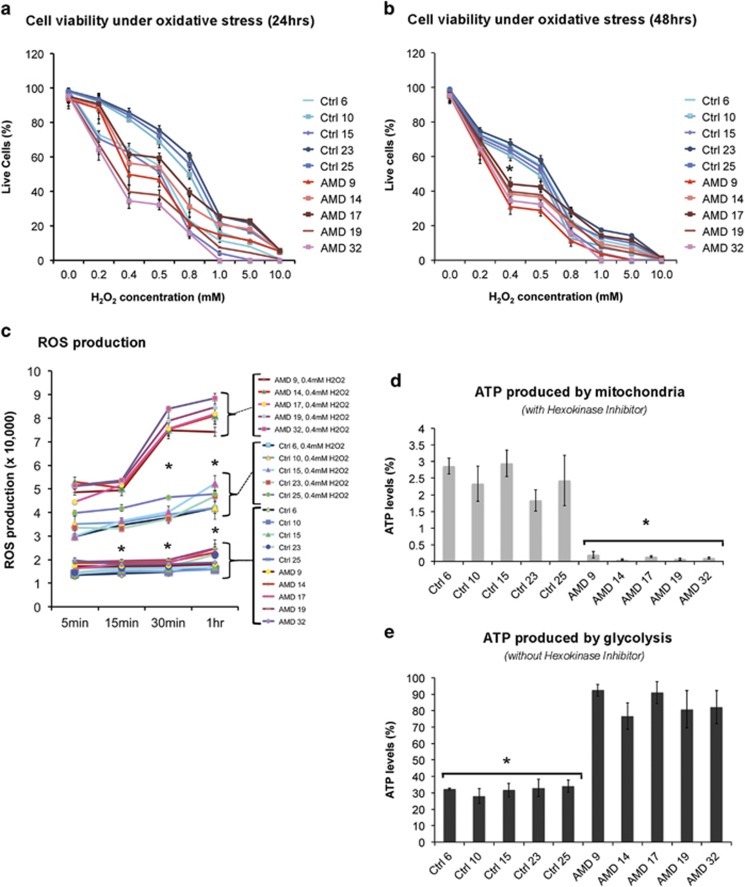
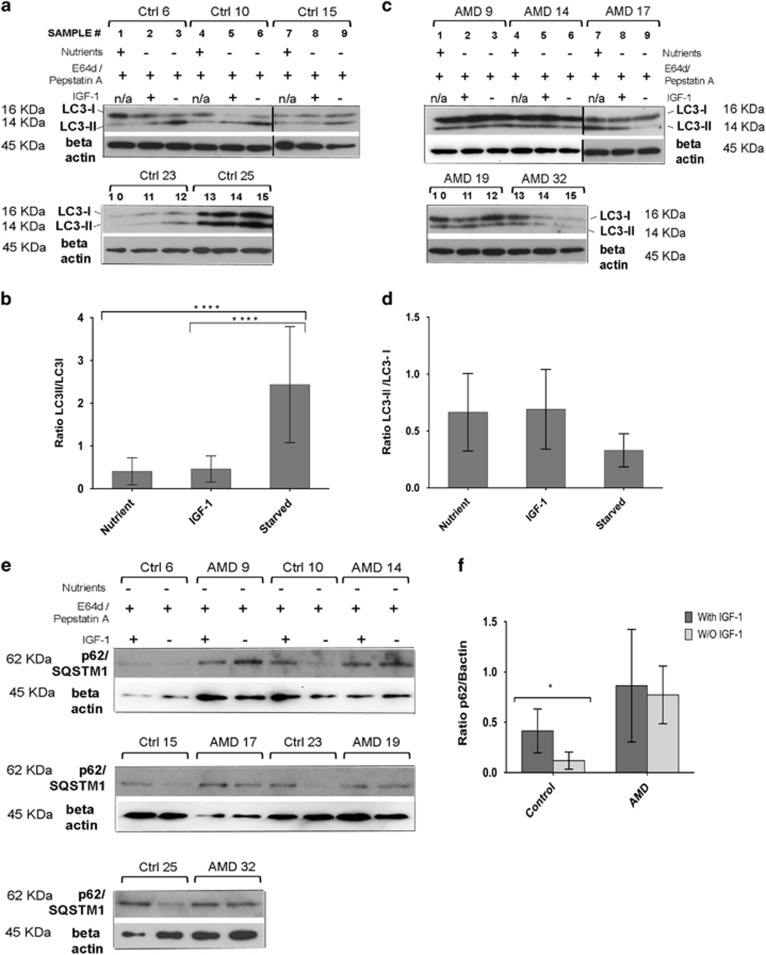
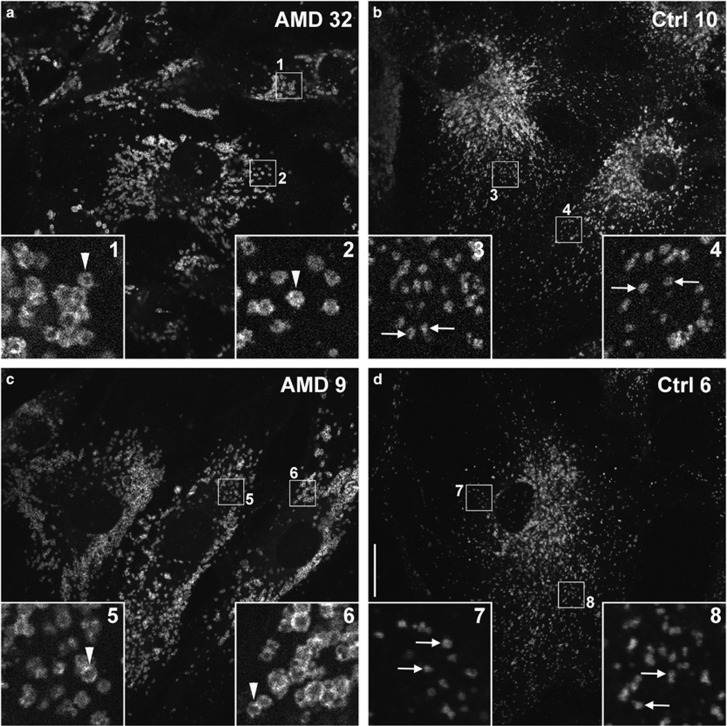
Age-related macular degeneration (AMD) is a devastating neurodegenerative disease and a major cause of blindness in the developed world. Owing to its complexity and the lack of an adequate human model that recapitulates key aspects of the disease, the molecular mechanisms of AMD pathogenesis remain poorly understood. Here we show that cultured human retinal pigment epithelium (RPE) from AMD donors (AMD RPE) are functionally impaired and exhibit distinct phenotypes compared with RPE cultured from normal donors (normal RPE). Accumulation of lipid droplets and glycogen granules, disintegration of mitochondria, and an increase in autophagosomes were observed in AMD RPE cultures. Compared with normal RPE, AMD RPE exhibit increased susceptibility to oxidative stress, produce higher levels of reactive oxygen species (ROS) under stress conditions, and showed reduced mitochondrial activity. Measurement of the ratio of LC3-II/ LC3-I, revealed impaired autophagy in AMD RPE as compared with normal RPE. Autophagic flux was also reduced in AMD RPE as compared with normal RPE, as shown by inability of AMD RPE to downregulate p62 levels during starvation. Impaired autophagic pathways were further shown by analyzing late autophagic vesicles; immunostaining with lysosome-associated membrane protein 1 (LAMP-1) antibody revealed enlarged and annular LAMP-1-positive organelles in AMD RPE as opposed to smaller discrete puncta observed in normal RPE. Our study provides insights into AMD cellular and molecular mechanisms, proposes dysfunctional autophagy as an underlying mechanism contributing to the pathophysiology of the disease, and opens up new avenues for development of novel treatment strategies.
Overview
The claims and statistics of this paper haven’t been checked yet.
Run the check — free, no account needed. It reads the open-access text and checks the sources it cites.
Integrity signals
Registry
Cites
Statistics
Figures
Verification
Claims the paper makes
The claims and statistics of this paper haven’t been checked yet.
Run the check — free, no account needed. It reads the open-access text and checks the sources it cites.
Claims other papers make about this one
Each is checked against this paper’s own text: does it say what the citing paper says it does?
In the citing paper
“RPE cultures established from AMD donors exhibited several features of disrupted autophagy, including decreased LC3B-II expression, swollen autolysosomes, and increased p62 (Golestaneh et al., 2017).”
From The cell biology of the retinal pigment epithelium (2020) · cites this paper as Golestaneh et al., 2017
In the citing paper
“AMD donor RPE cultures also accumulated lipid droplets, glycogen granules, and fragmented mitochondria, indicating a global breakdown of cellular clearance pathways.”
From The cell biology of the retinal pigment epithelium (2020) · cites this paper as Golestaneh et al., 2017
In the citing paper
“Lysosomes in cultured human RPE from AMD donors were found to be enlarged and annular; however, whether this abnormal lysosome morphology is associated with decreased hydrolytic function is not yet known (Golestaneh et al., 2017).”
From The cell biology of the retinal pigment epithelium (2020) · cites this paper as Golestaneh et al., 2017
In the citing paper
“Lipid oxidation is a critical factor in the development of AMD (Balaratnasingam et al., 2017; Golestaneh et al., 2017; Handa et al., 2017; Xu et al., 2017).”
From Microtubule-associated protein 1 light chain 3B, (LC3B) is necessary to maintain lipid-mediated homeostasis in the retinal pigment epithelium (2018) · cites this paper as Golestaneh et al., 2017
In the citing paper
“LC3II/LC3I ratios were lower in RPE from AMD patients with decreased autophagic flux and mitochondrial accumulation (suggestive of altered mitophagy) (Golestaneh et al., 2017)”
From Microtubule-associated protein 1 light chain 3B, (LC3B) is necessary to maintain lipid-mediated homeostasis in the retinal pigment epithelium (2018) · cites this paper as Golestaneh et al., 2017
In the citing paper
“leading these and other investigators doing in vitro work to conclude that dysregulated or dysfunctional autophagy contributes to AMD.”
From Microtubule-associated protein 1 light chain 3B, (LC3B) is necessary to maintain lipid-mediated homeostasis in the retinal pigment epithelium (2018) · cites this paper as Golestaneh et al., 2017
In the citing paper
“RPE cultures derived from human donor eyes (patients with AMD), exhibited increased intracellular lipid accumulation and oxidative stress.”
From Microtubule-associated protein 1 light chain 3B, (LC3B) is necessary to maintain lipid-mediated homeostasis in the retinal pigment epithelium (2018) · cites this paper as Golestaneh et al., 2017
Self-check
Percentages, sums and reported differences re-computed from the paper’s own numbers.
The self-check needs the paper’s full text.
Citations
Cites
Repertoires of Autophagy in the Pathogenesis of Ocular Diseases
Li, Y., Jiang, Q. L., Cao, G.-F., Yao, J., & Yan, B. (2015) · Cellular Physiology and Biochemistry · doi:10.1159/000373980 · Cited by 16,351
Cui, C., Cui, J., Jin, F., Cui, Y., Li, R., Jiang, X., Tian, Y., Wang, R. C., Jiang, P., & Gao, J. (2017) · Cellular Physiology and Biochemistry · doi:10.1159/000479571 · Cited by 5,214
Cillà, S. D., Farruggio, S., Vujosevic, S., Raina, G., Filippini, D. A., Gatti, V., Clemente, N., Mary, D., Vezzola, D., Casini, G., et al. (2017) · Cellular Physiology and Biochemistry · doi:10.1159/000479441 · Cited by 5,154
Pankiv, S., Clausen, T. H., Lamark, T., Brech, A., Bruun, J.-A., Outzen, H., Øvervatn, A., Bjørkøy, G., & Johansen, T. (2007) · Journal of Biological Chemistry · doi:10.1074/jbc.m702824200 · Cited by 4,578
Autophagy regulates lipid metabolism
Singh, R., Kaushik, S., Wang, Y., Xiang, Y., Novak, I., Komatsu, M., Tanaka, K., Cuervo, A. M., & Czaja, M. J. (2009) · Nature · doi:10.1038/nature07976 · Cited by 3,975
Mitochondrial Fission, Fusion, and Stress
Youle, R. J., & van der Bliek, A. M. (2012) · Science · doi:10.1126/science.1219855 · Cited by 3,674 · cited 1×
“In AMD, RPE dysfunctional autophagy/mitophagy could lead to mitochondrial disintegration by affecting the mitochondrial fission/fusion ratio that is crucial for maintaining functional mitochondria.(68) Dysfunctional mitochondria in AMD RPE can further translate into an increased oxidative stress response and a shift f…”
Bjørkøy, G., Lamark, T., Brech, A., Outzen, H., Perander, M., Øvervatn, A., Stenmark, H., & Johansen, T. (2005) · The Journal of Cell Biology · doi:10.1083/jcb.200507002 · Cited by 3,276
de Duve, C., & Wattiaux, R. (1966) · Annual Review of Physiology · doi:10.1146/annurev.ph.28.030166.002251 · Cited by 3,033 · cited 1×
“non-essential or damaged cellular constituents to supply the cell with energy and to maintain homeostasis.(18,19) Recently,”
The Retinal Pigment Epithelium in Visual Function
Strauss, O. (2005) · Physiological Reviews · doi:10.1152/physrev.00021.2004 · Cited by 2,828
Physiological Roles of Mitochondrial Reactive Oxygen Species
Sena, L. A., & Chandel, N. S. (2012) · Molecular Cell · doi:10.1016/j.molcel.2012.09.025 · Cited by 2,632
Cited by
Sorted by citations
Items 201–300 of 357
Karunadharma, P. P., Kapphahn, R. J., Stahl, M. R., Olsen, T. W., & Ferrington, D. A. (2022) · Oxidative Medicine and Cellular Longevity · doi:10.1155/2022/6009787 · Cited by 14
Strzałka‐Mrozik, B., Madej, M., Kurowska, N., Kruszniewska‐Rajs, C., Kimsa‐Dudek, M., Adamska, J., & Gola, J. M. (2023) · Current Issues in Molecular Biology · doi:10.3390/cimb45020097 · Cited by 13
Schreiter, S., Vafia, K., Barsacchi, R., Tsang, S. H., Bickle, M., Ader, M., Karl, M., Tanaka, E. M., & Almedawar, S. (2020) · Stem Cell Reports · doi:10.1016/j.stemcr.2020.10.013 · Cited by 11
Shang, P., Ambrosino, H., Hoang, J., Geng, Z., Zhu, X., Shen, S., Eminhizer, M., Hong, E., Zhang, M., Qu, J., et al. (2024) · Free Radical Biology and Medicine · doi:10.1016/j.freeradbiomed.2024.10.307 · Cited by 12
Polygenic Risk Scores and Genetically Complex Eye Disease
Le, N., He, W., & MacGregor, S. (2024) · Annual Review of Vision Science · doi:10.1146/annurev-vision-102122-103958 · Cited by 11
Endoplasmic reticulum stress and the protein degradation system in ophthalmic diseases
Song, J., Wang, X.-G., Zhang, Z.-Y., Che, L., Fan, B., & Li, G. (2020) · PeerJ · doi:10.7717/peerj.8638 · Cited by 14
Keeling, E., Culling, A., Johnston, D. A., Chatelet, D. S., Page, A. M., Tumbarello, D. A., Lotery, A. J., & Ratnayaka, J. A. (2020) · International Journal of Molecular Sciences · doi:10.3390/ijms21186647 · Cited by 12
C20D3-Vitamin A Prevents Retinal Pigment Epithelium Atrophic Changes in a Mouse Model
Zhang, D., Robinson, K., & Washington, I. (2021) · Translational Vision Science & Technology · doi:10.1167/tvst.10.14.8 · Cited by 12
Kim, J., Jeon, Y., Son, J., Pagire, H. S., Pagire, S. H., Ahn, J. H., Uemura, A., Lee, I.-K., Park, S., & Park, D. H. (2024) · Cell Death and Disease · doi:10.1038/s41419-024-06968-0 · Cited by 11
Zhang, X., Han, C., Yao, Y., & Wei, T. (2024) · Experimental Eye Research · doi:10.1016/j.exer.2024.110110 · Cited by 12
Metallothioneins, a Part of the Retinal Endogenous Protective System in Various Ocular Diseases
Jamrozik, D., Dutczak, R., Machowicz, J., Wojtyniak, A., Smędowski, A., & Pietrucha‐Dutczak, M. (2023) · Antioxidants · doi:10.3390/antiox12061251 · Cited by 10
The Relationship between Complements and Age-Related Macular Degeneration and Its Pathogenesis
Chu, L., Bi, C., Wang, C., & Zhou, H. (2024) · Journal of Ophthalmology · doi:10.1155/2024/6416773 · Cited by 11
The Ercc1−/Δ mouse model of XFE progeroid syndrome undergoes accelerated retinal degeneration
Narasimhan, A., Min, S.-H., Johnson, L. L., Roehrich, H., Cho, W., Her, T. K., Windschitl, C., O'Kelly, R. D., Angelini, L. A., Yousefzadeh, M. J., et al. (2024) · Aging Cell · doi:10.1111/acel.14419 · Cited by 10
Potential of autophagy in subretinal fibrosis in neovascular age-related macular degeneration
Błasiak, J., Pawłowska, E., Heloterä, H., Йонов, М., Derwich, M., & Kaarniranta, K. (2025) · Cellular & Molecular Biology Letters · doi:10.1186/s11658-025-00732-8 · Cited by 10
Chen, X., Zhu, Y., Shi, X., Zuo, J. L., Hu, T., Wu, H., Xia, Y., Shi, W., & Wei, W. (2022) · Oxidative Medicine and Cellular Longevity · doi:10.1155/2022/5851315 · Cited by 10
Voisin, A., Monville, C., Plancheron, A., Balbous, A., Gaillard, A., & Leveziel, N. (2018) · Experimental Eye Research · doi:10.1016/j.exer.2018.07.017 · Cited by 10
Autophagy: ‘Self-Eating’ Your Way to Longevity
Pattison, C. J., & Korolchuk, V. I. (2018) · Sub-cellular biochemistry/Subcellular biochemistry · doi:10.1007/978-981-13-2835-0_2 · Cited by 10
Intractable Ocular Diseases and Treatment Progress
Zhang, X., Li, S., Tang, Y., Guo, Y., & Gao, S. (2020) · AAPS PharmSciTech · doi:10.1208/s12249-020-01774-1 · Cited by 10
Koller, A., Preishuber‐Pflügl, J., Runge, C., Ladek, A., Brunner, S. M., Aigner, L., Reitsamer, H. A., & Trost, A. (2021) · Aging · doi:10.18632/aging.203787 · Cited by 10
Kaczynski, T. J., Au, E. D., & Farkas, M. H. (2022) · BMC Genomics · doi:10.1186/s12864-022-08777-1 · Cited by 10
O’Brien, D. J., Hankins, A., Golestaneh, N., & Paranjape, M. (2019) · Biomedical Microdevices · doi:10.1007/s10544-019-0402-0 · Cited by 10
Self-citationVoisin, A., Monville, C., Plancheron, A., Béré, E., Gaillard, A., & Leveziel, N. (2019) · Oxidative Medicine and Cellular Longevity · doi:10.1155/2019/5637075 · Cited by 10
Features that distinguish age-related macular degeneration from aging
Skowronska‐Krawczyk, D., Finnemann, S. C., Grant, M. B., Held, K. S., Hu, Z., Lu, Y. R., Malek, G., Sennlaub, F., Sparrow, J. R., & D'Amore, P. A. (2025) · Experimental Eye Research · doi:10.1016/j.exer.2025.110303 · Cited by 9
Li, J., Liu, J., Das, V., Le, H., Aguilera, N., Bower, A. J., Giannini, J., Lu, R., Abouassali, S., Chew, E. Y., et al. (2025) · Communications Medicine · doi:10.1038/s43856-025-00803-z · Cited by 9
Pinelli, R., Ferrucci, M., Berti, C., Biagioni, F., Scaffidi, E., Bumah, V. V., Busceti, C. L., Lenzi, P., Lazzeri, G., & Fornai, F. (2023) · International Journal of Molecular Sciences · doi:10.3390/ijms24108979 · Cited by 9
Lyu, Q., Ludwig, I. S., van Kooten, P. J. S., Sijts, A. J. A. M., Rutten, V. P. M. G., van Eden, W., & Broere, F. (2020) · Cell Stress and Chaperones · doi:10.1007/s12192-019-01066-z · Cited by 9
Chen, Q., Lin, H., Deng, X., Li, S., & Zhang, J. (2020) · Clinical and Experimental Ophthalmology · doi:10.1111/ceo.13751 · Cited by 9
New Technologies to Study Functional Genomics of Age-Related Macular Degeneration
Nguyen, T., Urrutia-Cabrera, D., Liou, R. H.-C., Luu, C. D., Guymer, R. H., & Wong, R. C. B. (2021) · Frontiers in Cell and Developmental Biology · doi:10.3389/fcell.2020.604220 · Cited by 9
Lee, S. J., Kim, S., Jo, D. H., Park, K., & Kim, J. H. (2021) · The FASEB Journal · doi:10.1096/fj.202001939rr · Cited by 9
Suárez‐Barrio, C., del Olmo‐Aguado, S., García-Pérez, E., Fernández-Vega-Cueto, L., Cueto, A. F., Baamonde-Arbaiza, B., Fernández-Vega-Cueto, L., & Merayo-Llovés, J. (2021) · Biomolecules · doi:10.3390/biom11070954 · Cited by 9
Chen, X., Liu, X., Zhang, C.-F., & Yang, L. (2021) · Chinese Medical Journal · doi:10.1097/cm9.0000000000001773 · Cited by 9
Emerging Lysosomal Functions for Photoreceptor Cell Homeostasis and Survival
Santo, M., & Conte, I. (2021) · Cells · doi:10.3390/cells11010060 · Cited by 9
Hyttinen, J. M. T., Niittykoski, M., & Kaarniranta, K. (2025) · Ageing Research Reviews · doi:10.1016/j.arr.2025.102796 · Cited by 9
Pinelli, R., Lazzeri, G., Berti, C., Biagioni, F., Scaffidi, E., Ferrucci, M., Bumah, V. V., & Fornai, F. (2025) · International Journal of Molecular Sciences · doi:10.3390/ijms26125773 · Cited by 9
Lugassy, Y., Berent, E., Tarony, L., Jeries, S., Ziv, T., Savion, N., & Eldar-Finkelman, H. (2025) · Free Radical Biology and Medicine · doi:10.1016/j.freeradbiomed.2025.08.007 · Cited by 8
Jiménez‐Loygorri, J. I., Shang, P., Bayramoglu, I., Gómez‐Sintes, R., Martín‐Segura, A., Ambrosino, H., Hoang, J., Díaz, A., Geng, Z., Gavathiotis, E., et al. (2025) · EMBO Molecular Medicine · doi:10.1038/s44321-025-00329-w · Cited by 10
Lee, J., Han, M., Wang, K., Butler, L. R., & Sinclair, D. A. (2026) · Progress in Retinal and Eye Research · doi:10.1016/j.preteyeres.2026.101442 · Cited by 7
Asatryan, A., Calandria, J. M., Kautzmann, M.-A. I., Jun, B., Gordon, W. C., Do, K. V., Bhattacharjee, S., Pham, T. L., Bermúdez, V., Mateos, M. V., et al. (2022) · Frontiers in Neuroscience · doi:10.3389/fnins.2022.926629 · Cited by 7
Role of autophagy in the eye: from physiology to disease
Morishita, H. (2022) · Current Opinion in Physiology · doi:10.1016/j.cophys.2022.100592 · Cited by 8
RPE-Directed Gene Therapy Improves Mitochondrial Function in Murine Dry AMD Models
Millington‐Ward, S., Chadderton, N., Finnegan, L. K., Post, I. J. M., Carrigan, M., Nixon, R., Humphries, M. M., Humphries, P., Kenna, P. F., Palfi, A., et al. (2023) · International Journal of Molecular Sciences · doi:10.3390/ijms24043847 · Cited by 8
Shao, Z., Wang, H., Zhou, X., Guo, B., Gao, X., Xiao, Z., Liu, M., Sha, J., Jiang, C., Luo, Y., et al. (2017) · Cell Proliferation · doi:10.1111/cpr.12386 · Cited by 8
Neutrophil-Lymphocyte Ratios in Dry Age-Related Macular Degeneration
Sannan, N., Ramadan, M. M., Elsayid, M., Alghamdi, H. A., ALGHAMDI, L., & AlQahtani, M. M. (2022) · Ocular Immunology and Inflammation · doi:10.1080/09273948.2022.2092752 · Cited by 8
Tolentino, M. J., Tolentino, A. J., Tolentino, E. M., Krishnan, A., & Genead, M. A. (2023) · Pharmaceuticals · doi:10.3390/ph16121735 · Cited by 9
Bao, X., Zhang, Z., Guo, Y., Buser, C., Kochounian, H., Wu, N. L., Li, X., He, S., Sun, B., Ross‐Cisneros, F. N., et al. (2021) · American Journal Of Pathology · doi:10.1016/j.ajpath.2021.05.003 · Cited by 8
Retinitis pigmentosa and stem cell therapy
Qi, X.-Y., Cao, D., Chen, X., & Zhang, P. (2024) · International Journal of Ophthalmology · doi:10.18240/ijo.2024.07.22 · Cited by 7
Exploiting autophagy and related pathways: pioneering new horizons in cataract therapy
Hashemi, M., Asheghabadi, P. S., Moassesfar, M., Mohammadi, R. M., Rafedoust, N., Razeh, M., Esfahaniolasl, Y., Mirzayi, M., Keikhavani, S., Tajbakhsh, K., et al. (2025) · APOPTOSIS · doi:10.1007/s10495-025-02134-9 · Cited by 7
Davidescu, M., Mezzasoma, L., Fettucciari, K., Pascucci, L., Pariano, M., Michele, A. D., Bereshchenko, O., Cagini, C., Cellini, B., Corazzi, L., et al. (2023) · Biochimica et Biophysica Acta (BBA) - Molecular Cell Research · doi:10.1016/j.bbamcr.2023.119554 · Cited by 7
Iliescu, D. A., Ghiță, A. C., Ilie, L. A., Voiculescu, S. E., Geamănu, A., & Ghiță, M. (2024) · Diagnostics · doi:10.3390/diagnostics14070764 · Cited by 7
Identification of Key Genes and Pathways Associated with Age-Related Macular Degeneration
Zhang, J., & Zhou, Y. (2020) · Journal of Ophthalmology · doi:10.1155/2020/2714746 · Cited by 7
Emerging biological therapies for the treatment of age-related macular degeneration
Asahi, M., Avaylon, J., Wallsh, J. O., & Gallemore, R. P. (2021) · Expert Opinion on Emerging Drugs · doi:10.1080/14728214.2021.1931120 · Cited by 7
Chen, Y.-A., Lu, W.-N., Li, P., Nie, T., Li, Y., Zeng, R., Lin, S., Gao, M., Hejtmancik, J. F., Hou, L., et al. (2025) · Free Radical Biology and Medicine · doi:10.1016/j.freeradbiomed.2025.07.025 · Cited by 6
Dohl, J., Burns, G., & Singh, M. K. (2025) · APOPTOSIS · doi:10.1007/s10495-025-02165-2 · Cited by 7
Role of TFEB in Diseases Associated with Lysosomal Dysfunction
Pan, H.-Y., & Valapala, M. (2023) · Advances in experimental medicine and biology · doi:10.1007/978-3-031-27681-1_46 · Cited by 6
The Role of Autophagy in Chemical Proteasome Inhibition Model of Retinal Degeneration
Gunawan, M., Low, C., Neo, K., Yeo, S. W., Ho, C. E. H., Barathi, V. A., Chan, A. S.-Y., Sharif, N. A., & Kageyama, M. (2021) · International Journal of Molecular Sciences · doi:10.3390/ijms22147271 · Cited by 6
Outer retinal tubulation associated with photoreceptor degeneration
Lin, V., Lee, W. Y., Kang, E. Y., Liu, P., & Wang, N.-K. (2026) · Progress in Retinal and Eye Research · doi:10.1016/j.preteyeres.2026.101435 · Cited by 4
Delrue, C., Speeckaert, R., & Speeckaert, M. M. (2026) · Biomolecules · doi:10.3390/biom16020234 · Cited by 5
A Decrease in Autophagy Increases the Level of Collagen Type I Expression in Scleral Fibroblasts
Zhang, Y., Zhu, Y., Li, F., Zhou, Q., & Zhou, J. (2024) · Current Eye Research · doi:10.1080/02713683.2024.2393370 · Cited by 5
Ablation of Htra1 leads to sub-RPE deposits and photoreceptor abnormalities
Biswas, P., Woodard, D. R., Hollingsworth, T., Khan, N. W., Lazaro, D., Berry, A. M., Dagar, M., Pan, Y., Garland, D. L., Shaw, P. X., et al. (2025) · JCI Insight · doi:10.1172/jci.insight.178827 · Cited by 5
Phase separation in mitochondrial fate and mitochondrial diseases
Chen, Q., An, S., Wang, C., Zhou, Y., Liu, X., & Ren, W. (2025) · Proceedings of the National Academy of Sciences · doi:10.1073/pnas.2422255122 · Cited by 6
Recent Advancements in the Treatment of Age‐Related Macular Degeneration
Liu, S., Lv, D., Sun, J., Jia, H., Zheng, F., Pereira, F., Narendran, S., Dong, Z., Liu, H., Gao, S., et al. (2025) · Med Research · doi:10.1002/mdr2.70009 · Cited by 5
Cheng, Y.-S., Linetsky, M. D., Li, H., Ayyash, N., Gardella, A., & Salomon, R. G. (2020) · Free Radical Biology and Medicine · doi:10.1016/j.freeradbiomed.2020.09.009 · Cited by 5
Fisher, C. R., Ebeling, M. C., & Ferrington, D. A. (2022) · Experimental Eye Research · doi:10.1016/j.exer.2022.108981 · Cited by 5
Cilia-associated wound repair mediated by IFT88 in retinal pigment epithelium
Ning, K., Bhuckory, M. B., Lo, C., Sendayen, B. E., Kowal, T. J., Chen, M., Bansal, R., Chang, K., Vollrath, D., Berbari, N. F., et al. (2023) · Scientific Reports · doi:10.1038/s41598-023-35099-3 · Cited by 6
Kaşıkçı, M., & Şen, S. (2024) · International Ophthalmology · doi:10.1007/s10792-024-02957-6 · Cited by 5
Pharmaceutical therapies targeting autophagy for the treatment of age-related macular degeneration
Vessey, K. A., Jobling, A. I., Greferath, U., & Fletcher, E. L. (2024) · Current Opinion in Pharmacology · doi:10.1016/j.coph.2024.102463 · Cited by 5
Development-related mitochondrial properties of retinal pigment epithelium cells derived from hEROs
Xu, H.-J., Zou, T., & Yin, Z. (2021) · International Journal of Ophthalmology · doi:10.18240/ijo.2021.08.02 · Cited by 4
Postnikova, O. A., Poliakov, E., Golestaneh, N., Rogozin, I. B., & Redmond, T. M. (2019) · Frontiers in Genetics · doi:10.3389/fgene.2019.00634 · Cited by 6
Self-citationGold Particle Analyser: Detection and quantitative assessment of electron microscopy gold probes
Burgoyne, T., & Futter, C. E. (2023) · PLoS ONE · doi:10.1371/journal.pone.0288811 · Cited by 4
Transcriptomic Changes Predict Metabolic Alterations in LC3 Associated Phagocytosis in Aged Mice
Dhingra, A., Tobias, J. W., Philp, N. J., & Boesze‐Battaglia, K. (2023) · International Journal of Molecular Sciences · doi:10.3390/ijms24076716 · Cited by 4
Role of AMPK-regulated autophagy in retinal pigment epithelial cell homeostasis: A review
Zhou, L., Mo, Y., Zhang, H., Zhang, M., Xu, J., & Liang, S. (2024) · Medicine · doi:10.1097/md.0000000000038908 · Cited by 4
Choroidal macrophages in homeostasis, aging and age-related macular degeneration
Khan, A. H., & Mulfaul, K. (2024) · Experimental Eye Research · doi:10.1016/j.exer.2024.110159 · Cited by 4
Yéfimova, M. (2022) · Neural Regeneration Research · doi:10.4103/1673-5374.355753 · Cited by 4
Naghdi, A., Oska, N., Yumnamcha, T., Eltanani, S., Shawky, M., Me, R., & Ibrahim, A. S. (2024) · Scientific Reports · doi:10.1038/s41598-024-68343-5 · Cited by 3
QMR® and Patient Blood-Derived Secretome Modulate RPE microRNA Networks Under Oxidative Stress
Alibrandi, S., Mordà, D., Scimone, C., D’Ascola, A., Aliquò, F., Pozzato, A., Scalinci, S. Z., D’Angelo, R., Sidoti, A., & Donato, L. (2025) · International Journal of Molecular Sciences · doi:10.3390/ijms26178614 · Cited by 3
Lazzeri, G., Ferrucci, M., Lenzi, P., Giambelluca, M. A., Biagioni, F., Busceti, C. L., Frati, A., & Fornai, F. (2025) · International Journal of Molecular Sciences · doi:10.3390/ijms26199442 · Cited by 3
Romdhoniyyah, D. F., Alshukri, A., Parry, D., Harding, S. P., & Beare, N. A. V. (2026) · BMJ Open Ophthalmology · doi:10.1136/bmjophth-2025-002339 · Cited by 3
Carlsson, E., Sharif, U., Supharattanasitthi, W., & Paraoan, L. (2023) · Cells · doi:10.3390/cells12050713 · Cited by 3
Budnik, A., Palewski, M., Michnowska‐Kobylińska, M., Lisowski, Ł., Łapińska, M., Stachurska, Z., Szpakowicz, A., Konstantynowicz, J., Kamiński, K. A., & Konopińska, J. (2023) · PLoS ONE · doi:10.1371/journal.pone.0293143 · Cited by 3
Zubieta, D., Warden, C., Bhattacharya, S., & Brantley, M. A. (2025) · Current Issues in Molecular Biology · doi:10.3390/cimb47040224 · Cited by 3
Zhou, X., & Zhao, X. (2021) · Quality Assurance and Safety of Crops & Foods · doi:10.15586/qas.v13i4.969 · Cited by 3
Emri, E., Cappa, O., Kelly, C., Körtvely, E., SanGiovanni, J. P., McKay, B. S., Bergen, A. A. B., Simpson, D. A. C., & Lengyel, I. (2023) · Cells · doi:10.3390/cells12050773 · Cited by 3
Oxidized-LDL Induces Metabolic Dysfunction in Retinal Pigment Epithelial Cells
Tomomatsu, M., Imamura, N., Izumi, H., Watanabe, M., Ikeda, M., Ide, T., Uchinomiya, S., Ojida, A., Jutanom, M., Morimoto, K., et al. (2024) · Biological and Pharmaceutical Bulletin · doi:10.1248/bpb.b23-00849 · Cited by 3
Velmurugan, S., Pauline, R., Chandrashekar, G., Kulanthaivel, L., & Subbaraj, G. K. (2024) · Nigerian Postgraduate Medical Journal · doi:10.4103/npmj.npmj_9_24 · Cited by 3
Accumulation of autophagosomes in aging human photoreceptor cell synapses
Nag, T. C. (2025) · Experimental Eye Research · doi:10.1016/j.exer.2025.110240 · Cited by 3
Kim, K., Yoon, S.-Y., Kim, J., Woo, K.-H., Cho, S.-Y., & Jo, H.-R. (2021) · Annals of Occupational and Environmental Medicine · doi:10.35371/aoem.2021.33.e7 · Cited by 3
Yang, C., Zhang, R., Wang, S., Tian, Y., Yang, Y., Liu, J., & Ma, Y. (2022) · Research Square · doi:10.21203/rs.3.rs-1209539/v1 · Cited by 3
Nonredundant Role of Leishmanolysin-Like (Lmln) Zinc-Metallopeptidase in Retinal Homeostasis
Ufret-Vincenty, R. L., Kirman, D. C., Ulker-Yilmazer, G., Aredo, B., Shrestha, S., Turpin, E. R., Yüksel, S., Zegeye, Y., Ludwig, S. M., Moresco, E. M. Y., et al. (2024) · American Journal of Ophthalmology · doi:10.1016/j.ajo.2024.08.016 · Cited by 2
Research progress on glycolytic reprogramming in ophthalmic diseases
Gong, X., Feng, J., Han, Y., Tang, G., Yin, Y., Li, J., Liu, Y., Zhang, J., Song, J., & Bi, H. (2026) · PeerJ · doi:10.7717/peerj.20478 · Cited by 2
The oxidative stress regulatory mechanism of autophagy and apoptosis in lens epithelial cells
Lin, M., Chen, Y., & Kang, G. (2026) · Tissue and Cell · doi:10.1016/j.tice.2025.103308 · Cited by 2
Wu, X., Jin, H., Zhang, B., Yue, M., He, J., Shan, J., Hong, C., & Shen, T. (2026) · European journal of medical research · doi:10.1186/s40001-026-04091-8 · Cited by 3
Çalışkan, B., & Demir, Y. (2026) · Current Eye Research · doi:10.1080/02713683.2026.2664597 · Cited by 2
The Molecular Basis of Ocular Aging: Mechanisms, Pathologies, and Emerging Therapeutics
Zong, Y., Fan, Q., Qiu, S., Zhang, H., & Cen, Z. (2026) · Investigative Ophthalmology & Visual Science · doi:10.1167/iovs.67.8.13 · Cited by 2
Effects of fluorescent protein tdTomato on mouse retina
Zhang, C.-J., Mou, H., Yuan, J., Wang, Y.-H., Sun, S., Wang, W., Xu, Z.-H., Yu, S., Jin, K., & Jin, Z. (2024) · Experimental Eye Research · doi:10.1016/j.exer.2024.109910 · Cited by 2
Choi, J. A., Seo, B.-R., Koh, J., & Yoon, Y. H. (2024) · Heliyon · doi:10.1016/j.heliyon.2024.e39100 · Cited by 2
Kozhevnikova, O. S., Telegina, D. V., Timofeeva, Y. V., Devyatkin, V. A., & Kolosova, N. G. (2024) · Advances in Gerontology · doi:10.1134/s2079057024600642 · Cited by 2
Zhang, Y., Gong, Z., Shi, Y., Le, V. H., Pan, H., Liu, J., & Wang, R. K. (2025) · Biomedical Optics Express · doi:10.1364/boe.563121 · Cited by 2
Loss of CIB2 causes non-canonical autophagy deficits and visual impairmentPreprint
Sethna, S., Scott, P. A., Giese, A. P. J., Duncan, T. E., Redmond, T. M., Riazuddin, S., & Ahmed, Z. M. (2020) · bioRxiv (Cold Spring Harbor Laboratory) · doi:10.1101/2020.09.18.302174 · Cited by 2
FTO alleviates Aβ1-40 induced retinal pigment epithelium degeneration via PKA/CREB signaling pathwayPreprint
Hu, Y., Chen, J., Sun, J., Wang, Y., Huang, P., Feng, J., Liu, T., & Sun, X. (2020) · doi:10.21203/rs.3.rs-30549/v1 · Cited by 2
Korhonen, E. (2024) · Acta Ophthalmologica · doi:10.1111/aos.16646 · Cited by 2
Mishra, M., Cashman, S. M., & Kumar‐Singh, R. (2025) · Experimental Eye Research · doi:10.1016/j.exer.2025.110258 · Cited by 1
Metadata
- Authors
- Golestaneh, N., Chu, Y., Xiao, Y.-Y., Stoleru, G. L., & Theos, A. C.
- Affiliations
- Georgetown University Medical Center (US)
- Georgetown University (US)
- Corresponding author
- Golestaneh, Nady
- Venue
- Cell Death & Disease
- Published
- 2017-01-05
- Volume
- 8
- Issue
- 1
- Pages
- e2537-e2537
- ISSN
- 2041-4889 (ISSN-L)
- PMC
- PMC5386365
- OpenAlex
- W2569601267
- Cited by
- 357
- References
- 83
- Citations by year
- 2026: 35 · 2025: 31 · 2024: 41 · 2023: 31 · 2022: 51 · 2021: 52 · 2020: 61 · 2019: 25 · 2018: 23 · 2017: 7
- FWCI
- 24.85
- Type
- journal article
- Language
- en
- Open access
- gold
- doi.org
- Locations
- Cell Death and Disease (publishedVersion, cc-by)
- Europe PMC (PubMed Central) (publishedVersion, cc-by)
- PubMed Central (publishedVersion, cc-by)
- PubMed (publishedVersion)
- Funders
- BrightFocus Foundation
- Children's National Hospital
- National Institutes of Health
- National Eye Institute
- Topics
- Life Sciences › Biochemistry, Genetics and Molecular Biology › Cell Biology › Autophagy in Disease and Therapy
- Health Sciences › Medicine › Ophthalmology › Retinal Diseases and Treatments
- Health Sciences › Medicine › Ophthalmology › Retinal Development and Disorders
- Keywords
- age-related macular degeneration, retinal pigment epithelium, autophagy dysfunction, autophagic flux, lipid droplets, glycogen granules, mitochondrial dysfunction, oxidative stress, reactive oxygen species, LC3-II/LC3-I ratio, p62, LAMP1, lysosomes, AMD pathogenesis
- MeSH terms
- Autophagosomes, Cells, Cultured, Glycogen, Humans, Macular Degeneration, Mitochondria, Reactive Oxygen Species, Oxidative Stress, Lysosomal Membrane Proteins, Lysosomal-Associated Membrane Protein 1, Retinal Pigment Epithelium, Lipid Droplets
About these checks
Registry, retraction, Cites and statistics results are computed, not judged, with one exception: a printed reference that no index lists is read once by a model before it counts as a citation error. Claims are extracted by a model and kept only when their quote appears verbatim in the text; each cited source is then checked, with a model’s help, for whether it says what the claim relies on. Those verdicts can be wrong — read the claim’s quote and the cited source before relying on one.
Statistics and arithmetic are recomputed, not judged.
Confidence bands are shown only for fields calibrated on our annotated test set. None is calibrated yet, so no band is shown.
What counts as a claim ›How we measure confidence ›How we check this ›
Are you an author, or do you see a problem with this page? Request a review
