

The DOI matches its Crossref record; 11 of the 11 references it cites were found in a registry or an index.
Analysis of cancer genomes reveals basic features of human aging and its role in cancer development
Abstract
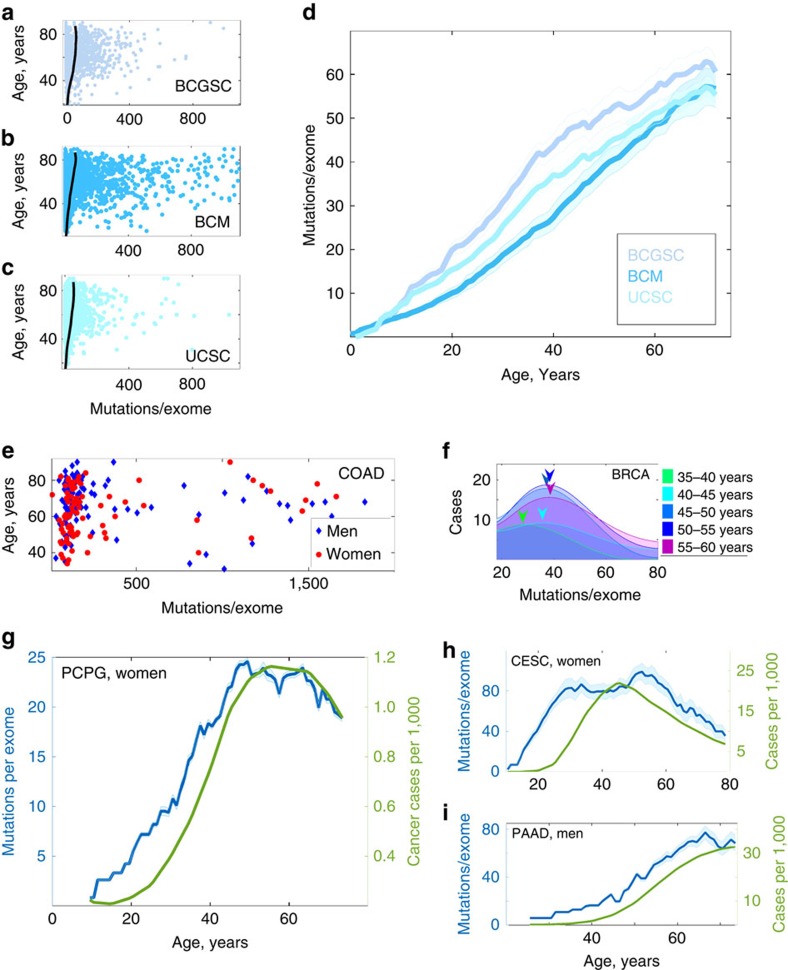
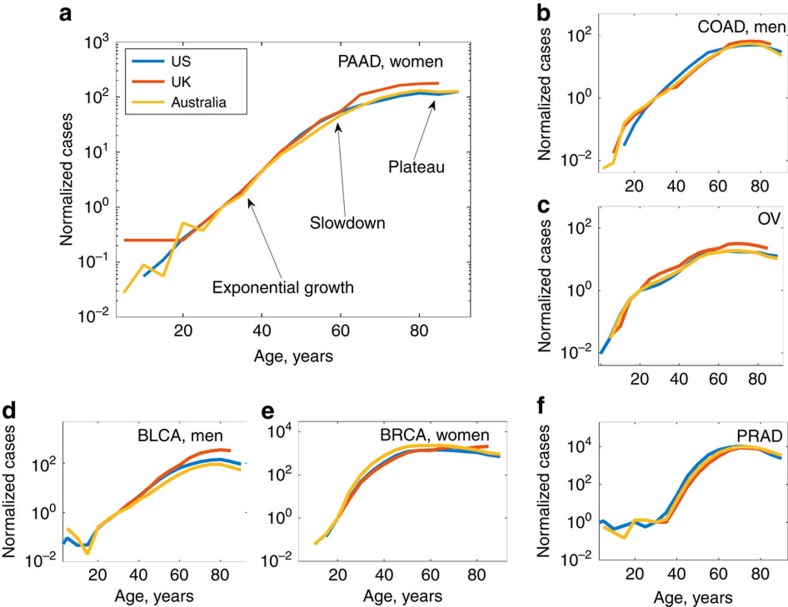
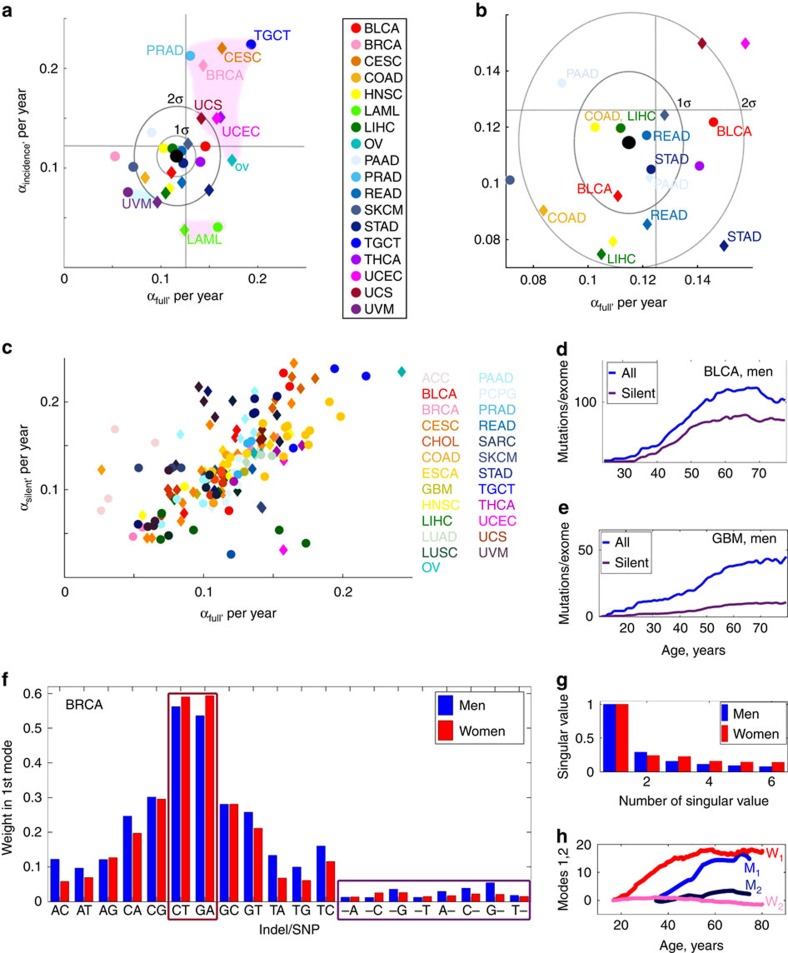
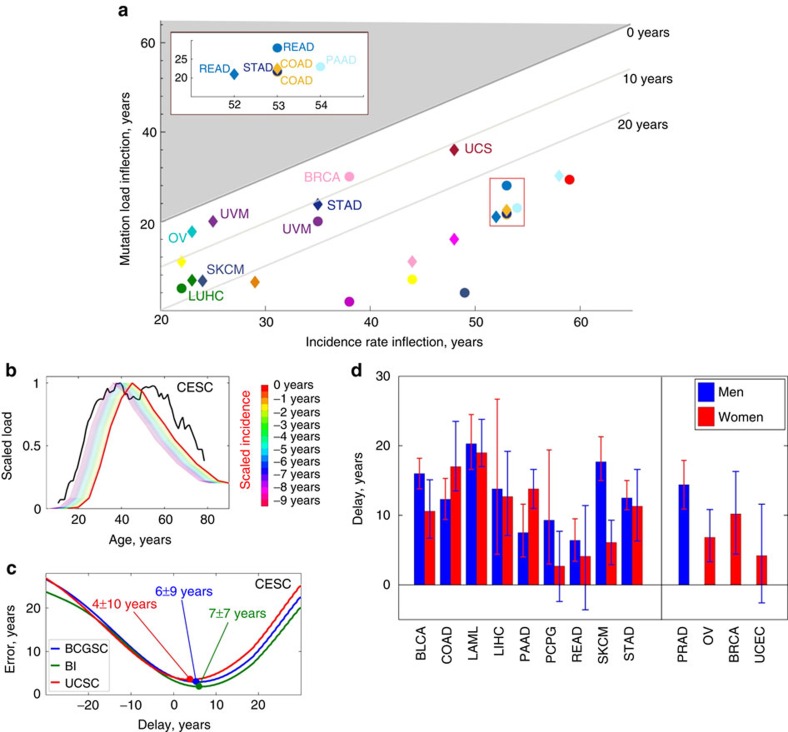
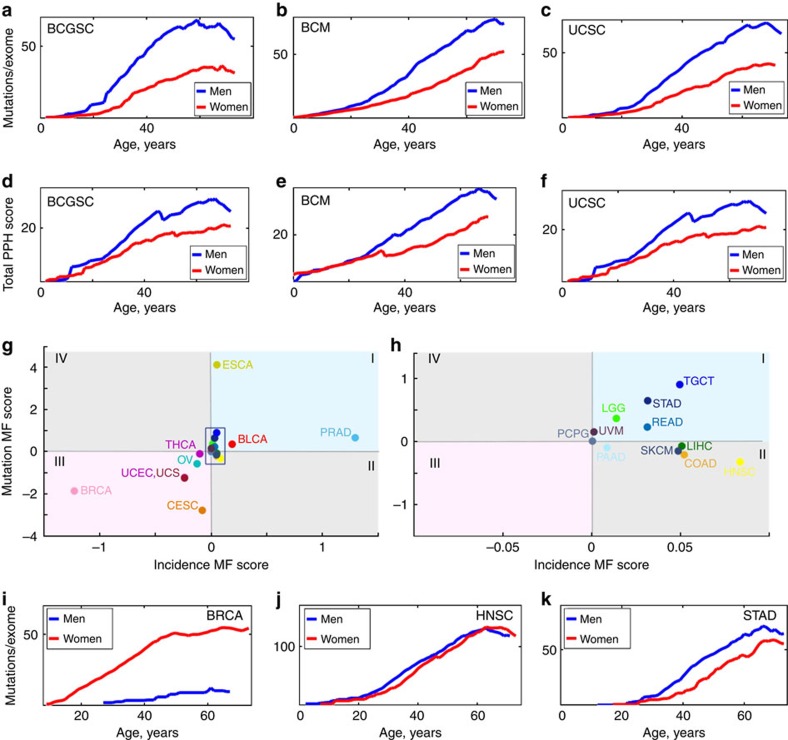
Somatic mutations have long been implicated in aging and disease, but their impact on fitness and function is difficult to assess. Here by analysing human cancer genomes we identify mutational patterns associated with aging. Our analyses suggest that age-associated mutation load and burden double approximately every 8 years, similar to the all-cause mortality doubling time. This analysis further reveals variance in the rate of aging among different human tissues, for example, slightly accelerated aging of the reproductive system. Age-adjusted mutation load and burden correlate with the corresponding cancer incidence and precede it on average by 15 years, pointing to pre-clinical cancer development times. Behaviour of mutation load also exhibits gender differences and late-life reversals, explaining some gender-specific and late-life patterns in cancer incidence rates. Overall, this study characterizes some features of human aging and offers a mechanism for age being a risk factor for the onset of cancer.
Overview
The claims and statistics of this paper haven’t been checked yet.
Run the check — free, no account needed. It reads the open-access text and checks the sources it cites.
Integrity signals
Registry
Cites
Statistics
Figures
Verification
Claims the paper makes
The claims and statistics of this paper haven’t been checked yet.
Run the check — free, no account needed. It reads the open-access text and checks the sources it cites.
Claims other papers make about this one
Each is checked against this paper’s own text: does it say what the citing paper says it does?
The source backs part of the claim, not all of it — or backs it for a different population, condition or comparison.
In the citing paper
“Aging is manifested as a progressive functional decline leading to exponentially increasing prevalence1,2 and incidence of chronic age-related diseases (e.g., cancers, diabetes, cardiovascular diseases, etc.3–5) and disease-specific mortality6.”
From Longitudinal Analysis of Blood Markers Reveals Progressive Loss of Resilience and Predicts Human Lifespan Limit (2021) · cites this paper as [4]
Experimental — accuracy not yet measured
Self-check
Percentages, sums and reported differences re-computed from the paper’s own numbers.
The self-check needs the paper’s full text.
Citations
Cites
Age-related clonal hematopoiesis associated with adverse outcomes
Jaiswal, S., Fontanillas, P., Flannick, J., Manning, A., Grauman, P. V., Mar, B. G., Lindsley, R. C., Mermel, C. H., Burtt, N., Chavez, A., et al. (2014) · New England Journal of Medicine · doi:10.1056/nejmoa1408617 · Cited by 4,841
Clonal hematopoiesis and blood-cancer risk inferred from blood DNA sequence
Genovese, G., Kähler, A. K., Handsaker, R. E., Lindberg, J., Rose, S. A., Bakhoum, S. F., Chambert, K., Mick, E., Neale, B. M., Fromer, M., et al. (2014) · New England Journal of Medicine · doi:10.1056/nejmoa1409405 · Cited by 3,531
Aging, Cellular Senescence, and Cancer
Campisi, J. (2013) · Annual Review of Physiology · doi:10.1146/annurev-physiol-030212-183653 · Cited by 2,954 · cited 2×
“Since cancer is a disease of aging 8,9 , age-related changes in mutation accumulation also expose patterns of damage accumulation in cells 53 .”
Distant metastasis occurs late during the genetic evolution of pancreatic cancer
Yachida, S., Jones, S., Bozic, I., Antal, T., Leary, R., Fu, B., Kamiyama, M., Hruban, R. H., Eshleman, J. R., Nowak, M. A., et al. (2010) · Nature · doi:10.1038/nature09515 · Cited by 2,502
Sporadic autism exomes reveal a highly interconnected protein network of de novo mutations
O’Roak, B. J., Vives, L., Girirajan, S., Karakoc, E., Krumm, N., Coe, B. P., Levy, R., Ko, A., Lee, C., Smith, J. D., et al. (2012) · Nature · doi:10.1038/nature10989 · Cited by 2,165 · cited 1×
“(3) The errors in determination of Poisson l1⁄4Nfull(t) extrated from the univariate distributions were collected and then the error provided by moving average of Nfull(t) was straightforwardly estimated.”
BackgroundRate of de novo mutations and the importance of father’s age to disease risk
Kong, A., Frigge, M. L., Masson, G., Besenbacher, S., Sulem, P., Magnusson, G., Gudjonsson, S. A., Sigurdsson, A., Jonasdottir, A., Jonasdottir, A., et al. (2012) · Nature · doi:10.1038/nature11396 · Cited by 2,134
Patterns and rates of exonic de novo mutations in autism spectrum disorders
Neale, B. M., Kou, Y., Liu, L., Ma’ayan, A., Samocha, K. E., Sabo, A., Lin, C.-F., Stevens, C., Wang, L.-S., Makarov, V., et al. (2012) · Nature · doi:10.1038/nature11011 · Cited by 1,734
Bender, A., Krishnan, K. J., Morris, C. M., Taylor, G. A., Reeve, A. K., Perry, R. H., Jaros, E., Hersheson, J. S., Betts, J., Klopstock, T., et al. (2006) · Nature Genetics · doi:10.1038/ng1769 · Cited by 1,570
Spatial and temporal diversity in genomic instability processes defines lung cancer evolution
de Bruin, E. C., McGranahan, N., Mitter, R., Salm, M., Wedge, D. C., Yates, L., Jamal-Hanjani, M., Shafi, S., Murugaesu, N., Rowan, A. J., et al. (2014) · Science · doi:10.1126/science.1253462 · Cited by 1,117
Coskun, P. E., Beal, M. F., & Wallace, D. C. (2004) · Proceedings of the National Academy of Sciences · doi:10.1073/pnas.0403649101 · Cited by 556
Research works printed but not linked: 41
- Sanders, S. J. et al. De novo mutations revealed by whole-exome sequencing are strongly associated with autism. Nature 485, 237–241 (2012). · DOI · Paper page
- Hanahan, D. & Weinberg, R. A. Hallmarks of cancer: the next generation. Cell 144, 646–674 (2011). · DOI · Paper page
- de Magalhães, J. P. How ageing processes influence cancer. Nat. Rev. Cancer 13, 357–365 (2013). · DOI · Paper page
- Lynch, M. Rate, molecular spectrum, and consequences of human mutation. Proc. Natl Acad. Sci. USA 107, 961–968 (2010). · DOI · Paper page
- Vijg, J. & Suh, Y. Genome instability and aging. Annu. Rev. Physiol. 75, 645–668 (2013). · DOI
- Alexandrov, L. B. et al. Signatures of mutational processes in human cancer. Nature 500, 415–421 (2013). · DOI · Paper page
- Tomasetti, C., Vogelstein, B. & Parmigiani, G. Half or more of the somatic mutations in cancers of self-renewing tissues originate prior to tumour initiation. Proc. Natl Acad. Sci. USA 110, 1999–2004 (2013). · DOI
- Vogelstein, B. et al. Cancer genome landscapes. Science 339, 1546–1558 (2013). · DOI · Paper page
- Weinstein, J. N. et al. The Cancer Genome Atlas Pan-Cancer analysis project. Nat. Genet. 45, 1113–1120 (2013). · DOI · Paper page
- Alexandrov, L. B. et al. Clock-like mutational processes in human somatic cells. Nat. Genet. 47, 1402–1407 (2015). · DOI
- Milholland, B., Auton, A., Suh, Y. & Vijg, J. Age-related somatic mutations in the cancer genome. Oncotarget 6, 24627–24635 (2015). · DOI
- Harding, C., Pompei, F., Lee, E. E. & Wilson, R. Cancer suppression at old age. Cancer Res. 68, 4465–4478 (2008). · DOI
- Harding, C., Pompei, F. & Wilson, R. Peak and decline in cancer incidence, mortality, and prevalence at old ages. Cancer 118, 1371–1386 (2012). · DOI
- Alexandrov, L. B., Nik-Zainal, S., Wedge, D. C., Campbell, P. J. & Stratton, M. R. Deciphering signatures of mutational processes operative in human cancer. Cell Rep. 3, 246–259 (2013). · DOI
- Francioli, L. C. et al. Genome-wide patterns and properties of de novo mutations in humans. Nat. Genet. 47, 822–826 (2015). · DOI
- Brown, P. O. & Palmer, C. The preclinical natural history of serous ovarian cancer: defining the target for early detection. PLoS Med. 6, e1000114 (2009). · DOI
- Jones, S. et al. Comparative lesion sequencing provides insights into tumour evolution. Proc. Natl Acad. Sci. USA 105, 4283–4288 (2008). · DOI
- Klein, C. A. Parallel progression of primary tumours and metastases. Nat. Rev. Cancer 9, 302–312 (2009). · DOI
- van Oortmarssen, G. J. & Habbema, J. D. Epidemiological evidence for age-dependent regression of pre-invasive cervical cancer. Br. J. Cancer 64, 559–565 (1991). · DOI
- Peer, P. G. M., Van Dijck, J. A. A. M., Verbeek, A. L. M., Hendriks, J. H. C. L. & Holland, R. Age-dependent growth rate of primary breast cancer. Cancer 71, 3547–3551 (1993). · DOI
- Bialecki, E. S. & Di Bisceglie, A. M. Diagnosis of hepatocellular carcinoma. HPB (Oxford) 7, 26–34 (2005). · DOI
- Friberg, S. & Mattson, S. On the growth rates of human malignant tumours: implications for medical decision making. J. Surg. Oncol. 65, 284–297 (1997). · DOI
- Furukawa, H., Iwata, R. & Moriyama, N. Growth rate of pancreatic adenocarcinoma: initial clinical experience. Pancreas 22, 366–369 (2001). · DOI
- Haruma, K. et al. Evaluation of tumour growth rate in patients with early gastric carcinoma of the elevated type. Gastrointest. Radiol. 16, 289–292 (1991). · DOI
- Ozono, S. Tumour doubling time of renal cell carcinoma measured by CT: collaboration of Japanese Society of Renal Cancer. Jpn. J. Clin. Oncol. 34, 82–85 (2004). · DOI
- Schmid, H.-P., McNeal, J. E. & Stamey, T. A. Observations on the doubling time of prostate cancer. The use of serial prostate-specific antigen in patients with untreated disease as a measure of increasing cancer volume. Cancer 71, 2031–2040 (1993). · DOI
- Wang, J. C. et al. Rapidly growing small peripheral lung cancers detected by screening CT: correlation between radiological appearance and pathological features. Br. J. Radiol. 73, 930–937 (2000). · DOI
- Zhang, J. et al. Intratumor heterogeneity in localized lung adenocarcinomas delineated by multiregion sequencing. Science 346, 256–259 (2014). · DOI · Paper page
- Gerlinger, M. et al. Genomic architecture and evolution of clear cell renal cell carcinomas defined by multiregion sequencing. Nat. Genet. 46, 225–233 (2014). · DOI
- Yates, L. R. et al. Subclonal diversification of primary breast cancer revealed by multiregion sequencing. Nat. Med. 21, 751–759 (2015). · DOI
- Gundem, G. et al. The evolutionary history of lethal metastatic prostate cancer. Nature 520, 353–357 (2015). · DOI
- Roberts, S. A. & Gordenin, D. A. Hypermutation in human cancer genomes: footprints and mechanisms. Nat. Rev. Cancer 14, 786–800 (2014). · DOI
- Hoeijmakers, J. H. J. DNA damage, aging, and cancer. New Engl. J. Med. 361, 1475–1485 (2009). · DOI · Paper page
- Schelter, B., Winterhalder, M. & Timmer, J. Handbook of Time Series Analysis: Recent Therorectical Developments and Applications (eds John Wiley & Sons (2006). · DOI
- Armitage, P. & Doll, R. The age distribution of cancer and a multi-stage theory of carcinogenesis. Br. J. Cancer 8, 1–12 (1954). · DOI · Paper page
- Gladyshev, V. N. Aging: progressive decline in fitness due to the rising deleteriome adjusted by genetic, environmental, and stochastic processes. Aging Cell doi:10.1111/acel.12480 (2016). · DOI
- Cook, M. B. et al. Sex disparities in cancer incidence by period and age. Cancer Epidemiol. Biomarkers Prev. 18, 1174–1182 (2009). · DOI
- Cook, M. B., McGlynn, K. A., Devesa, S. S., Freedman, N. D. & Anderson, W. F. Sex disparities in cancer mortality and survival. Cancer Epidemiol. Biomarkers Prev 20, 1629–1637 (2011). · DOI
- Gladyshev, V. N. The origin of aging: imperfectness-driven non-random damage defines the aging process and control of lifespan. Trends Genet. 29, 506–512 (2013). · DOI
- Vaupel, J. W. Biodemography of human ageing. Nature 464, 536–542 (2010). · DOI · Paper page
- Adzhubei, I. A. et al. A method and server for predicting damaging missense mutations. Nat. Methods 7, 248–249 (2010). · DOI · Paper page
Cited by
Sorted by citations
Sex differences in biological aging with a focus on human studies
Hägg, S., & Jylhävä, J. (2021) · eLife · doi:10.7554/elife.63425 · Cited by 442
“to have mutation accumulation earlier in life (Podolskiy et al., 2016), and in several premature-aging”
BackgroundThymic involution and rising disease incidence with age
Palmer, S., Albergante, L., Blackburn, C. C., & Newman, T. J. (2018) · Proceedings of the National Academy of Sciences · doi:10.1073/pnas.1714478115 · Cited by 364
A whole lifespan mouse multi-tissue DNA methylation clock
Meer, M. V., Podolskiy, D. I., Tyshkovskiy, A., & Gladyshev, V. N. (2018) · eLife · doi:10.7554/elife.40675 · Cited by 176
Self-citationProtein synthesis and quality control in aging
Anisimova, A. S., Alexandrov, A. I., Makarova, N. E., Gladyshev, V. N., & Dmitriev, S. E. (2018) · Aging · doi:10.18632/aging.101721 · Cited by 172
Self-citationPyrkov, T. V., Avchaciov, K., Tarkhov, A. E., Menshikov, L. I., Gudkov, A. V., & Fedichev, P. O. (2021) · Nature Communications · doi:10.1038/s41467-021-23014-1 · Cited by 139
Metadata
- Authors
- Podolskiy, D. I., Lobanov, A. V., Kryukov, G. V., & Gladyshev, V. N.
- Venue
- Nature Communications
- Published
- 2016-08-12
- Volume
- 7
- Issue
- 1
- ISSN
- 2041-1723
- PMC
- PMC4990632
- Cited by
- 100
- References
- 11
- Language
- en
About these checks
Registry, retraction, Cites and statistics results are computed, not judged, with one exception: a printed reference that no index lists is read once by a model before it counts as a citation error. Claims are extracted by a model and kept only when their quote appears verbatim in the text; each cited source is then checked, with a model’s help, for whether it says what the claim relies on. Those verdicts can be wrong — read the claim’s quote and the cited source before relying on one.
Statistics and arithmetic are recomputed, not judged.
Confidence bands are shown only for fields calibrated on our annotated test set. None is calibrated yet, so no band is shown.
What counts as a claim ›How we measure confidence ›How we check this ›
Are you an author, or do you see a problem with this page? Request a review
