

The DOI matches its Crossref record; 36 of the 37 references it cites were found in a registry or an index.
The size and culturability of patient-generated SARS-CoV-2 aerosol
Open accessPublished version of a preprint
Abstract
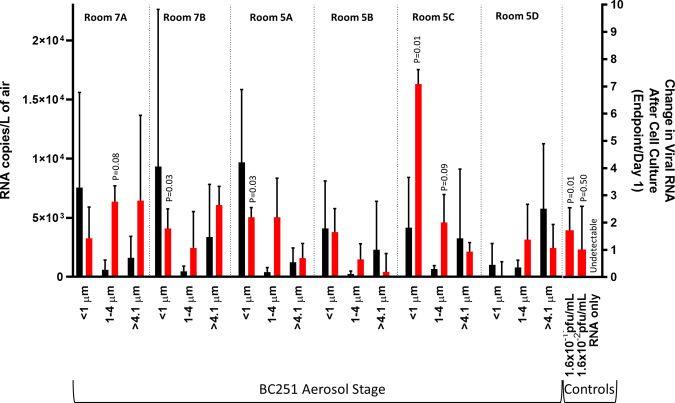
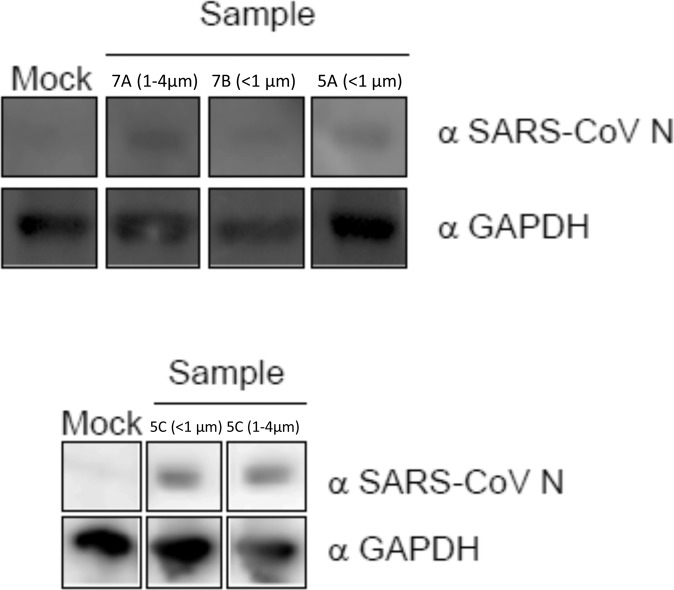
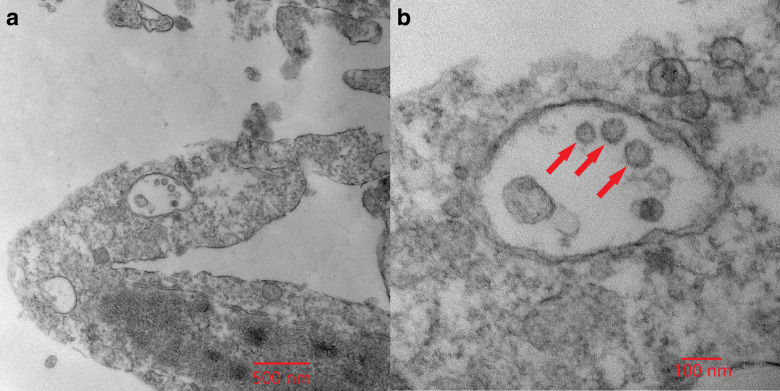
BACKGROUND: Aerosol transmission of COVID-19 is the subject of ongoing policy debate. Characterizing aerosol produced by people with COVID-19 is critical to understanding the role of aerosols in transmission. OBJECTIVE: We investigated the presence of virus in size-fractioned aerosols from six COVID-19 patients admitted into mixed acuity wards in April of 2020. METHODS: Size-fractionated aerosol samples and aerosol size distributions were collected from COVID-19 positive patients. Aerosol samples were analyzed for viral RNA, positive samples were cultured in Vero E6 cells. Serial RT-PCR of cells indicated samples where viral replication was likely occurring. Viral presence was also investigated by western blot and transmission electron microscopy (TEM). RESULTS: SARS-CoV-2 RNA was detected by rRT-PCR in all samples. Three samples confidently indicated the presence of viral replication, all of which were from collected sub-micron aerosol. Western blot indicated the presence of viral proteins in all but one of these samples, and intact virions were observed by TEM in one sample. SIGNIFICANCE: Observations of viral replication in the culture of submicron aerosol samples provides additional evidence that airborne transmission of COVID-19 is possible. These results support the use of efficient respiratory protection in both healthcare and by the public to limit transmission.
Overview
The claims and statistics of this paper haven’t been checked yet.
Run the check — free, no account needed. It reads the open-access text and checks the sources it cites.
Integrity signals
Registry
Cites
Statistics
Figures
Verification
Claims the paper makes
The claims and statistics of this paper haven’t been checked yet.
Run the check — free, no account needed. It reads the open-access text and checks the sources it cites.
Claims other papers make about this one
Each is checked against this paper’s own text: does it say what the citing paper says it does?
The check wasn’t confident either way, so it gives no verdict — never disputed.
In the citing paper
“particle sizes smaller than the minimum pathogen physical size (viral [da > 0.1 µm] [44,45] and bacterial [da > 1 µm] [46]) were assumed to be non-infectious”
From Comparative Mask Protection against Inhaling Wildfire Smoke, Allergenic Bioaerosols, and Infectious Particles (2022) · cites this paper as [45]
Experimental — accuracy not yet measuredIn the citing paper
“Laboratory, field, modelling, and case studies have shown that airborne transmission through the inhalation of a virus-laden aerosol is important, if not dominant, for COVID-19.119, 120, 121, 122, 123, 124, 125, 126, 127, 128, 129, 130, 131, 132”
From The Lancet Commission on lessons for the future from the COVID-19 pandemic (2022) · cites this paper as [122]
Self-check
Percentages, sums and reported differences re-computed from the paper’s own numbers.
The self-check needs the paper’s full text.
Citations
Cites
Hoffmann, M., Kleine-Weber, H., Schroeder, S., Krüger, N., Herrler, T., Erichsen, S., Schiergens, T. S., Herrler, G., Wu, N.-H., Nitsche, A., et al. (2020) · Cell · doi:10.1016/j.cell.2020.02.052 · Cited by 20,286
Aerosol and surface stability of SARS-CoV-2 as compared with SARS-CoV-1
van Doremalen, N., Bushmaker, T., Morris, D. H., Holbrook, M. G., Gamble, A., Williamson, B. N., Tamin, A., Harcourt, J. L., Thornburg, N. J., Gerber, S. I., et al. (2020) · New England Journal of Medicine · doi:10.1056/nejmc2004973 · Cited by 9,951
Atmospheric Chemistry and Physics: From Air Pollution to Climate Change
Seinfeld, J. H., Pandis, S. Ν., & Noone, K. (1998) · Physics Today · doi:10.1063/1.882420 · Cited by 8,843
Chan, J., Yuan, S.-F., Kok, K.-H., To, K., Chu, H., Yang, J., Xing, F., Liu, J.-L., Yip, C., Poon, R., et al. (2020) · The Lancet · doi:10.1016/s0140-6736(20)30154-9 · Cited by 8,450
Aerodynamic Analysis of SARS-CoV-2 in Two Wuhan Hospitals
Liu, Y., Ning, Z., Chen, Y., Guo, M., Liu, Y., Gali, N. K., Sun, L., Duan, Y., Cai, J., Westerdahl, D., et al. (2020) · Nature · doi:10.1038/s41586-020-2271-3 · Cited by 1,872
Identifying airborne transmission as the dominant route for the spread of COVID-19
Zhang, R., Li, Y., Zhang, A. L., Wang, Y., & Molina, M. J. (2020) · Proceedings of the National Academy of Sciences · doi:10.1073/pnas.2009637117 · Cited by 1,236
Morawska, L., Johnson, G. R., Ristovski, Z. D., Hargreaves, M., Mengersen, K., Corbett, S., Chao, C. Y. H., Li, Y., & Katoshevski, D. (2009) · Journal of Aerosol Science · doi:10.1016/j.jaerosci.2008.11.002 · Cited by 1,129
Chao, C. Y. H., Wan, M. P., Morawska, L., Johnson, G. R., Ristovski, Z., Hargreaves, M. H., Mengersen, K. L., Corbett, S. J., Li, Y., Xie, X., et al. (2008) · Journal of Aerosol Science · doi:10.1016/j.jaerosci.2008.10.003 · Cited by 1,090
Aerosol and surface contamination of SARS-CoV-2 observed in quarantine and isolation care
Santarpia, J. L., Rivera, D. N., Herrera, V. L., Morwitzer, M. J., Creager, H. M., Santarpia, G. W., Crown, K. K., Brett‐Major, D. M., Schnaubelt, E. R., Broadhurst, M. J., et al. (2020) · Scientific Reports · doi:10.1038/s41598-020-69286-3 · Cited by 956
Self-citationDetection of air and surface contamination by SARS-CoV-2 in hospital rooms of infected patients
Chia, P. Y., Coleman, K. K., Tan, Y. K., Ong, S. W. X., Gum, M., Lau, S. K., Lim, X. F., Lim, A. S., Sutjipto, S., Lee, P. H., et al. (2020) · Nature Communications · doi:10.1038/s41467-020-16670-2 · Cited by 932
Cited by
Sorted by citations
Airborne transmission of respiratory viruses
Wang, C. C., Prather, K. A., Sznitman, J., Jimenez, J. L., Lakdawala, S. S., Tüfekçi, Z., & Marr, L. C. (2021) · Science · doi:10.1126/science.abd9149 · Cited by 1,631
The Lancet Commission on lessons for the future from the COVID-19 pandemic
Sachs, J. D., Karim, S. S. A., Aknin, L., Allen, J., Brosbøl, K., Colombo, F., Barron, G. C., Espinosa, M. F., Gaspar, V., Gaviria, A., et al. (2022) · The Lancet · doi:10.1016/s0140-6736(22)01585-9 · Cited by 842
A guideline to limit indoor airborne transmission of COVID-19
Bazant, M. Z., & Bush, J. W. M. (2021) · Proceedings of the National Academy of Sciences · doi:10.1073/pnas.2018995118 · Cited by 493
Bourdrel, T., Annesi-Maesano, I., Alahmad, B., Maesano, C. N., & Bind, M.-A. (2021) · European Respiratory Review · doi:10.1183/16000617.0242-2020 · Cited by 224
Respiratory aerosols and droplets in the transmission of infectious diseases
Pöhlker, M. L., Pöhlker, C., Krüger, O. O., Förster, J., Berkemeier, T., Elbert, W., Fröhlich‐Nowoisky, J., Pöschl, U., Bagheri, G., Bodenschatz, E., et al. (2023) · Reviews of Modern Physics · doi:10.1103/revmodphys.95.045001 · Cited by 222
Metadata
- Authors
- Santarpia, J. L., Herrera, V. L., Rivera, D. N., Ratnesar-Shumate, S., Reid, S. P., Ackerman, D. N., Denton, P. W., Martens, J. W. S., Fang, Y., Conoan, N., Callahan, M. V., Lawler, J. V., Brett-Major, D. M., & Lowe, J. J.
- Affiliations
- National Strategic Research Institute (US)
- University of Nebraska Medical Center (US)
- University of Nebraska at Omaha (US)
- Massachusetts General Hospital (US)
- Corresponding author
- Santarpia, Joshua L.
- ORCID
- Venue
- Journal of Exposure Science & Environmental Epidemiology
- Published
- 2021-08-18
- Volume
- 32
- Issue
- 5
- Pages
- 706-711
- ISSN
- 1559-0631 (ISSN-L)
- 1559-064X
- PMC
- PMC8372686
- OpenAlex
- W3194845932
- Cited by
- 196
- References
- 37
- Citations by year
- 2026: 8 · 2025: 20 · 2024: 22 · 2023: 40 · 2022: 43 · 2021: 43
- FWCI
- 24.03
- Type
- journal article
- Language
- en
- Open access
- hybrid
- doi.org
- Locations
- Journal of Exposure Science & Environmental Epidemiology (publishedVersion, cc-by)
- medRxiv (acceptedVersion, cc-by-nc-nd)
- PubMed Central (publishedVersion, cc-by)
- PubMed (publishedVersion)
- DigitalCommons@UNO (submittedVersion, cc-by)
- DigitalCommons@UNMC (submittedVersion, cc-by)
- Funders
- National Science Foundation (2032135)
- University of Nebraska Medical Center
- National Institute for Occupational Safety and Health
- Topics
- Health Sciences › Medicine › Pulmonary and Respiratory Medicine › Infection Control and Ventilation
- Health Sciences › Dentistry › General Dentistry › Dental Research and COVID-19
- Health Sciences › Medicine › Infectious Diseases › SARS-CoV-2 and COVID-19 Research
- Keywords
- SARS-CoV-2, COVID-19 pandemic, airborne transmission, aerosol size distribution, size-fractionated aerosols, viral replication, submicron aerosols, viral RNA, viral proteins, virus particles, respiratory protection, hospital wards
- MeSH terms
- COVID-19, SARS-CoV-2, Respiratory Aerosols and Droplets, Humans, RNA, Viral, Viral Proteins
About these checks
Registry, retraction, Cites and statistics results are computed, not judged, with one exception: a printed reference that no index lists is read once by a model before it counts as a citation error. Claims are extracted by a model and kept only when their quote appears verbatim in the text; each cited source is then checked, with a model’s help, for whether it says what the claim relies on. Those verdicts can be wrong — read the claim’s quote and the cited source before relying on one.
Statistics and arithmetic are recomputed, not judged.
Confidence bands are shown only for fields calibrated on our annotated test set. None is calibrated yet, so no band is shown.
What counts as a claim ›How we measure confidence ›How we check this ›
Are you an author, or do you see a problem with this page? Request a review
