

The DOI matches its Crossref record; 81 of the 81 references it cites were found in a registry or an index.
TNFα and IL-1β modify the miRNA cargo of astrocyte shed extracellular vesicles to regulate neurotrophic signaling in neurons
Open accessAbstract
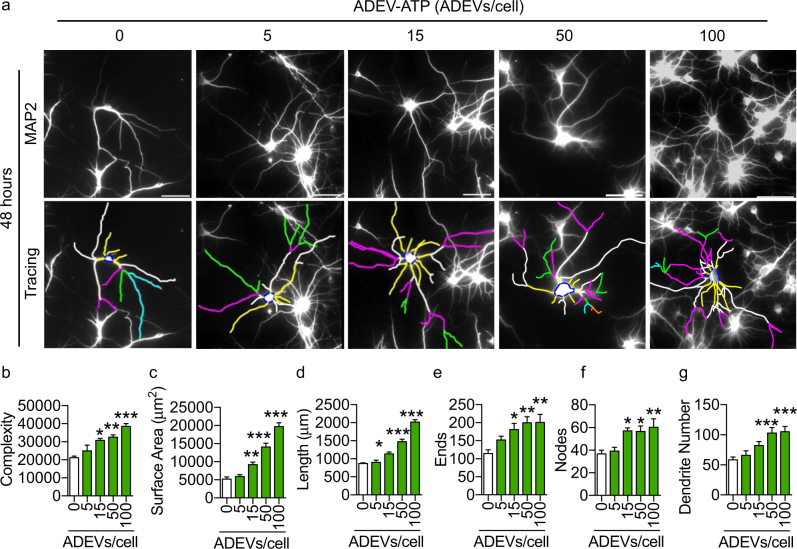
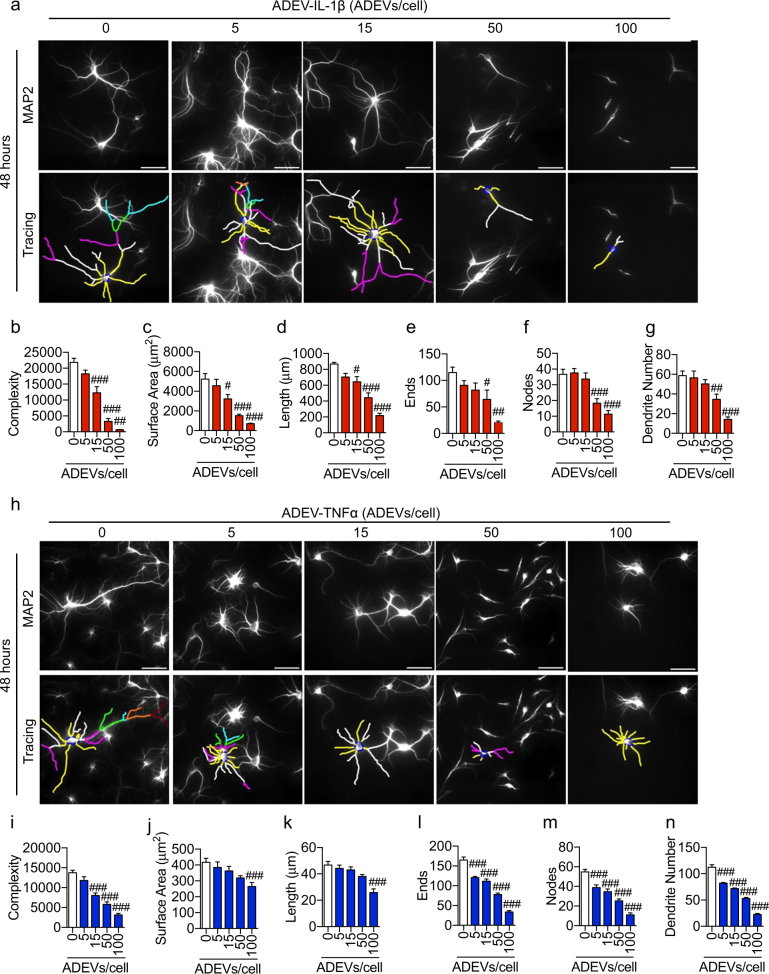
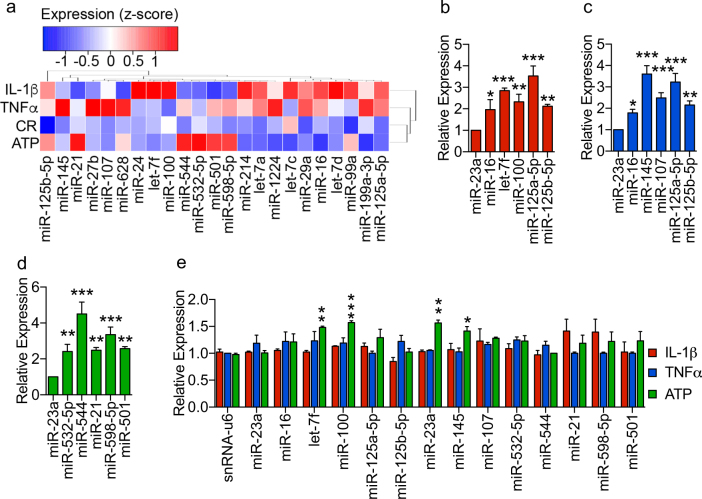
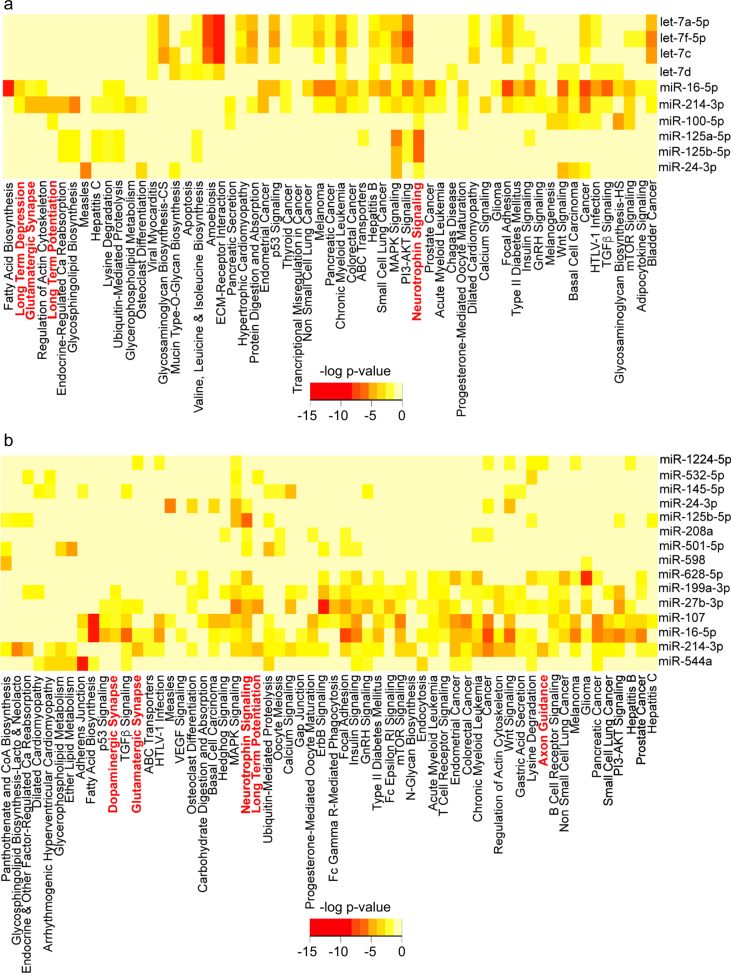
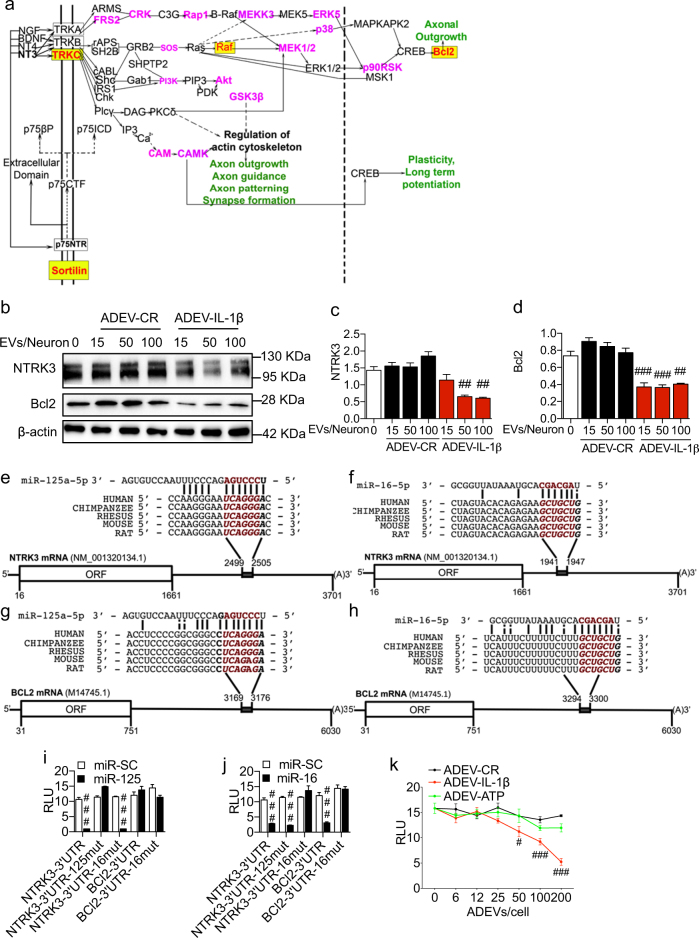
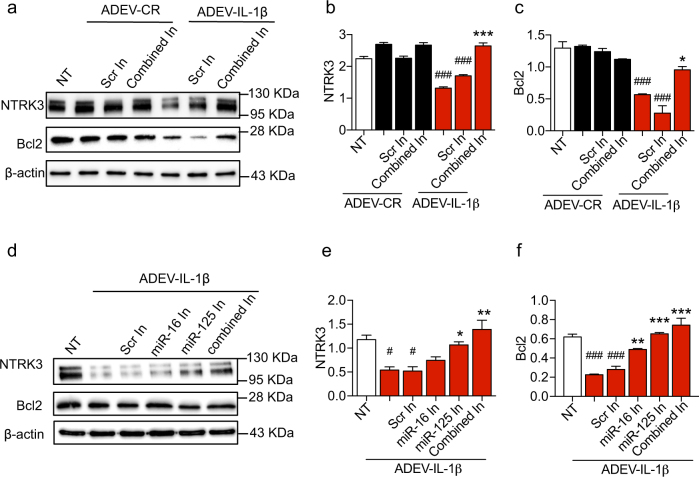
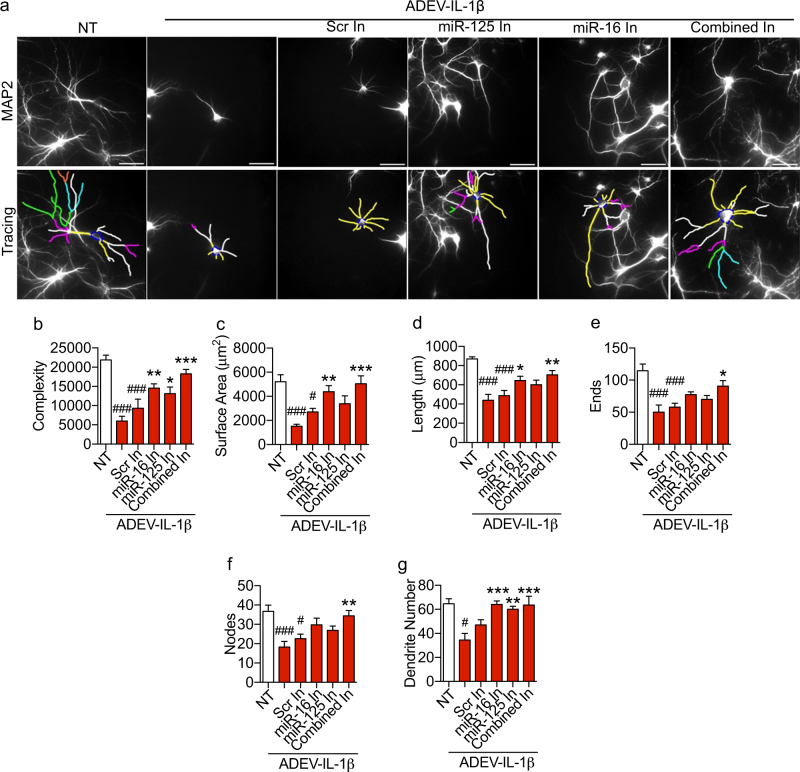
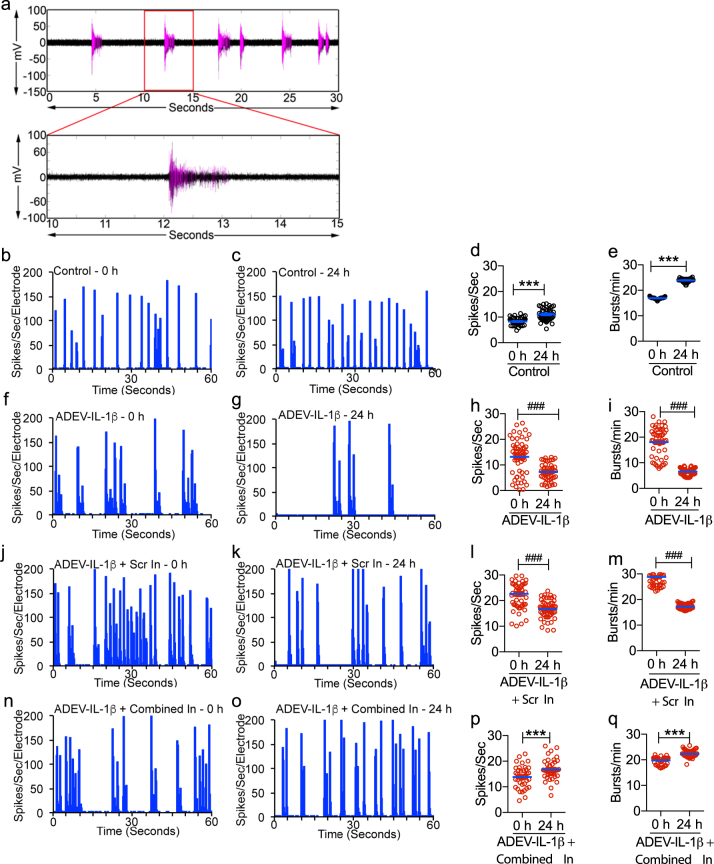
Astrocytes are known to be critical regulators of neuronal function. However, relatively few mediators of astrocyte to neuron communication have been identified. Recent advancements in the biology of extracellular vesicles have begun to implicate astrocyte derived extracellular vesicles (ADEV) as mediators of astrocyte to neuron communication, suggesting that alterations in the release and/or composition of ADEVs could influence gliotransmission. TNFα and IL-1β are key mediators of glial activation and neuronal damage, but the effects of these cytokines on the release or molecular composition of ADEVs is unknown. We found that ADEVs released in response to IL-1β (ADEV-IL-1β) and TNFα (ADEV-TNFα) were enriched with miRNAs that target proteins involved in neurotrophin signaling. We confirmed that miR-125a-5p and miR-16-5p (both enriched in ADEV-IL-1β and ADEV-TNFα) targeted NTKR3 and its downstream effector Bcl2. Downregulation of these targets in neurons was associated with reductions in dendritic growth, dendritic complexity, reduced spike rates, and burst activity. Molecular interference of miR-125a-5p and miR-16-5p prevented ADEV-IL-1β from reducing dendritic complexity, spike, and burst rates. These findings suggest that astrocytes respond to inflammatory challenge by modifying the miRNA cargo of ADEVs to diminish the activity of target neurons by regulating the translational expression of proteins controlling programs essential for synaptic stability and neuronal excitability.
Overview
The claims and statistics of this paper haven’t been checked yet.
Run the check — free, no account needed. It reads the open-access text and checks the sources it cites.
Integrity signals
Registry
Cites
Statistics
Figures
Verification
Claims the paper makes
The claims and statistics of this paper haven’t been checked yet.
Run the check — free, no account needed. It reads the open-access text and checks the sources it cites.
Claims other papers make about this one
Each is checked against this paper’s own text: does it say what the citing paper says it does?
The cited source says what the claim attributes to it.
In the citing paper
“Furthermore, in the context of TNF-α or IL-1β stimulation, astrocyte-derived EVs have been shown to contain miR-125a-5p and miR-16-5p [198].”
From Extracellular vesicles as nanotheranostic platforms for targeted neurological disorder interventions (2024) · cites this paper as [198]
Self-check
Percentages, sums and reported differences re-computed from the paper’s own numbers.
The self-check needs the paper’s full text.
Citations
Cites
Ceramide Triggers Budding of Exosome Vesicles into Multivesicular Endosomes
Trajković, K., Hsu, C., Chiantia, S., Rajendran, L., Wenzel, D., Wieland, F., Schwille, P., Brügger, B., & Simons, M. (2008) · Science · doi:10.1126/science.1153124 · Cited by 3,760
Kowal, J., Arras, G., Colombo, M., Jouve, M., Morath, J. P., Primdal-Bengtson, B., Dingli, F., Loew, D., Tkach, M., & Théry, C. (2016) · Proceedings of the National Academy of Sciences · doi:10.1073/pnas.1521230113 · Cited by 3,426
Sumoylated hnRNPA2B1 controls the sorting of miRNAs into exosomes through binding to specific motifs
Villarroya-Beltri, C., Gutiérrez-Vázquez, C., Sánchez-Cabo, F., Pérez-Hernández, D., Vázquez, J., Martin-Cofreces, N., Martinez-Herrera, D. J., Pascual-Montano, A., Mittelbrunn, M., & Sánchez-Madrid, F. (2013) · Nature Communications · doi:10.1038/ncomms3980 · Cited by 1,971
DIANA-miRPath v3.0: deciphering microRNA function with experimental support
Vlachos, I. S., Zagganas, K., Paraskevopoulou, M. D., Georgakilas, G. K., Karagkouni, D., Vergoulis, T., Dalamagas, T., & Hatzigeorgiou, A. G. (2015) · Nucleic Acids Research · doi:10.1093/nar/gkv403 · Cited by 1,716
Depletion of microglia and inhibition of exosome synthesis halt tau propagation
Asai, H., Ikezu, S., Tsunoda, S., Medalla, M., Luebke, J., Haydar, T., Wolozin, B., Butovsky, O., Kügler, S., & Ikezu, T. (2015) · Nature Neuroscience · doi:10.1038/nn.4132 · Cited by 1,591
Alzheimer’s disease β-amyloid peptides are released in association with exosomes
Rajendran, L., Honsho, M., Zahn, T. R., Keller, P., Geiger, K. D., Verkade, P., & Simons, K. (2006) · Proceedings of the National Academy of Sciences · doi:10.1073/pnas.0603838103 · Cited by 1,343
Emmanouilidou, E., Melachroinou, K., Roumeliotis, T., Garbis, S. D., Ntzouni, M., Margaritis, L. H., Stefanis, L., & Vekrellis, K. (2010) · The Journal of Neuroscience · doi:10.1523/jneurosci.5699-09.2010 · Cited by 1,115
Mediation by a CREB Family Transcription Factor of NGF-Dependent Survival of Sympathetic Neurons
Riccio, A., Ahn, S., Davenport, C. M., Blendy, J. A., & Ginty, D. D. (1999) · Science · doi:10.1126/science.286.5448.2358 · Cited by 802
Takahashi, R. H., Milner, T. A., Li, F., Nam, E. E., Edgar, M. A., Yamaguchi, H., Beal, M. F., Xu, H., Greengard, P., & Gouras, G. K. (2002) · The American Journal of Pathology · doi:10.1016/s0002-9440(10)64463-x · Cited by 706
Santangelo, L., Giurato, G., Cicchini, C., Montaldo, C., Mancone, C., Tarallo, R., Battistelli, C., Alonzi, T., Weisz, A., & Tripodi, M. (2016) · Cell Reports · doi:10.1016/j.celrep.2016.09.031 · Cited by 601
Nontemplated Nucleotide Additions Distinguish the Small RNA Composition in Cells from Exosomes
Koppers-Lalic, D., Hackenberg, M., Bijnsdorp, I. V., van Eijndhoven, M. A. J., Sadek, P., Sie, D., Zini, N., Middeldorp, J. M., Ylstra, B., de Menezes, R. X., et al. (2014) · Cell Reports · doi:10.1016/j.celrep.2014.08.027 · Cited by 560
Bcl-2 promotes regeneration of severed axons in mammalian CNS
Chen, D., Schneider, G. E., Martinou, J., & Tonegawa, S. (1997) · Nature · doi:10.1038/385434a0 · Cited by 445
Cooperative Astrocyte and Dendritic Spine Dynamics at Hippocampal Excitatory Synapses
Haber, M., Zhou, L., & Murai, K. K. (2006) · Journal of Neuroscience · doi:10.1523/jneurosci.1302-06.2006 · Cited by 437
FAN, a Novel WD-Repeat Protein, Couples the p55 TNF-Receptor to Neutral Sphingomyelinase
Adam‐Klages, S., Adam, D., Wiegmann, K., Struve, S., Kolanus, W., Schneider‐Mergener, J., & Krönke, M. (1996) · Cell · doi:10.1016/s0092-8674(00)80169-5 · Cited by 381
Wang, G., Dinkins, M. B., He, Q., Zhu, G., Poirier, C., Campbell, A., Mayer‐Pröschel, M., & Bieberich, E. (2012) · Journal of Biological Chemistry · doi:10.1074/jbc.m112.340513 · Cited by 362
Mechanisms of glutamate release from astrocytes
Malarkey, E. B., & Parpura, V. (2007) · Neurochemistry International · doi:10.1016/j.neuint.2007.06.005 · Cited by 356
Pathway across the blood–brain barrier
Ek, M., Engblom, D., Saha, S., Blomqvist, A. G., Jakobsson, P., & Ericsson‐Dahlstrand, A. (2001) · Nature · doi:10.1038/35068632 · Cited by 347
Wang, S., Cesca, F., Loers, G., Schweizer, M., Buck, F., Benfenati, F., Schachner, M., & Kleene, R. (2011) · The Journal of Neuroscience · doi:10.1523/jneurosci.6476-10.2011 · Cited by 324
Basso, M., Pozzi, S., Tortarolo, M., Fiordaliso, F., Bisighini, C., Pasetto, L., Spaltro, G., Lidonnici, D., Gensano, F., Battaglia, E., et al. (2013) · Journal of Biological Chemistry · doi:10.1074/jbc.m112.425066 · Cited by 295
Dickens, A. M., Tovar-y-Romo, L. B., Yoo, S.-W., Trout, A. L., Bae, M., Kanmogne, M., Megra, B., Williams, D. W., Witwer, K. W., Gacias, M., et al. (2017) · Science Signaling · doi:10.1126/scisignal.aai7696 · Cited by 285
Self-citationPolanco, J. C., Scicluna, B. J., Hill, A. F., & Götz, J. (2016) · Journal of Biological Chemistry · doi:10.1074/jbc.m115.709485 · Cited by 280
HDAC4 Governs a Transcriptional Program Essential for Synaptic Plasticity and Memory
Sando, R., Gounko, N., Pieraut, S., Liao, L., Yates, J., & Maximov, A. (2012) · Cell · doi:10.1016/j.cell.2012.09.037 · Cited by 274
Regulation of heat shock protein 70 release in astrocytes: Role of signaling kinases
Taylor, A. R., Robinson, M., Gifondorwa, D. J., Tytell, M., & Milligan, C. E. (2007) · Developmental Neurobiology · doi:10.1002/dneu.20559 · Cited by 261
Martinez-Pabon, F., Caicedo-Guerrero, J., Ibarra-Samboni, J. J., Ramírez-González, G., & Hernández Leo, D. (2022) · The Scientific World JOURNAL · doi:10.1155/8086 · Cited by 259
The Neutral Sphingomyelinase Pathway Regulates Packaging of the Prion Protein into Exosomes
Guo, B. B., Bellingham, S. A., & Hill, A. F. (2014) · Journal of Biological Chemistry · doi:10.1074/jbc.m114.605253 · Cited by 234
Bartkowska, K., Paquin, A., Gauthier, A. S., Kaplan, D. R., & Miller, F. D. (2007) · Development · doi:10.1242/dev.008227 · Cited by 226
Boll, K., Reiche, K., Kasack, K., Mörbt, N., Kretzschmar, A. K., Tomm, J. M., Verhaegh, G. W. C. T., Schalken, J. A., von Bergen�, M., Horn, F., et al. (2012) · Oncogene · doi:10.1038/onc.2012.55 · Cited by 214
Hu, G., Yao, H., Chaudhuri, A. D., Duan, M., Yelamanchili, S. V., Wen, H., Cheney, P. D., Fox, H. S., & Buch, S. J. (2012) · Cell Death and Disease · doi:10.1038/cddis.2012.114 · Cited by 206
Self-citationWheeler, D., Knapp, E., Bandaru, V. V. R., Wang, Y., Knorr, D., Poirier, C., Mattson, M. P., Geiger, J. D., & Haughey, N. J. (2009) · Journal of Neurochemistry · doi:10.1111/j.1471-4159.2009.06038.x · Cited by 201
Self-citationAxotomy-Induced miR-21 Promotes Axon Growth in Adult Dorsal Root Ganglion Neurons
Strickland, I. T., Richards, L. J., Holmes, F. E., Wynick, D., Uney, J. B., & Wong, L. (2011) · PLoS ONE · doi:10.1371/journal.pone.0023423 · Cited by 170
LRRK2 secretion in exosomes is regulated by 14-3-3
Fraser, K. B., Moehle, M. S., Daher, J. P. L., Webber, P. J., Williams, J. Y., Stewart, C. A., Yacoubian, T. A., Cowell, R. M., Dokland, T., Ye, T., et al. (2013) · Human Molecular Genetics · doi:10.1093/hmg/ddt346 · Cited by 168
p160 RhoA-binding Kinase ROKα Induces Neurite Retraction
Katoh, H., Aoki, J., Ichikawa, A., & Negishi, M. (1998) · Journal of Biological Chemistry · doi:10.1074/jbc.273.5.2489 · Cited by 168
miR-21 improves the neurological outcome after traumatic brain injury in rats
Ge, X.-T., Lei, P., Wang, H.-C., Zhang, A.-L., Han, Z.-L., Chen, X., Li, S.-H., Jiang, R.-C., Kang, C.-S., & Zhang, J.-N. (2014) · Scientific Reports · doi:10.1038/srep06718 · Cited by 167
Chen, Q., Xu, J., Li, L., Li, H., Mao, S., Zhang, F., Zen, K., Cy, Z., & Zhang, Q. (2014) · Cell Death and Disease · doi:10.1038/cddis.2014.92 · Cited by 165
A Regulated Secretory Pathway in Cultured Hippocampal Astrocytes
Calegari, F., Coco, S., Taverna, E., BASSETTI, M., Verderio, C., Corradi, N., Matteoli, M., & Rosa, P. (1999) · Journal of Biological Chemistry · doi:10.1074/jbc.274.32.22539 · Cited by 155
Sarıbaş, A. S., Cicalese, S. M., Ahooyi, T. M., Khalili, K., Amini, S., & Sariyer, I. K. (2017) · Cell Death and Disease · doi:10.1038/cddis.2016.467 · Cited by 136
Crippa, D., Schenk, U., Francolini, M., Rosa, P., Verderio, C., Zonta, M., Pozzan, T., Matteoli, M., & Carmignoto, G. (2005) · The Journal of Physiology · doi:10.1113/jphysiol.2005.094052 · Cited by 131
BCL2 regulates neural differentiation.
Zhang, K. Z., Westberg, J. A., Hölttä, E., & Andersson, L. C. (1996) · Proceedings of the National Academy of Sciences · doi:10.1073/pnas.93.9.4504 · Cited by 130
Interleukin-1β in Central Nervous System Injury and Repair.
Hewett, S. J., Jackman, N. A., & Claycomb, R. (2012) · PubMed · Cited by 121
Haughey, N. J., & Mattson, M. P. (2003) · NeuroMolecular Medicine · doi:10.1385/nmm:3:3:173 · Cited by 116
Self-citationActivation of TRPML1 Clears Intraneuronal Aβ in Preclinical Models of HIV Infection
Bae, M. H., Patel, N. P., Xu, H., Lee, M., Tominaga, K., Nath, A., Geiger, J. D., Gorospe, M., Mattson, M. P., & Haughey, N. J. (2014) · Journal of Neuroscience · doi:10.1523/jneurosci.0210-14.2014 · Cited by 113
Self-citationDendrite morphogenesis depends on relative levels of NT-3/TrkC signaling
Joo, W., Hippenmeyer, S., & Luo, L. (2014) · Science · doi:10.1126/science.1258996 · Cited by 110
Gosselin, R., Meylan, P., & Décosterd, I. (2013) · Frontiers in Cellular Neuroscience · doi:10.3389/fncel.2013.00251 · Cited by 105
MicroRNA let-7d regulates the TLX/microRNA-9 cascade to control neural cell fate and neurogenesis
Zhao, C., Sun, G., Ye, P., Li, S., & Shi, Y. (2013) · Scientific Reports · doi:10.1038/srep01329 · Cited by 105
Yang, Z., Zhang, Z., Li, T., Lou, Z., Li, S., Yang, H., Yang, J., Luo, X., & Peng, J. (2014) · Clinical Science · doi:10.1042/cs20140084 · Cited by 82
ROCK1 and ROCK2 inhibition alters dendritic spine morphology in hippocampal neurons
Swanger, S. A., Mattheyses, A. L., Gentry, E. G., & Herskowitz, J. H. (2015) · Cellular Logistics · doi:10.1080/21592799.2015.1133266 · Cited by 81
Chen, C., Orefice, L. L., Chiu, S., LeGates, T. A., Hattar, S. S., Huganir, R. L., Zhao, H., Xu, B., & Kuruvilla, R. (2017) · Proceedings of the National Academy of Sciences · doi:10.1073/pnas.1615792114 · Cited by 80
Zhang, W.-J., Liu, H.-O., Liu, W.-S., Liu, Y., & Xu, J.-Q. (2014) · Cell Death and Differentiation · doi:10.1038/cdd.2014.142 · Cited by 78
Mao, S., Sun, Q., Xiao, H., Zhang, C., & Li, L. (2015) · Protein & Cell · doi:10.1007/s13238-015-0168-y · Cited by 74
The Polycomb group protein EED couples TNF receptor 1 to neutral sphingomyelinase
Philipp, S., Puchert, M., Adam‐Klages, S., Tchikov, V., Winoto‐Morbach, S., Mathieu, S., Deerberg, A., Kolker, L., Marchesini, N., Kabelitz, D., et al. (2009) · Proceedings of the National Academy of Sciences · doi:10.1073/pnas.0908486107 · Cited by 74
Chaudhuri, A. D., Yelamanchili, S. V., Marcondes, M. C. G., & Fox, H. S. (2013) · The FASEB Journal · doi:10.1096/fj.13-232678 · Cited by 72
Self-citationExosome-associated release, uptake, and neurotoxicity of HIV-1 Tat protein
Rahimian, P., & He, J. J. (2016) · Journal of NeuroVirology · doi:10.1007/s13365-016-0451-6 · Cited by 71
Neurotrophin-3 promotes the cholinergic differentiation of sympathetic neurons
Brodski, C., Schnürch, H., & Dechant, G. (2000) · Proceedings of the National Academy of Sciences · doi:10.1073/pnas.160080697 · Cited by 69
Hajj, G. N. M., Arantes, C., Dias, M. V. S., Roffé, M., Costa‐Silva, B., Lopes, M. H., Porto-Carreiro, I., Rabachini, T., Lima, F. R. S., Beraldo, F. H., et al. (2013) · Cellular and Molecular Life Sciences · doi:10.1007/s00018-013-1328-y · Cited by 66
Patapoutian, A., Backus, C., Kispert, A., & Reichardt, L. F. (1999) · Science · doi:10.1126/science.283.5405.1180 · Cited by 65
Zhang, Z., & Cheng, Y. (2014) · The Scientific World JOURNAL · doi:10.1155/2014/938348 · Cited by 63
Ragusa, M., Barbagallo, C., Cirnigliaro, M., Battaglia, R., Brex, D., Caponnetto, A., Barbagallo, D., Pietro, C. D., & Purrello, M. (2017) · Frontiers in Molecular Biosciences · doi:10.3389/fmolb.2017.00066 · Cited by 56
Proteasome-independent polyubiquitin linkage regulates synapse scaffolding, efficacy, and plasticity
Ma, Q., Ruan, H., Peng, L., Zhang, M., Gack, M. U., & Yao, W. (2017) · Proceedings of the National Academy of Sciences · doi:10.1073/pnas.1620153114 · Cited by 55
Moidunny, S., Vinet, J., Wesseling, E. M., Bijzet, J., Shieh, C., van Ijzendoorn, S. C., Bezzi, P., Boddeke, H. W. G. M., & Biber, K. P. H. (2012) · Journal of Neuroinflammation · doi:10.1186/1742-2094-9-198 · Cited by 52
Yang, L., Alexandropoulos, K., & Sap, J. (2002) · Journal of Biological Chemistry · doi:10.1074/jbc.m111902200 · Cited by 50
Zhou, S., Zhang, S., Wang, Y., Yi, S., Zhao, L., Tang, X., Yu, B., Gu, X., & Ding, F. (2014) · Neuroscience Letters · doi:10.1016/j.neulet.2014.12.006 · Cited by 49
Koichiro, Tsujimura, K., Nakashima, H., & Nakashima, K. (2016) · Journal of Biological Chemistry · doi:10.1074/jbc.m115.705749 · Cited by 43
Kong, N., Lu, X., & Li, B. (2014) · BMC Molecular Biology · doi:10.1186/s12867-014-0025-1 · Cited by 43
Ma, S., Liu, G., Lin, J., Pang, X., Wang, Y., Wang, Z., Yu, Y., & Yu, J. (2016) · Scientific Reports · doi:10.1038/srep36922 · Cited by 42
Huang, D., Wang, G., Zhang, J., Li, Y., Zeng, X., & Jiang, N. (2015) · Japanese Journal of Clinical Oncology · doi:10.1093/jjco/hyv063 · Cited by 41
Yang, G., Song, Y., Zhou, X., Deng, Y., Liu, T., Weng, G., Yu, D., & Pan, S. (2012) · Molecular Medicine Reports · doi:10.3892/mmr.2015.3531 · Cited by 39
Zhu, Z., Wang, S., Zhu, J., Yang, Q., Dong, H., & Huang, J. (2016) · Biological Chemistry · doi:10.1515/hsz-2016-0104 · Cited by 38
MiR-29c/PRKCI Regulates Axonal Growth of Dorsal Root Ganglia Neurons Under Hyperglycemia
Jia, L., Wang, L., Chopp, M., Li, C., Zhang, Y., Szalad, A., & Zhang, Z. G. (2017) · Molecular Neurobiology · doi:10.1007/s12035-016-0374-5 · Cited by 34
Banerjee, P., Dutta, S., & Pal, R. (2015) · Stem Cells · doi:10.1002/stem.2245 · Cited by 34
Sun, L., Bie, Z., Zhang, C., Li, H., Liudong, L., & Yang, J. (2016) · Cell Biology International · doi:10.1002/cbin.10655 · Cited by 34
Let-7a gene knockdown protects against cerebral ischemia/reperfusion injury
Jiang, X., Yu, X., Wang, Z., Liu, F.-F., & Wang, Y. (2016) · Neural Regeneration Research · doi:10.4103/1673-5374.177734 · Cited by 32
Zou, H., Ding, Y., Shi, W., Xu, X., Gong, A., Zhang, Z., & Liu, J. (2014) · Cellular and Molecular Neurobiology · doi:10.1007/s10571-014-0126-x · Cited by 32
Perianayagam, M. C., Madias, N. E., Pereira, B. J. G., & Jaber, B. L. (2006) · European Journal of Clinical Investigation · doi:10.1111/j.1365-2362.2006.01637.x · Cited by 31
Patranabis, S., & Bhattacharyya, S. N. (2016) · Molecular and Cellular Biology · doi:10.1128/mcb.00054-16 · Cited by 30
Fu, L., Shi, Z., Luo, G., Tu, W., Wang, X., Fang, Z., & Li, X.-C. (2014) · Molecular Brain · doi:10.1186/s13041-014-0071-0 · Cited by 27
Jin, S., Dai, Y., Cheng, L., Fang, X., Han, H., & Wang, D. (2016) · PubMed Central · Cited by 27
Poon, V. Y., Gu, M., Ji, F., VanDongen, A. M. J., & Fivaz, M. L. (2016) · BMC Genomics · doi:10.1186/s12864-016-3139-7 · Cited by 25
Zou, H., Ding, Y., Shi, W., Xu, X., Gong, A., Zhang, Z., & Liu, J. (2017) · Cellular and Molecular Neurobiology · doi:10.1007/s10571-017-0493-1 · Cited by 24
Appel, E., Weissmann, S., Salzberg, Y., Orlovsky, K., Negreanu, V., Tsoory, M., Raanan, C., Feldmesser, E., Bernstein, Y., Wolstein, O., et al. (2016) · Genes & Development · doi:10.1101/gad.291484.116 · Cited by 23
Louis, L. K., Gopurappilly, R., Surendran, H., Dutta, S., & Pal, R. (2017) · Journal of Neurochemistry · doi:10.1111/jnc.14155 · Cited by 14
Potential proteins targeted by let-7f-5p in HeLa cells
Wang, Y., Chen, X., Zhang, Y., & Song, J. (2017) · BioScience Trends · doi:10.5582/bst.2017.01037 · Cited by 9
Cited by
Sorted by citations
Upadhya, R., Zingg, W., Shetty, S., & Shetty, A. K. (2020) · Journal of Controlled Release · doi:10.1016/j.jconrel.2020.04.017 · Cited by 282
Varcianna, A., Myszczynska, M. A., Castelli, L. M., O'Neill, B., Kim, Y., Talbot, J., Nyberg, S., Nyamali, I., Heath, P. R., Stopford, M. J., et al. (2019) · EBioMedicine · doi:10.1016/j.ebiom.2018.11.067 · Cited by 194
Vogel, A. D., Upadhya, R., & Shetty, A. K. (2018) · EBioMedicine · doi:10.1016/j.ebiom.2018.11.026 · Cited by 186
You, Y., Borgmann, K., Edara, V. V., Stacy, S., Ghorpade, A., & Ikezu, T. (2020) · Journal of Extracellular Vesicles · doi:10.1080/20013078.2019.1706801 · Cited by 176
NK cell-derived exosomes carry miR-207 and alleviate depression-like symptoms in mice
Li, D., Wang, Y., Jin, X., Hu, D., Xia, C., Xu, H., & Hu, J. (2020) · Journal of Neuroinflammation · doi:10.1186/s12974-020-01787-4 · Cited by 167
Metadata
- Authors
- Chaudhuri, A. D., Dastgheyb, R. M., Yoo, S.-W., Trout, A., Talbot Jr, C. C., Hao, H., Witwer, K. W., & Haughey, N. J.
- Affiliations
- Johns Hopkins University (US)
- Corresponding author
- Haughey, Norman J.
- ORCID
- Venue
- Cell Death & Disease
- Published
- 2018-03-05
- Volume
- 9
- Issue
- 3
- Pages
- 363-363
- ISSN
- 2041-4889 (ISSN-L)
- PMC
- PMC5838212
- OpenAlex
- W2789263143
- Cited by
- 184
- References
- 81
- Citations by year
- 2026: 10 · 2025: 15 · 2024: 21 · 2023: 31 · 2022: 31 · 2021: 30 · 2020: 27 · 2019: 15 · 2018: 4
- FWCI
- 7.12
- Type
- journal article
- Language
- en
- Open access
- gold
- doi.org
- Locations
- Cell Death and Disease (publishedVersion, cc-by)
- PubMed Central (publishedVersion, cc-by)
- PubMed (publishedVersion)
- DOAJ (DOAJ: Directory of Open Access Journals) (submittedVersion)
- Funders
- National Institutes of Health (DA04039, MH075673)
- National Institute on Aging (R01AG057420)
- National Institute of Mental Health (P01MH105280, R25MH080661, R01MH110246, R01MH077542, P30MH075673)
- National Institute on Drug Abuse (R01DA040385, R01DA040390)
- Topics
- Life Sciences › Biochemistry, Genetics and Molecular Biology › Molecular Biology › Extracellular vesicles in disease
- Life Sciences › Neuroscience › Neurology › Neuroinflammation and Neurodegeneration Mechanisms
- Life Sciences › Neuroscience › Cellular and Molecular Neuroscience › Neuroscience and Neuropharmacology Research
- Keywords
- gliotransmission, astrocyte-neuron communication, TNF-α, IL-1β, microRNA cargo, miR-125a-5p, miR-16-5p, NTRK3, Bcl-2, neurotrophin signaling, dendritic complexity, neuronal excitability, synaptic stability, neuroinflammation, glial activation
- MeSH terms
- Extracellular Vesicles, Animals, Astrocytes, Base Sequence, Dendrites, Humans, Nerve Growth Factors, Nerve Net, Neurons, Tumor Necrosis Factor-alpha, Signal Transduction, Rats, Sprague-Dawley, Receptor, trkC, MicroRNAs, Interleukin-1beta, HEK293 Cells
About these checks
Registry, retraction, Cites and statistics results are computed, not judged, with one exception: a printed reference that no index lists is read once by a model before it counts as a citation error. Claims are extracted by a model and kept only when their quote appears verbatim in the text; each cited source is then checked, with a model’s help, for whether it says what the claim relies on. Those verdicts can be wrong — read the claim’s quote and the cited source before relying on one.
Statistics and arithmetic are recomputed, not judged.
Confidence bands are shown only for fields calibrated on our annotated test set. None is calibrated yet, so no band is shown.
What counts as a claim ›How we measure confidence ›How we check this ›
Are you an author, or do you see a problem with this page? Request a review
