

The DOI matches its Crossref record; 13 of the 13 references it cites were found in a registry or an index.
Inhibition of glutaminase elicits senolysis in therapy-induced senescent melanoma cells
Abstract
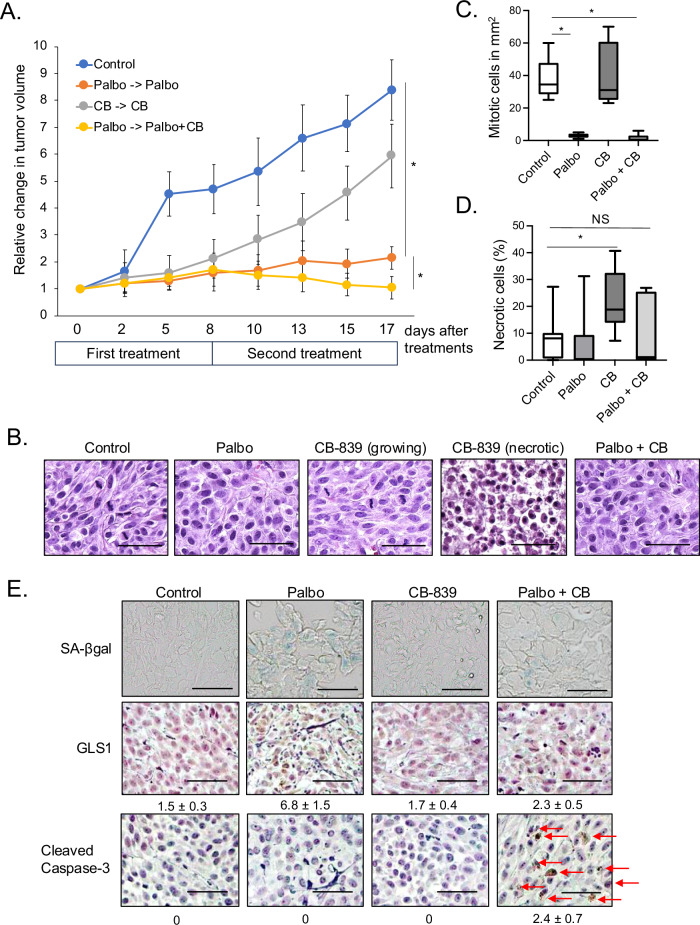
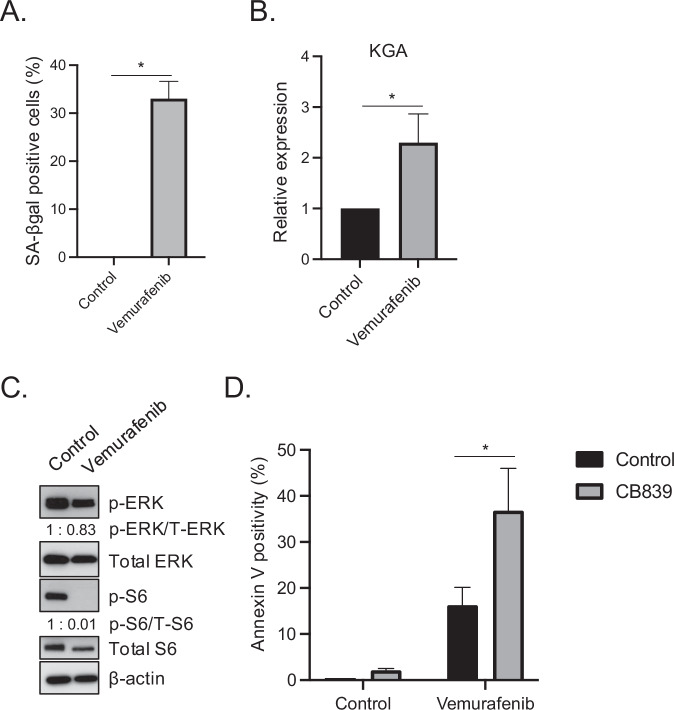
The cyclin D1-Cyclin-Dependent Kinases 4 and 6 (CDK4/6) complex is crucial for the development of melanoma. We previously demonstrated that targeting CDK4/6 using small molecule inhibitors (CDK4/6i) suppresses Braf V600E melanoma growth in vitro and in vivo through induction of cellular senescence. However, clinical trials investigating CDK4/6i in melanoma have not yielded successful outcomes, underscoring the necessity to enhance the therapeutic efficacy of CDK4/6i. Accumulated research has shown that while senescence initially suppresses cell proliferation, a prolonged state of senescence eventually leads to tumor relapse by altering the tumor microenvironment, suggesting that removal of those senescent cells (in a process referred to as senolysis) is of clinical necessity to facilitate clinical response. We demonstrate that glutaminase 1 (GLS1) expression is specifically upregulated in CDK4/6i-induced senescent Braf V600E melanoma cells. Upregulated GLS1 expression renders Braf V600E melanoma senescent cells vulnerable to GLS1 inhibitor (GLS1i). Furthermore, we demonstrate that this senolytic approach targeting upregulated GLS1 expression is applicable even though those cells developed resistance to the Braf V600E inhibitor vemurafenib, a frequently encountered substantial clinical challenge to treating patients. Thus, this novel senolytic approach may revolutionize current CDK4/6i mediated melanoma treatment if melanoma cells undergo senescence prior to developing resistance to CDK4/6i. Given that we demonstrate that a low dose of vemurafenib induced senescence, which renders Braf V600E melanoma cells susceptible to GLS1i and recent accumulated research shows many cancer cells undergo senescence in response to chemotherapy, radiation, and immunotherapy, this senolytic therapy approach may prove applicable to a wide range of cancer types once senescence and GLS1 expression are induced.
Overview
The claims and statistics of this paper haven’t been checked yet.
Run the check — free, no account needed. It reads the open-access text and checks the sources it cites.
Integrity signals
Registry
Cites
Statistics
Figures
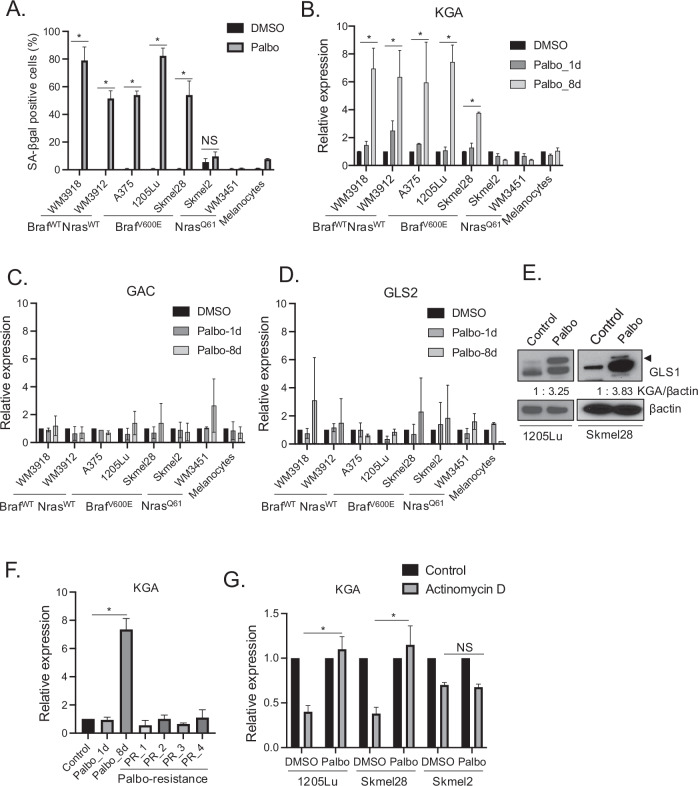
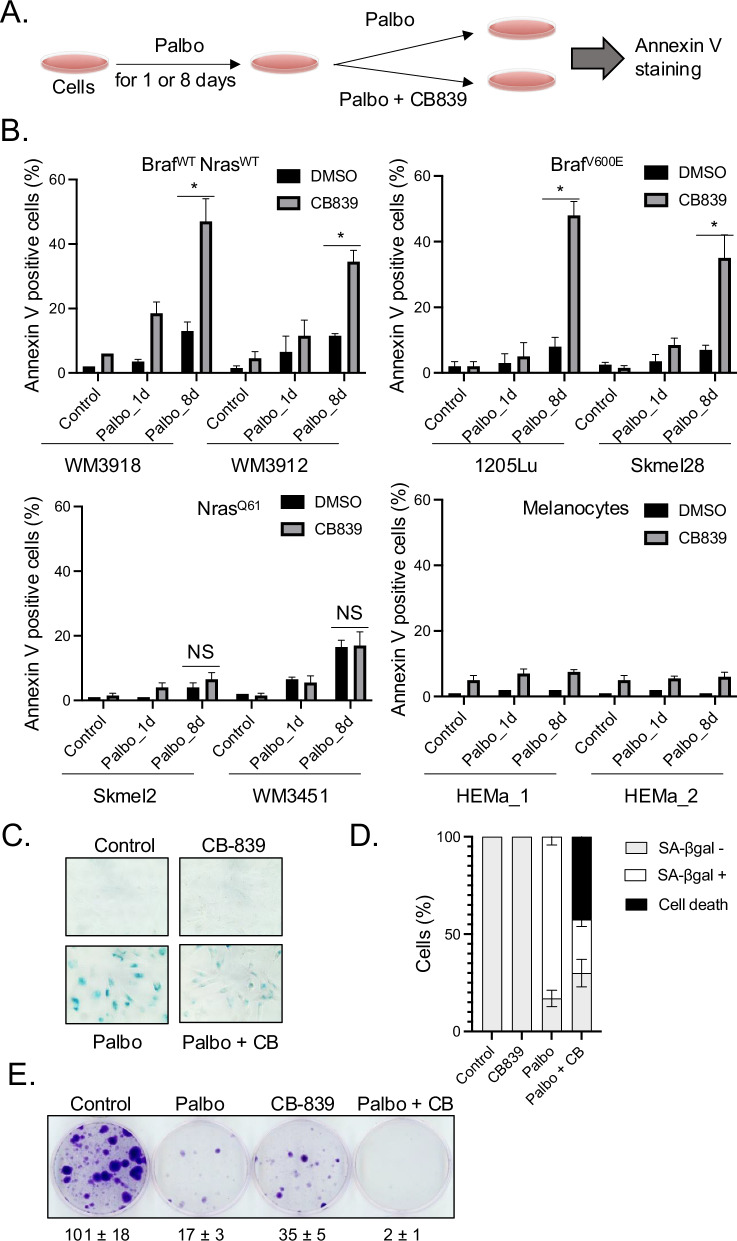
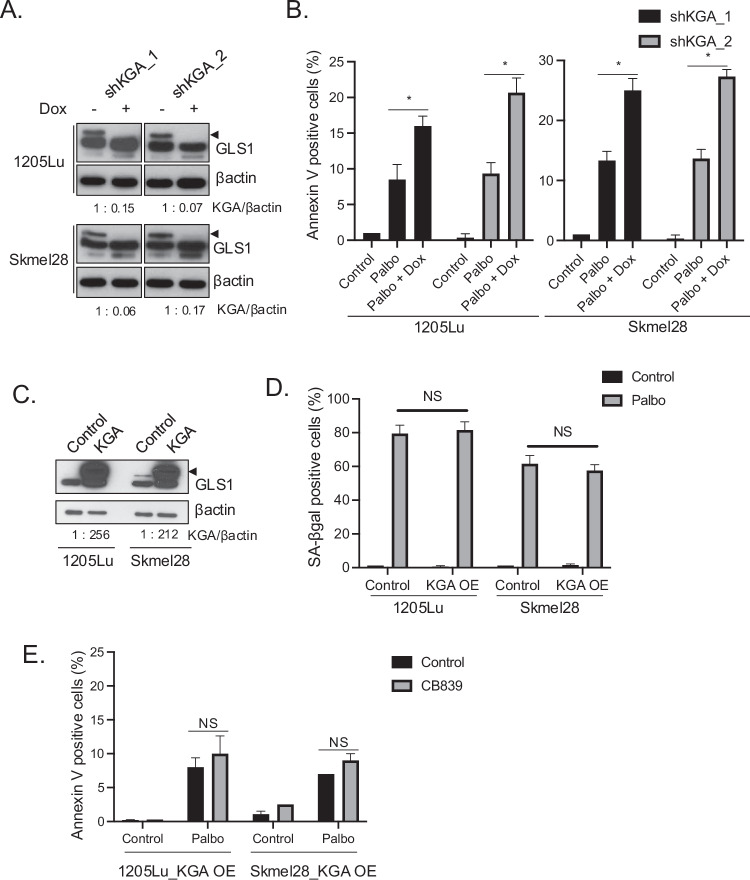
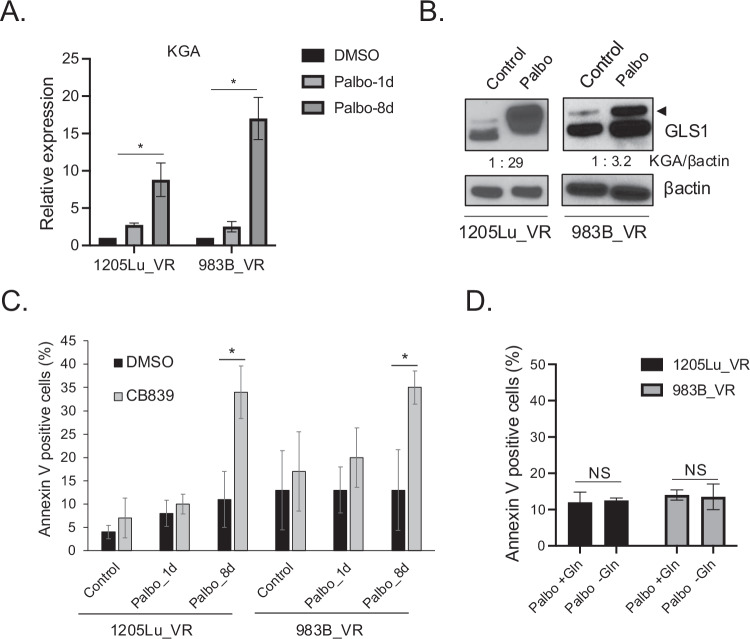
Verification
Claims the paper makes
The claims and statistics of this paper haven’t been checked yet.
Run the check — free, no account needed. It reads the open-access text and checks the sources it cites.
Claims other papers make about this one
Each is checked against this paper’s own text: does it say what the citing paper says it does?
In the citing paper
“GLS1 inhibitors such as BPTES or CB-839 have been shown to selectively induce lethal acidification in a broad spectrum of SnCs72,73”
From Emerging strategies in senotherapeutics: from broad-spectrum senolysis to precision reprogramming (2026) · cites this paper as [72]
Self-check
Percentages, sums and reported differences re-computed from the paper’s own numbers.
The self-check needs the paper’s full text.
Citations
Cites
Clearance of p16Ink4a-positive senescent cells delays ageing-associated disorders
Baker, D. J., Wijshake, T., Tchkonia, T., LeBrasseur, N. K., Childs, B. G., van de Sluis, B., Kirkland, J. L., & van Deursen, J. M. (2011) · Nature · doi:10.1038/nature10600 · Cited by 3,670 · cited 1×
“Senolytic therapy is an emerging therapeutic approach that speci fi cally targets and eliminates senescent cells, which prevents cancer recurrence [12 – 15] as well as extending a healthy lifespan in murine models [16, 17].”
Cellular Senescence: Defining a Path Forward
Gorgoulis, V., Adams, P. D., Alimonti, A., Bennett, D. C., Bischof, O., Bishop, C., Campisi, J., Collado, M., Evangelou, K., Ferbeyre, G., et al. (2019) · Cell · doi:10.1016/j.cell.2019.10.005 · Cited by 3,225
Aging, Cellular Senescence, and Cancer
Campisi, J. (2013) · Annual Review of Physiology · doi:10.1146/annurev-physiol-030212-183653 · Cited by 2,954
Naturally occurring p16Ink4a-positive cells shorten healthy lifespan
Baker, D. J., Childs, B. G., Durik, M., Wijers, M. E., Sieben, C. J., Zhong, J., A. Saltness, R., Jeganathan, K. B., Verzosa, G. C., Pezeshki, A., et al. (2016) · Nature · doi:10.1038/nature16932 · Cited by 2,876 · cited 1×
“Senolytic therapy is an emerging therapeutic approach that speci fi cally targets and eliminates senescent cells, which prevents cancer recurrence [12 – 15] as well as extending a healthy lifespan in murine models [16, 17].”
Targeting cancer metabolism in the era of precision oncology
Stine, Z. E., Schug, Z. T., Salvino, J. M., & Dang, C. V. (2022) · Nature Reviews Drug Discovery · doi:10.1038/s41573-021-00339-6 · Cited by 1,189
Cellular senescence and senolytics: the path to the clinic
Chaib, S., Tchkonia, T., & Kirkland, J. L. (2022) · Nature Medicine · doi:10.1038/s41591-022-01923-y · Cited by 1,134
Cellular mechanisms of tumour suppression by the retinoblastoma gene
Burkhart, D. L., & Sage, J. (2008) · Nature Reviews Cancer · doi:10.1038/nrc2399 · Cited by 974
Targeting CDK4 and CDK6: From Discovery to Therapy
Sherr, C. J., Beach, D., & Shapiro, G. I. (2016) · Cancer Discovery · doi:10.1158/2159-8290.cd-15-0894 · Cited by 936
Wilson, W. H., O'Connor, O. A., Czuczman, M. S., LaCasce, A. S., Gerecitano, J. F., Leonard, J. P., Tulpule, A., Dunleavy, K., Xiong, H., Chiu, Y.-L., et al. (2010) · The Lancet Oncology · doi:10.1016/s1470-2045(10)70261-8 · Cited by 876
Senescence and cancer — role and therapeutic opportunities
Schmitt, C. A., Wang, B., & Demaria, M. (2022) · Nature Reviews Clinical Oncology · doi:10.1038/s41571-022-00668-4 · Cited by 794 · cited 1×
“Furthermore, senescent cancer cells can stimulate the growth of neighboring non-cancerous cells such as stromal fi broblasts, potentially contributing to therapy resistance and tumor relapse [9 – 11].”
Schoenwaelder, S. M., Jarman, K. E., Gardiner, E. E., Hua, M., Qiao, J., White, M. J., Josefsson, E. C., Alwis, I., Ono, A., Willcox, A., et al. (2011) · Blood · doi:10.1182/blood-2011-04-347849 · Cited by 351
Senolytics for Cancer Therapy: Is All that Glitters Really Gold?
Carpenter, V. J., Saleh, T., & Gewirtz, D. A. (2021) · Cancers · doi:10.3390/cancers13040723 · Cited by 124
Chemotherapy-induced senescence, an adaptive mechanism driving resistance and tumor heterogeneity
Guillon, J., Petit, C., Toutain, B., Guette, C., Lelièvre, E., & Coqueret, O. (2019) · Cell Cycle · doi:10.1080/15384101.2019.1652047 · Cited by 102
Research works printed but not linked: 44
- McHugh D, Gil J. Senescence and aging: Causes, consequences, and therapeutic avenues. J Cell Biol. 2018;217:65–77. · DOI · Paper page
- Kumari R, Jat P. Mechanisms of Cellular Senescence: Cell Cycle Arrest and Senescence Associated Secretory Phenotype. Front Cell Dev Biol. 2021;9:645593. · DOI · Paper page
- Ruhland MK, Loza AJ, Capietto A-H, Luo X, Knolhoff BL, Flanagan KC, et al. Stromal senescence establishes an immunosuppressive microenvironment that drives tumorigenesis. Nat Commun. 2016;7:11762. · DOI · Paper page
- Mavrogonatou E, Pratsinis H, Kletsas D. The role of senescence in cancer development. Semin Cancer Biol. 2020;62:182–91. · DOI
- Saleh T, Bloukh S, Carpenter VJ, Alwohoush E, Bakeer J, Darwish S, et al. Therapy-Induced Senescence: An “Old” Friend Becomes the Enemy. Cancers. 2020;12:822. · DOI
- Krtolica A, Parrinello S, Lockett S, Desprez P-Y, Campisi J. Senescent fibroblasts promote epithelial cell growth and tumorigenesis: A link between cancer and aging. Proc Natl Acad Sci. 2001;98:12072–7. · DOI · Paper page
- Bhowmick NA, Neilson EG, Moses HL. Stromal fibroblasts in cancer initiation and progression. Nature. 2004;432:332–7. · DOI
- Wang L, Lankhorst L, Bernards R. Exploiting senescence for the treatment of cancer. Nat Rev Cancer. 2022;22:340–55. · DOI · Paper page
- Bousset L, Gil J. Targeting senescence as an anticancer therapy. Mol Oncol. 2022;16:3855–80. · DOI
- Short S, Fielder E, Miwa S, von Zglinicki T. Senolytics and senostatics as adjuvant tumour therapy. EBioMedicine. 2019;41:683–92. · DOI
- Prasanna PG, Citrin DE, Hildesheim J, Ahmed MM, Venkatachalam S, Riscuta G, et al. Therapy-Induced Senescence: Opportunities to Improve Anticancer Therapy. J Natl Cancer Inst. 2021;113:1285–98. · DOI
- van Not OJ, van den Eertwegh AJM, Haanen JB, Blank CU, Aarts MJB, van Breeschoten J, et al. Improving survival in advanced melanoma patients: a trend analysis from 2013 to 2021. EClinicalMedicine. 2024;69:102485. · DOI
- Michielin O, Atkins MB, Koon HB, Dummer R, Ascierto PA. Evolving impact of long-term survival results on metastatic melanoma treatment. J Immunother Cancer. 2020;8:e000948. · DOI
- Lamba N, Ott PA, Iorgulescu JB. Use of First-Line Immune Checkpoint Inhibitors and Association With Overall Survival Among Patients With Metastatic Melanoma in the Anti-PD-1 Era. JAMA Netw Open. 2022;5:e2225459. · DOI
- Malumbres M, Barbacid M. Cell cycle, CDKs and cancer: a changing paradigm. Nat Rev Cancer. 2009;9:153–66. · DOI · Paper page
- Sherr CJ, Roberts JM. CDK inhibitors: positive and negative regulators of G1-phase progression. Genes Dev. 1999;13:1501–12. · DOI · Paper page
- Yoshida A, Bu Y, Qie S, Wrangle J, Camp ER, Hazard ES, et al. SLC36A1-mTORC1 signaling drives acquired resistance to CDK4/6 inhibitors. Sci Adv. 2019;5:eaax6352. · DOI
- Yoshida A, Lee EK, Diehl JA. Induction of Therapeutic Senescence in Vemurafenib-Resistant Melanoma by Extended Inhibition of CDK4/6. Cancer Res. 2016;76:2990–3002. · DOI · Paper page
- Yoshida A, Diehl JA. CDK4/6 inhibitor: from quiescence to senescence. Oncoscience. 2015;2:896–7. · DOI
- Altman BJ, Stine ZE, Dang CV. From Krebs to clinic: glutamine metabolism to cancer therapy. Nat Rev Cancer. 2016;16:619–34. · DOI · Paper page
- Qie S, Yoshida A, Parnham S, Oleinik N, Beeson GC, Beeson CC, et al. Targeting glutamine-addiction and overcoming CDK4/6 inhibitor resistance in human esophageal squamous cell carcinoma. Nat Commun. 2019;10:1296. · DOI
- Wise DR, DeBerardinis RJ, Mancuso A, Sayed N, Zhang XY, Pfeiffer HK, et al. Myc regulates a transcriptional program that stimulates mitochondrial glutaminolysis and leads to glutamine addiction. Proc Natl Acad Sci USA. 2008;105:18782–7. · DOI · Paper page
- Altman BJ, Hsieh AL, Sengupta A, Krishnanaiah SY, Stine ZE, Walton ZE, et al. MYC Disrupts the Circadian Clock and Metabolism in Cancer Cells. Cell Metab. 2015;22:1009–19. · DOI
- Franco J, Balaji U, Freinkman E, Witkiewicz AK, Knudsen ES. Metabolic Reprogramming of Pancreatic Cancer Mediated by CDK4/6 Inhibition Elicits Unique Vulnerabilities. Cell Rep. 2016;14:979–90. · DOI · Paper page
- Santiappillai NT, Abuhammad S, Slater A, Kirby L, McArthur GA, Sheppard KE, et al. CDK4/6 Inhibition Reprograms Mitochondrial Metabolism in BRAFV600 Melanoma via a p53 Dependent Pathway. Cancers. 2021;13:524. · DOI
- Johmura Y, Yamanaka T, Omori S, Wang TW, Sugiura Y, Matsumoto M, et al. Senolysis by glutaminolysis inhibition ameliorates various age-associated disorders. Science. 2021;371:265–70. · DOI · Paper page
- Katt WP, Lukey MJ, Cerione RA. A tale of two glutaminases: homologous enzymes with distinct roles in tumorigenesis. Future Med Chem. 2017;9:223–43. · DOI
- Anders L, Ke N, Hydbring P, Choi YJ, Widlund HR, Chick JM, et al. A systematic screen for CDK4/6 substrates links FOXM1 phosphorylation to senescence suppression in cancer cells. Cancer cell. 2011;20:620–34. · DOI · Paper page
- Ibrahim H, Lee YJ, Curthoys NP. Renal response to metabolic acidosis: role of mRNA stabilization. Kidney Int. 2008;73:11–8. · DOI
- Ince-Dunn G, Okano HJ, Jensen KB, Park WY, Zhong R, Ule J, et al. Neuronal Elav-like (Hu) proteins regulate RNA splicing and abundance to control glutamate levels and neuronal excitability. Neuron. 2012;75:1067–80. · DOI · Paper page
- Schroeder JM, Ibrahim H, Taylor L, Curthoys NP. Role of deadenylation and AUF1 binding in the pH-responsive stabilization of glutaminase mRNA. Am J Physiol Ren Physiol. 2006;290:F733–40. · DOI
- Sullivan RJ, Flaherty KT. Resistance to BRAF-targeted therapy in melanoma. Eur J Cancer. 2013;49:1297–304. · DOI
- Haferkamp S, Borst A, Adam C, Becker TM, Motschenbacher S, Windhövel S, et al. Vemurafenib Induces Senescence Features in Melanoma Cells. J Investigative Dermatol. 2013;133:1601–9. · DOI
- Ascenção CFR, Nagampalli RSK, Islam Z, Pinheiro MP, Menezes dos Reis L, Pauletti BA, et al. N-terminal phosphorylation of glutaminase C decreases its enzymatic activity and cancer cell migration. Biochimie. 2018;154:69–76. · DOI
- Han T, Zhan W, Gan M, Liu F, Yu B, Chin YE, et al. Phosphorylation of glutaminase by PKCϵ is essential for its enzymatic activity and critically contributes to tumorigenesis. Cell Res. 2018;28:655–69. · DOI
- Roberts A, Gandhi L, O’Connor OA, Rudin CM, Khaira D, Xiong H, et al. Reduction in platelet counts as a mechanistic biomarker and guide for adaptive dose-escalation in phase I studies of the Bcl-2 family inhibitor ABT-263. J Clin Oncol. 2008;26:3542. · DOI
- Willobee BA, Gaidarski AA, Dosch AR, Castellanos JA, Dai X, Mehra S, et al. Combined Blockade of MEK and CDK4/6 Pathways Induces Senescence to Improve Survival in Pancreatic Ductal Adenocarcinoma. Mol cancer therapeutics. 2021;20:1246–56. · DOI
- Ruscetti M, Leibold J, Bott MJ, Fennell M, Kulick A, Salgado NR, et al. NK cell-mediated cytotoxicity contributes to tumor control by a cytostatic drug combination. Science. 2018;362:1416–22. · DOI · Paper page
- Nassar KW, Hintzsche JD, Bagby SM, Espinoza V, Langouët-Astrié C, Amato CM, et al. Targeting CDK4/6 Represents a Therapeutic Vulnerability in Acquired BRAF/MEK Inhibitor-Resistant Melanoma. Mol cancer therapeutics. 2021;20:2049–60. · DOI
- Lelliott EJ, Mangiola S, Ramsbottom KM, Zethoven M, Lim L, Lau PKH, et al. Combined BRAF, MEK, and CDK4/6 Inhibition Depletes Intratumoral Immune-Potentiating Myeloid Populations in Melanoma. Cancer Immunol Res. 2021;9:136–46. · DOI
- Martin CA, Cullinane C, Kirby L, Abuhammad S, Lelliott EJ, Waldeck K, et al. Palbociclib synergizes with BRAF and MEK inhibitors in treatment naïve melanoma but not after the development of BRAF inhibitor resistance. Int J cancer. 2018;142:2139–52. · DOI
- Zhao Y, Feng X, Chen Y, Selfridge JE, Gorityala S, Du Z, et al. 5-Fluorouracil Enhances the Antitumor Activity of the Glutaminase Inhibitor CB-839 against PIK3CA-Mutant Colorectal Cancers. Cancer Res. 2020;80:4815–27. · DOI
- Thompson RM, Dytfeld D, Reyes L, Robinson RM, Smith B, Manevich Y, et al. Glutaminase inhibitor CB-839 synergizes with carfilzomib in resistant multiple myeloma cells. Oncotarget. 2017;8:35863–76. · DOI
- Altieri P, Murialdo R, Barisione C, Lazzarini E, Garibaldi S, Fabbi P, et al. 5-fluorouracil causes endothelial cell senescence: potential protective role of glucagon-like peptide 1. Br J Pharmacol. 2017;174:3713–26. · DOI
Cited by
Sorted by citations
Emerging strategies in senotherapeutics: from broad-spectrum senolysis to precision reprogramming
Zhang, W., Song, S., Zhang, Y., Pan, Y., Hu, D., & Wang, Y. (2026) · npj Aging · doi:10.1038/s41514-026-00355-z · Cited by 6
Metadata
- Authors
- Kim, J., Brunetti, B., Kumar, A., Mangla, A., Honda, K., & Yoshida, A.
- Venue
- Cell Death & Disease
- Published
- 2024-12-18
- Volume
- 15
- Issue
- 12
- ISSN
- 2041-4889
- PMC
- PMC11655860
- Cited by
- 16
- References
- 13
- Language
- en
About these checks
Registry, retraction, Cites and statistics results are computed, not judged, with one exception: a printed reference that no index lists is read once by a model before it counts as a citation error. Claims are extracted by a model and kept only when their quote appears verbatim in the text; each cited source is then checked, with a model’s help, for whether it says what the claim relies on. Those verdicts can be wrong — read the claim’s quote and the cited source before relying on one.
Statistics and arithmetic are recomputed, not judged.
Confidence bands are shown only for fields calibrated on our annotated test set. None is calibrated yet, so no band is shown.
What counts as a claim ›How we measure confidence ›How we check this ›
Are you an author, or do you see a problem with this page? Request a review
