

The DOI matches its Crossref record; 28 of the 28 references it cites were found in a registry or an index.
Targeting senescent cells with NKG2D-CAR T cells
Abstract
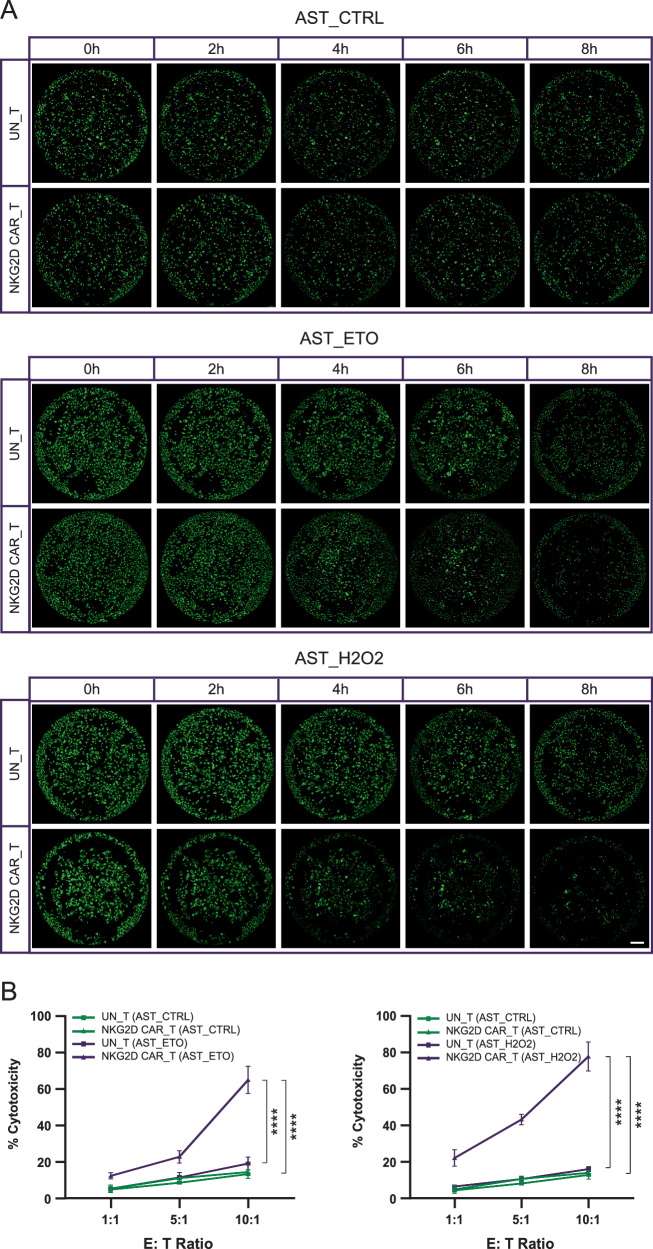
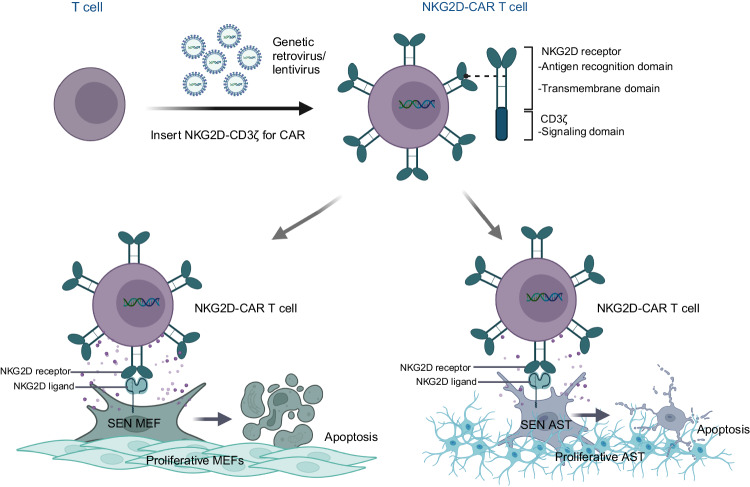
This study investigates the efficacy of NKG2D chimeric antigen receptor (CAR) engineered T cells in targeting and eliminating stress-induced senescent cells in vitro. Cellular senescence contributes to age-related tissue decline and is characterized by permanent cell cycle arrest and the senescence-associated secretory phenotype (SASP). Immunotherapy, particularly CAR-T cell therapy, emerges as a promising approach to selectively eliminate senescent cells. Our focus is on the NKG2D receptor, which binds to ligands (NKG2DLs) upregulated in senescent cells, offering a target for CAR-T cells. Using mouse embryonic fibroblasts (MEFs) and astrocytes (AST) as senescence models, we demonstrate the elevated expression of NKG2DLs in response to genotoxic and oxidative stress. NKG2D-CAR T cells displayed potent cytotoxicity against these senescent cells, with minimal effects on non-senescent cells, suggesting their potential as targeted senolytics. In conclusion, our research presents the first evidence of NKG2D-CAR T cells’ ability to target senescent brain cells, offering a novel approach to manage senescence-associated diseases. The findings pave the way for future investigations into the therapeutic applicability of NKG2D-targeting CAR-T cells in naturally aged organisms and models of aging-associated brain diseases in vivo.
Overview
The claims and statistics of this paper haven’t been checked yet.
Run the check — free, no account needed. It reads the open-access text and checks the sources it cites.
Integrity signals
Registry
Cites
Statistics
Figures
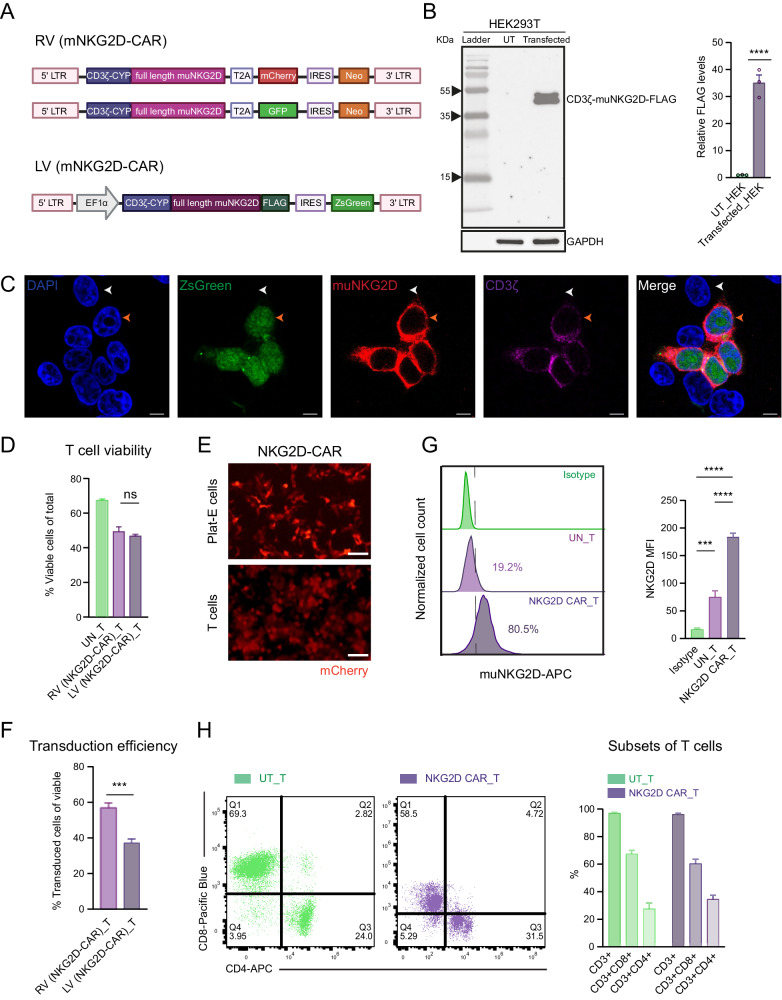
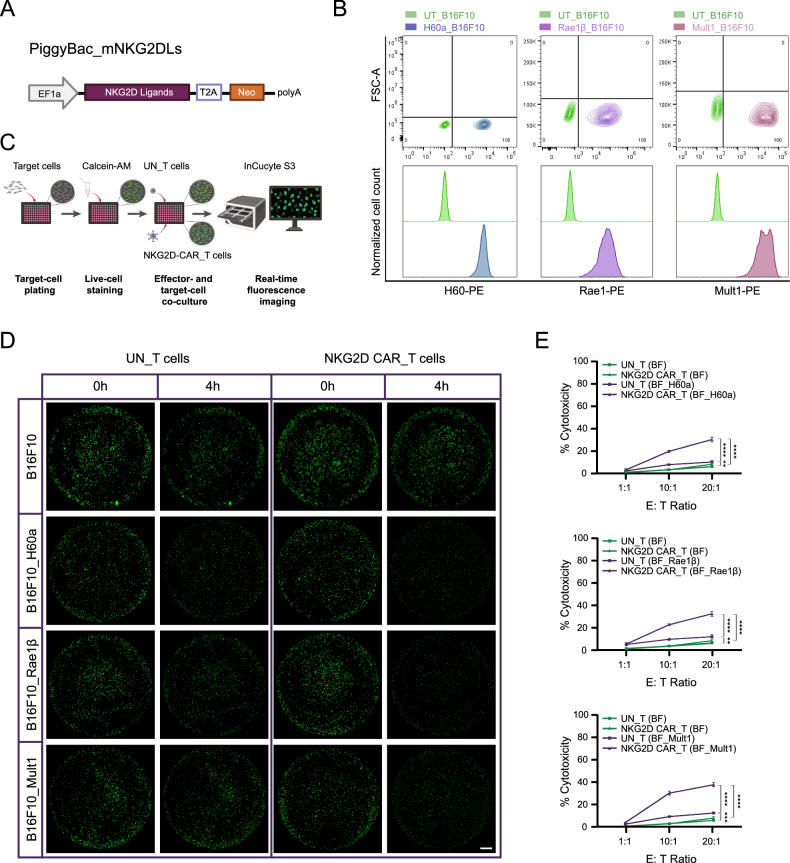
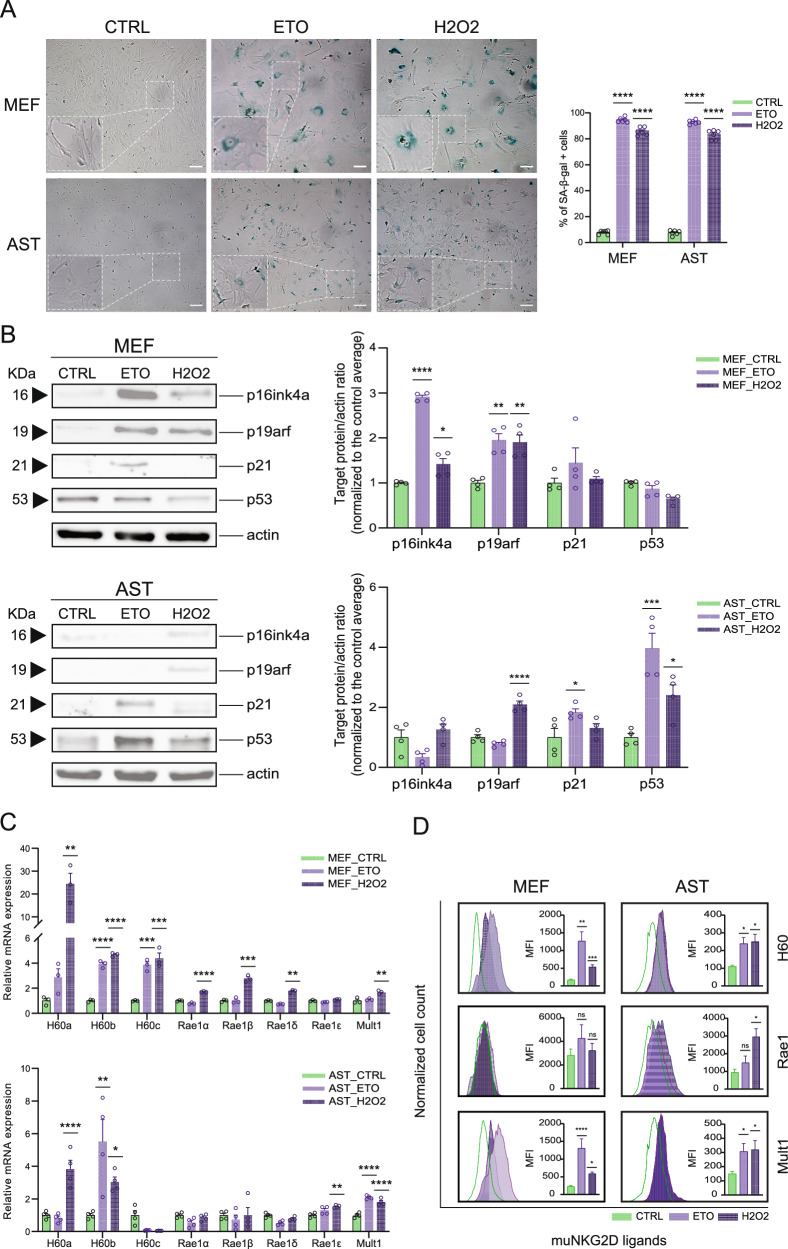
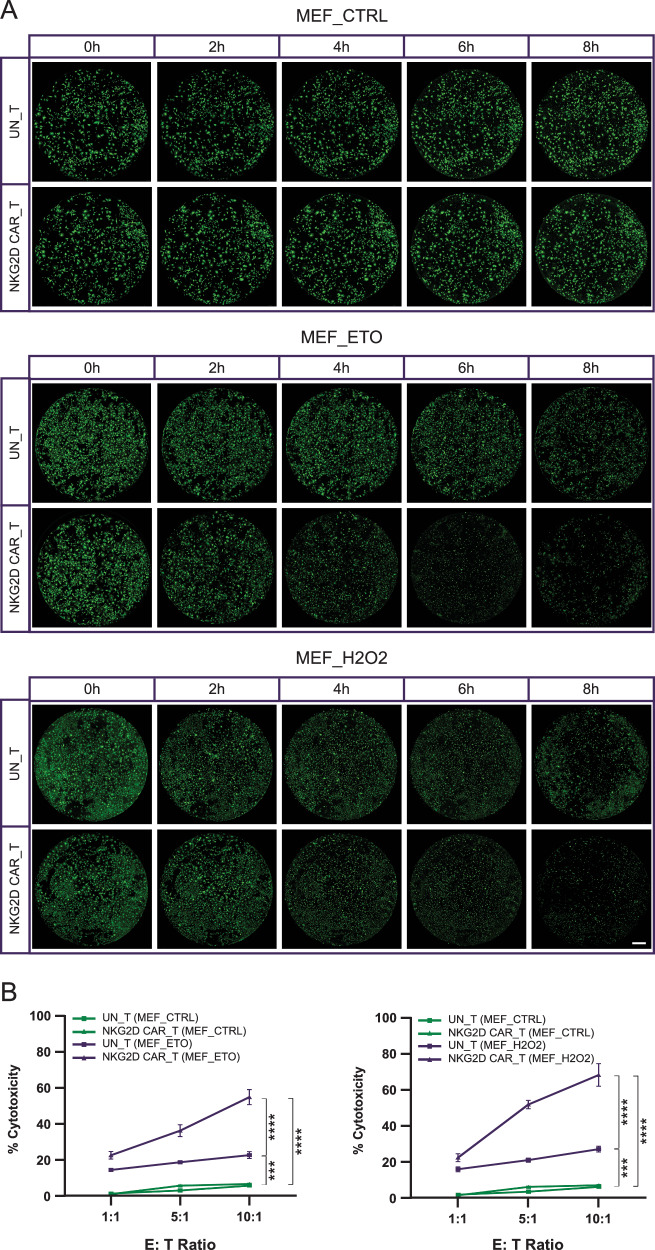
Verification
Claims the paper makes
The claims and statistics of this paper haven’t been checked yet.
Run the check — free, no account needed. It reads the open-access text and checks the sources it cites.
Claims other papers make about this one
Each is checked against this paper’s own text: does it say what the citing paper says it does?
The source backs part of the claim, not all of it — or backs it for a different population, condition or comparison.
In the citing paper
“Genome-wide CRISPR screens and transcriptomic profiling have identified several promising SnC-specific targets, with urokinase-type plasminogen activator receptor (uPAR) emerging as a leading candidate63,64”
From Emerging strategies in senotherapeutics: from broad-spectrum senolysis to precision reprogramming (2026) · cites this paper as [64]
Experimental — accuracy not yet measured
Self-check
Percentages, sums and reported differences re-computed from the paper’s own numbers.
The self-check needs the paper’s full text.
Citations
Cites
Hallmarks of aging: An expanding universe
López-Otín, C., Blasco, M. A., Partridge, L., Serrano, M., & Kroemer, G. (2023) · Cell · doi:10.1016/j.cell.2022.11.001 · Cited by 6,549
Clearance of p16Ink4a-positive senescent cells delays ageing-associated disorders
Baker, D. J., Wijshake, T., Tchkonia, T., LeBrasseur, N. K., Childs, B. G., van de Sluis, B., Kirkland, J. L., & van Deursen, J. M. (2011) · Nature · doi:10.1038/nature10600 · Cited by 3,670 · cited 2×
“Noteworthy extensions of lifespan as well as improvements of aging-associated health outcomes [13], such as atherosclerosis [14], pulmonary dysfunction [15, 16], osteoarthritis [17], and cognitive impairments [18, 19], have been achieved by eliminating senescent cells using genetic or…”
Naturally occurring p16Ink4a-positive cells shorten healthy lifespan
Baker, D. J., Childs, B. G., Durik, M., Wijers, M. E., Sieben, C. J., Zhong, J., A. Saltness, R., Jeganathan, K. B., Verzosa, G. C., Pezeshki, A., et al. (2016) · Nature · doi:10.1038/nature16932 · Cited by 2,876
Cellular senescence in aging and age-related disease: from mechanisms to therapy
Childs, B. G., Durik, M., Baker, D. J., & van Deursen, J. M. (2015) · Nature Medicine · doi:10.1038/nm.4000 · Cited by 2,363
CD19 CAR–T cells of defined CD4+:CD8+ composition in adult B cell ALL patients
Turtle, C. J., Hanafi, L.-A., Berger, C., Gooley, T. A., Cherian, S., Hudecek, M., Sommermeyer, D., Melville, K., Pender, B., Budiarto, T. M., et al. (2016) · Journal of Clinical Investigation · doi:10.1172/jci85309 · Cited by 2,112
Senescence of Activated Stellate Cells Limits Liver Fibrosis
Krizhanovsky, V., Yon, M., Dickins, R. A., Hearn, S., Simon, J., Miething, C., Yee, H., Zender, L., & Lowe, S. W. (2008) · Cell · doi:10.1016/j.cell.2008.09.015 · Cited by 2,027
Cellular senescence and the senescent secretory phenotype: therapeutic opportunities
Tchkonia, T., Zhu, Y., van Deursen, J., Campisi, J., & Kirkland, J. L. (2013) · Journal of Clinical Investigation · doi:10.1172/jci64098 · Cited by 1,774
Cellular senescence mediates fibrotic pulmonary disease
Schafer, M. J., White, T. A., Iijima, K., Haak, A. J., Ligresti, G., Atkinson, E. J., Oberg, A. L., Birch, J., Salmonowicz, H., Zhu, Y., et al. (2017) · Nature Communications · doi:10.1038/ncomms14532 · Cited by 1,613
Jeon, O. H., Kim, C., Laberge, R.-M., Demaria, M., Rathod, S., Vasserot, A. P., Chung, J. W., Kim, D. H., Poon, Y., David, N., et al. (2017) · Nature Medicine · doi:10.1038/nm.4324 · Cited by 1,515 · cited 1×
“…as well as improvements of aging-associated health outcomes [13], such as atherosclerosis [14], pulmonary dysfunction [15, 16], osteoarthritis [17], and cognitive impairments [18, 19], have been achieved by eliminating senescent cells using genetic or pharmaceutical approaches that induce…”
Reversal of human cellular senescence: roles of the p53 and p16 pathways
Beauséjour, C. M., Krtolica, A., Galimi, F., Narita, M., Lowe, S. W., Yaswen, P., & Campisi, J. (2003) · The EMBO Journal · doi:10.1093/emboj/cdg417 · Cited by 1,457
Clearance of senescent glial cells prevents tau-dependent pathology and cognitive decline
Bussian, T. J., Aziz, A., Meyer, C. F., Swenson, B. L., van Deursen, J. M., & Baker, D. J. (2018) · Nature · doi:10.1038/s41586-018-0543-y · Cited by 1,289
Cellular senescence and senolytics: the path to the clinic
Chaib, S., Tchkonia, T., & Kirkland, J. L. (2022) · Nature Medicine · doi:10.1038/s41591-022-01923-y · Cited by 1,134 · cited 3×
“However, existing pharmacological approaches are not speci fi c for senescent cells and are, hence, associated with side effects, which limits their translational potential [21].”
Cellular Senescence in Aging Primates
Herbig, U., Ferreira, M., Condel, L., Carey, D., & Sedivy, J. M. (2006) · Science · doi:10.1126/science.1122446 · Cited by 1,101
Senolytic CAR T cells reverse senescence-associated pathologies
Amor, C., Feucht, J., Leibold, J., Ho, Y.-J., Zhu, C., Alonso-Curbelo, D., Mansilla-Soto, J., Boyer, J. A., Li, X., Giavridis, T., et al. (2020) · Nature · doi:10.1038/s41586-020-2403-9 · Cited by 1,098
Zhang, P., Kishimoto, Y., Grammatikakis, I., Gottimukkala, K., Cutler, R. G., Zhang, S., Abdelmohsen, K., Bohr, V. A., Misra Sen, J., Gorospe, M., et al. (2019) · Nature Neuroscience · doi:10.1038/s41593-019-0372-9 · Cited by 977
Unmasking Transcriptional Heterogeneity in Senescent Cells
Hernandez-Segura, A., de Jong, T. V., Melov, S., Guryev, V., Campisi, J., & Demaria, M. (2017) · Current Biology · doi:10.1016/j.cub.2017.07.033 · Cited by 972 · cited 1×
“Since senescent cells are heterogeneous and their properties are dynamic, identifying broadly expressed senoantigens remains challenging [29, 30].”
Strategies for targeting senescent cells in human disease
Gasek, N. S., Kuchel, G. A., Kirkland, J. L., & Xu, M. (2021) · Nature Aging · doi:10.1038/s43587-021-00121-8 · Cited by 501
Transcriptome signature of cellular senescence
Casella, G., Munk, R., Kim, K. M., Piao, Y., De, S., Abdelmohsen, K., & Gorospe, M. (2019) · Nucleic Acids Research · doi:10.1093/nar/gkz555 · Cited by 359
NKG2D ligands mediate immunosurveillance of senescent cells
Sagiv, A., Burton, D. G. A., Moshayev, Z., Vadai, E., Wensveen, F., Ben-Dor, S., Golani, O., Polic, B., & Krizhanovsky, V. (2016) · Aging · doi:10.18632/aging.100897 · Cited by 345
Suda, M., Shimizu, I., Katsuumi, G., Yoshida, Y., Hayashi, Y., Ikegami, R., Matsumoto, N., Yoshida, Y., Mikawa, R., Katayama, A., et al. (2021) · Nature Aging · doi:10.1038/s43587-021-00151-2 · Cited by 290
Identification of senescent cell surface targetable protein DPP4
Kim, K. M., Noh, J. H., Bodogai, M., Martindale, J. L., Yang, X., Indig, F. E., Basu, S. K., Ohnuma, K., Morimoto, C., Johnson, P. F., et al. (2017) · Genes & Development · doi:10.1101/gad.302570.117 · Cited by 270
Gaikwad, S., Puangmalai, N., Bittar, A., Montalbano, M., Garcia, S., McAllen, S., Bhatt, N., Sonawane, M., Sengupta, U., & Kayed, R. (2021) · Cell Reports · doi:10.1016/j.celrep.2021.109419 · Cited by 234
Glioblastoma-targeted CD4+ CAR T cells mediate superior antitumor activity
Wang, D., Aguilar, B., Starr, R., Alizadeh, D., Brito, A., Sarkissian, A., Ostberg, J. R., Forman, S. J., & Brown, C. E. (2018) · JCI Insight · doi:10.1172/jci.insight.99048 · Cited by 233
Immunosurveillance of senescent cells: the bright side of the senescence program
Sagiv, A., & Krizhanovsky, V. (2013) · Biogerontology · doi:10.1007/s10522-013-9473-0 · Cited by 208
Stress-induced senescence in human and rodent astrocytes
Bitto, A., Sell, C., Crowe, E., Lorenzini, A., Malaguti, M., Hrelia, S., & Torres, C. (2010) · Experimental Cell Research · doi:10.1016/j.yexcr.2010.06.021 · Cited by 204
Immune Clearance of Senescent Cells to Combat Ageing and Chronic Diseases
Song, P., An, J., & Zou, M.-H. (2020) · Cells · doi:10.3390/cells9030671 · Cited by 198
Elimination of p19ARF-expressing cells enhances pulmonary function in mice
Hashimoto, M., Asai, A., Kawagishi, H., Mikawa, R., Iwashita, Y., Kanayama, K., Sugimoto, K., Sato, T., Maruyama, M., & Sugimoto, M. (2016) · JCI Insight · doi:10.1172/jci.insight.87732 · Cited by 162
Engineering better chimeric antigen receptor T cells
Zhang, H., Zhao, P., & Huang, H. (2020) · Experimental Hematology & Oncology · doi:10.1186/s40164-020-00190-2 · Cited by 93
Research works printed but not linked: 50
- Hayflick L, Moorhead PS. The serial cultivation of human diploid cell strains. Exp Cell Res. 1961;25:585–621. · DOI · Paper page
- Kuilman T, Michaloglou C, Mooi WJ, Peeper DS. The essence of senescence. Genes Dev. 2010;24:2463–79. · DOI · Paper page
- Wiley CD, Campisi J. The metabolic roots of senescence: mechanisms and opportunities for intervention. Nat Metab. 2021;3:1290–301. · DOI · Paper page
- Coppé JP, Desprez PY, Krtolica A, Campisi J. The senescence-associated secretory phenotype: the dark side of tumor suppression. Annu Rev Pathol. 2010;5:99–118. · DOI · Paper page
- Dimri GP, Lee X, Basile G, Acosta M, Scott G, Roskelley C, et al. A biomarker that identifies senescent human cells in culture and in aging skin in vivo. Proc Natl Acad Sci USA. 1995;92:9363–7. · DOI · Paper page
- Hasegawa T, Oka T, Son HG, Oliver-García VS, Azin M, Eisenhaure TM, et al. Cytotoxic CD4+ T cells eliminate senescent cells by targeting cytomegalovirus antigen. Cell. 2023;186:1417–31.e20. · DOI
- Jeyapalan JC, Ferreira M, Sedivy JM, Herbig U. Accumulation of senescent cells in mitotic tissue of aging primates. Mech Ageing Dev. 2007;128:36–44. · DOI · Paper page
- Wang C, Jurk D, Maddick M, Nelson G, Martin-Ruiz C, von Zglinicki T. DNA damage response and cellular senescence in tissues of aging mice. Aging Cell. 2009;8:311–23. · DOI · Paper page
- Roos CM, Zhang B, Palmer AK, Ogrodnik MB, Pirtskhalava T, Thalji NM, et al. Chronic senolytic treatment alleviates established vasomotor dysfunction in aged or atherosclerotic mice. Aging Cell. 2016;15:973–7. · DOI · Paper page
- Zhang L, Pitcher LE, Prahalad V, Niedernhofer LJ, Robbins PD. Targeting cellular senescence with senotherapeutics: senolytics and senomorphics. FEBS J. 2023;290:1362–83. · DOI
- Poblocka M, Bassey AL, Smith VM, Falcicchio M, Manso AS, Althubiti M, et al. Targeted clearance of senescent cells using an antibody-drug conjugate against a specific membrane marker. Sci Rep. 2021;11:20358. · DOI · Paper page
- Ovadya Y, Landsberger T, Leins H, Vadai E, Gal H, Biran A, et al. Impaired immune surveillance accelerates accumulation of senescent cells and aging. Nat Commun. 2018;9:5435. · DOI · Paper page
- Baker DJ, Arany Z, Baur JA, Epstein JA, June CH. CAR T therapy beyond cancer: the evolution of a living drug. Nature. 2023;619:707–15. · DOI
- Prajapati K, Perez C, Rojas LBP, Burke B, Guevara-Patino JA. Functions of NKG2D in CD8+ T cells: an opportunity for immunotherapy. Cell Mol Immunol. 2018;15:470–9. · DOI
- González S, López-Soto A, Suarez-Alvarez B, López-Vázquez A, López-Larrea C. NKG2D ligands: key targets of the immune response. Trends Immunol. 2008;29:397–403. · DOI
- Kim TW, Kim HJ, Lee C, Kim HY, Baek SH, Kim JH, et al. Identification of replicative senescence-associated genes in human umbilical vein endothelial cells by an annealing control primer system. Exp Gerontol. 2008;43:286–95. https://pubmed.ncbi.nlm.nih.gov/18258400/. · DOI
- Soriani A, Zingoni A, Cerboni C, Iannitto ML, Ricciardi MR, Di Gialleonardo V, et al. ATM-ATR-dependent up-regulation of DNAM-1 and NKG2D ligands on multiple myeloma cells by therapeutic agents results in enhanced NK-cell susceptibility and is associated with a senescent phenotype. Blood. 2009;113:3503–11. https://pubmed.ncbi.nlm.nih.gov/19098271/. · DOI · Paper page
- Yang D, Sun B, Li S, Wei W, Liu X, Cui X, et al. NKG2D-CAR T cells eliminate senescent cells in aged mice and nonhuman primates. Sci Transl Med. 2023;15:eadd1951. · DOI · Paper page
- Zhang T, Lemoi BA, Sentman CL. Chimeric NK-receptor-bearing T cells mediate antitumor immunotherapy. Blood. 2005;106:1544–51. · DOI
- Driouk L, Gicobi JK, Kamihara Y, Rutherford K, Dranoff G, Ritz J, et al. Chimeric antigen receptor T cells targeting NKG2D-ligands show robust efficacy against acute myeloid leukemia and T-cell acute lymphoblastic leukemia. Front Immunol. 2020;11:580328. Available from: https://pubmed.ncbi.nlm.nih.gov/33384686/. · DOI
- Shin JH, Zhang L, Murillo-Sauca O, Kim J, Kohrt HEK, Bui JD, et al. Modulation of natural killer cell antitumor activity by the aryl hydrocarbon receptor. Proc Natl Acad Sci USA. 2013;110:12391–6. · DOI
- Kim Y, Born C, Bléry M, Steinle A. MICAgen mice recapitulate the highly restricted but activation-inducible expression of the paradigmatic human NKG2D Ligand MICA. Front Immunol. 2020;11:960. · DOI
- Watanabe K, Kuramitsu S, Posey AD, June CH. Expanding the therapeutic window for CAR T cell therapy in solid tumors: the knowns and unknowns of CAR T cell biology. Front Immunol. 2018;9:2486. · DOI
- Anderson KG, Stromnes IM, Greenberg PD. Obstacles posed by the tumor microenvironment to T cell activity: a case for synergistic therapies. Cancer Cell. 2017;31:311–25. · DOI
- Pellegatta S, Savoldo B, Di Ianni N, Corbetta C, Chen Y, Patané M, et al. Constitutive and TNFα-inducible expression of chondroitin sulfate proteoglycan 4 in glioblastoma and neurospheres: implications for CAR-T cell therapy. Sci Transl Med. 2018;10:eaao2731. Available from: https://pubmed.ncbi.nlm.nih.gov/29491184/. · DOI
- Feucht J, Abou-El-Enein M. Senolytic CAR T cells in solid tumors and age-related pathologies. Mol Ther. 2020;28:2108–10. · DOI
- Gacerez AT, Arellano B, Sentman CL. How chimeric antigen receptor design affects adoptive T cell therapy. J Cell Physiol. 2016;231:2590–8. · DOI
- Raulet DH. Roles of the NKG2D immunoreceptor and its ligands. Nat Rev Immunol. 2003;3:781–90. Available from: https://pubmed.ncbi.nlm.nih.gov/14523385/. · DOI
- Barber A, Sentman CL. NKG2D receptor regulates human effector T-cell cytokine production. Blood. 2011;117:6571–81. · DOI
- Weiss T, Weller M, Guckenberger M, Sentman CL, Roth P. NKG2D-based CAR T cells and radiotherapy exert synergistic efficacy in glioblastoma. Cancer Res. 2018;78:1031–43. · DOI
- Groh V, Bahram S, Bauer S, Herman A, Beauchamp M, Spies T. Cell stress-regulated human major histocompatibility complex class I gene expressed in gastrointestinal epithelium. Proc Natl Acad Sci USA. 1996;93:12445–50. · DOI
- Carayannopoulos LN, Naidenko OV, Fremont DH, Yokoyama WM. Cutting edge: murine UL16-binding protein-like transcript 1: a newly described transcript encoding a high-affinity ligand for murine NKG2D. J Immunol. 2002;169:4079–83. · DOI
- VanSeggelen H, Hammill JA, Dvorkin-Gheva A, Tantalo DGM, Kwiecien JM, Denisova GF, et al. T cells engineered with chimeric antigen receptors targeting NKG2D ligands display lethal toxicity in mice. Mol Ther. 2015;23:1600–10. · DOI
- Curio S, Jonsson G, Marinović S. A summary of current NKG2D-based CAR clinical trials. Immunother Adv. 2021;1:ltab018. https://pubmed.ncbi.nlm.nih.gov/34604863/. · DOI
- García-Cáceres C, Balland E, Prevot V, Luquet S, Woods SC, Koch M, et al. Role of astrocytes, microglia, and tanycytes in brain control of systemic metabolism. Nat Neurosci. 2019;22:7–14. · DOI
- Matias I, Diniz LP, Damico IV, Araujo APB, Neves LdaS, Vargas G, et al. Loss of lamin-B1 and defective nuclear morphology are hallmarks of astrocyte senescence in vitro and in the aging human hippocampus. Aging Cell. 2022;21:e13521. · DOI · Paper page
- Souza DG, Bellaver B, Souza DO, Quincozes-Santos A. Characterization of adult rat astrocyte cultures. PLoS One. 2013;8:e60282. · DOI
- Wang B, Wang L, Gasek NS, Zhou Y, Kim T, Guo C, et al. An inducible p21-Cre mouse model to monitor and manipulate p21-highly-expressing senescent cells in vivo. Nat Aging. 2021;1:962–73. · DOI · Paper page
- Bang M, Kim DG, Gonzales EL, Kwon KJ, Shin CY. Etoposide induces mitochondrial dysfunction and cellular senescence in primary cultured rat astrocytes. Biomol Ther. 2019;27:530–9. · DOI
- Fernández L, Metais JY, Escudero A, Vela M, Valentín J, Vallcorba I, et al. Memory T cells expressing an NKG2D-CAR efficiently target osteosarcoma cells. Clin Cancer Res. 2017;23:5824–35. · DOI · Paper page
- Zarei M, Abdoli S, Farazmandfar T, Shahbazi M. Lenalidomide improves NKG2D-based CAR-T cell activity against colorectal cancer cells invitro. Heliyon. 2023;9:e20460. · DOI
- Hanson KM, Finkelstein JN. An accessible and high-throughput strategy of continuously monitoring apoptosis by fluorescent detection of caspase activation. Anal Biochem. 2019;564–565:96–101. · DOI
- Ibáñez-Navarro M, Fernández A, Escudero A, Esteso G, Campos-Silva C, Navarro-Aguadero MÁ, et al. NKG2D-CAR memory T cells target pediatric T-cell acute lymphoblastic leukemia in vitro and in vivo but fail to eliminate leukemia initiating cells. Front Immunol. 2023;14:1187665. · DOI
- Zingoni A, Molfetta R, Fionda C, Soriani A, Paolini R, Cippitelli M, et al. NKG2D and its ligands: ‘one for all, all for one. Front Immunol. 2018;9:476. · DOI
- Agarwal S, Hanauer JDS, Frank AM, Riechert V, Thalheimer FB, Buchholz CJ. In vivo generation of CAR T cells selectively in human CD4+ lymphocytes. Mol Ther. 2020;28:1783–94. · DOI
- Liadi I, Singh H, Romain G, Rey-Villamizar N, Merouane A, Adolacion JRT, et al. Individual motile CD4(+) T cells can participate in efficient multikilling through conjugation to multiple tumor cells. Cancer Immunol Res. 2015;3:473–82. · DOI
- Liadi I, Singh H, Romain G, Roysam B, Cooper LJ, Varadarajan N. Defining potency of CAR+ T cells: fast and furious or slow and steady. Oncoimmunology. 2019;8:e1051298. · DOI
- Sommermeyer D, Hudecek M, Kosasih PL, Gogishvili T, Maloney DG, Turtle CJ, et al. Chimeric antigen receptor-modified T cells derived from defined CD8+ and CD4+ subsets confer superior antitumor reactivity in vivo. Leukemia. 2016;30:492–500. · DOI
- Jain K, Verma PJ, Liu J. Isolation and handling of mouse embryonic fibroblasts. Methods Mol Biol. 2014;1194:247–52. · DOI
- Schildge S, Bohrer C, Beck K, Schachtrup C. Isolation and culture of mouse cortical astrocytes. J Vis Exp. 2013;71:50079.
Cited by
Sorted by citations
Emerging strategies in senotherapeutics: from broad-spectrum senolysis to precision reprogramming
Zhang, W., Song, S., Zhang, Y., Pan, Y., Hu, D., & Wang, Y. (2026) · npj Aging · doi:10.1038/s41514-026-00355-z · Cited by 6
Metadata
- Authors
- Deng, Y., Kumar, A., Xie, K., Schaaf, K., Scifo, E., Morsy, S., Li, T., Ehninger, A., Bano, D., & Ehninger, D.
- Venue
- Cell Death Discovery
- Published
- 2024-05-04
- Volume
- 10
- Issue
- 1
- ISSN
- 2058-7716
- PMC
- PMC11069534
- Cited by
- 75
- References
- 28
- Language
- en
About these checks
Registry, retraction, Cites and statistics results are computed, not judged, with one exception: a printed reference that no index lists is read once by a model before it counts as a citation error. Claims are extracted by a model and kept only when their quote appears verbatim in the text; each cited source is then checked, with a model’s help, for whether it says what the claim relies on. Those verdicts can be wrong — read the claim’s quote and the cited source before relying on one.
Statistics and arithmetic are recomputed, not judged.
Confidence bands are shown only for fields calibrated on our annotated test set. None is calibrated yet, so no band is shown.
What counts as a claim ›How we measure confidence ›How we check this ›
Are you an author, or do you see a problem with this page? Request a review
