Cited by 40

The DOI matches its Crossref record; 6 of the 6 references it cites were found in a registry or an index.

Disruption of the C/EBPα—miR-182 balance impairs granulocytic differentiation

Wurm, Alexander Arthur, Zjablovskaja, Polina, Kardosova, Miroslava, Gerloff, Dennis, Bräuer-Hartmann, Daniela, Katzerke, Christiane, Hartmann, Jens-Uwe, Benoukraf, Touati, Fricke, Stephan, Hilger, Nadja, Müller, Anne-Marie, Bill, Marius, Schwind, Sebastian, Tenen, Daniel G., Niederwieser, Dietger, Alberich-Jorda, Meritxell, Behre, Gerhard·2017·Nature Communications

Abstract

Transcription factor C/EBPα is a master regulator of myelopoiesis and its inactivation is associated with acute myeloid leukemia. Deregulation of C/EBPα by microRNAs during granulopoiesis or acute myeloid leukemia development has not been studied. Here we show that oncogenic miR-182 is a strong regulator of C/EBPα. Moreover, we identify a regulatory loop between C/EBPα and miR-182. While C/EBPα blocks miR-182 expression by direct promoter binding during myeloid differentiation, enforced expression of miR-182 reduces C/EBPα protein level and impairs granulopoiesis in vitro and in vivo. In addition, miR-182 expression is highly elevated particularly in acute myeloid leukemia patients with C-terminal CEBPA mutations, thereby depicting a mechanism by which C/EBPα blocks miR-182 expression. Furthermore, we present miR-182 expression as a prognostic marker in cytogenetically high-risk acute myeloid leukemia patients. Our data demonstrate the importance of a controlled balance between C/EBPα and miR-182 for the maintenance of healthy granulopoiesis.

Overview

The claims and statistics of this paper haven’t been checked yet.

Run the check — free, no account needed. It reads the open-access text and checks the sources it cites.

A few free checks a day · papers already verified open instantly · results are public

Integrity signals

Registry

Crossref · 10.1038/s41467-017-00032-6

Cites

6 of 6 references verified0 citation errors · 0 not checkable

Statistics

Figures

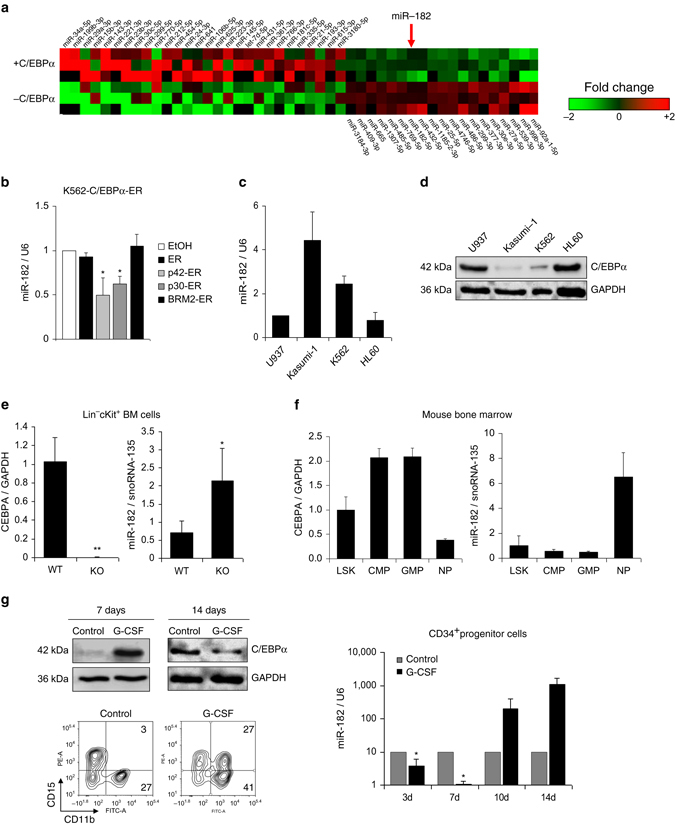
Fig. 1 C/EBPα blocks miR-182 expression and both factors correlate inversely. a Next Generation Sequencing (NGS) for small RNAs in inducible K562-C/EBPα-ER cells revealed several miRNAs upregulated and downregulated by C/EBPα. MiR-182 is highlighted in bold (red arrow). Data summarize three independent experiments, while each colored box marks the relative expression of the indicated miRNA in comparison to the appropriate mean of each experiment. Red represents high fold change and green low fold change. b QPCR for miR-182 expression showed downregulation of miR-182 after induction of wild-type C/EBPα-p42 in K562-C/EBPα-ER cells. Induction of N-terminal mutant C/EBPα-p30, but not C-terminal mutant C/EBPα-BRM2 or control ER resulted in reduced miR-182 expression levels. Ethanol served as vehicle control. Cells were collected after treatment with β-estradiol for 6 h. Data represent the mean ± SD of three independent experiments (*p < 0.05). P values were calculated using unpaired Student’s t-test. c and d Relative expression levels of miR-182 were analyzed by qPCR c and correlate inversely to the protein amount of C/EBPα d in indicated leukemic cell lines, as analyzed by western blot. e Induced knockout of CEBPA by injection of pI:pC in CEBPA f/fMx1Cre+ mice led to reduced CEBPA mRNA levels compared to pI:pC injected CEBPA f/f fMx1Cre− mice and resulted in an upregulation of miR-182 in lineage−/c-Kit+ myeloid progenitor cells. Expression was measured using qPCR and quantified compared to the mean of all animals. Data represent the mean ± SD of four animals (**p < 0.01). P values were calculated using unpaired Student’s t-test. f Relative expression levels of miR-182 and CEBPA in sorted murine bone marrow subpopulations. LSK—Lineage−Sca-1+cKit+ myeloid progenitors, CMP—common myeloid progenitors, GMP—granulocyte-macrophage progenitor, NP—neutrophils. g Treatment of human CD34+ hematopoietic progenitor cells with G-CSF in vitro led to a rapid decrease of miR-182 expression and correlated inversely to C/EBPα protein levels. C/EBPα protein level was analyzed using western blot (left side, upper panel). The stage of differentiation was shown by flow cytometry after 14 days (left side, lower panel). MiR-182 expression was measured using qPCR (right panel). Normalization for miR-182 expression was done using U6 (human samples) or snoRNA-135 (mouse samples). For CEBPA expression normalization, GAPDH was used. Data represent the mean ± SD of three independent experiments (*p < 0.05). P-values were calculated using unpaired Student’s t-test
Fig. 1 C/EBPα blocks miR-182 expression and both factors correlate inversely. a Next Generation Sequencing (NGS) for small RNAs in inducible K562-C/EBPα-ER cells revealed several miRNAs upregulated and downregulated by C/EBPα. MiR-182 is highlighted in bold (red arrow). Data summarize three independent experiments, while each colored box marks the relative expression of the indicated miRNA in comparison to the appropriate mean of each experiment. Red represents high fold change and green low fold change. b QPCR for miR-182 expression showed downregulation of miR-182 after induction of wild-type C/EBPα-p42 in K562-C/EBPα-ER cells. Induction of N-terminal mutant C/EBPα-p30, but not C-terminal mutant C/EBPα-BRM2 or control ER resulted in reduced miR-182 expression levels. Ethanol served as vehicle control. Cells were collected after treatment with β-estradiol for 6 h. Data represent the mean ± SD of three independent experiments (*p < 0.05). P values were calculated using unpaired Student’s t-test. c and d Relative expression levels of miR-182 were analyzed by qPCR c and correlate inversely to the protein amount of C/EBPα d in indicated leukemic cell lines, as analyzed by western blot. e Induced knockout of CEBPA by injection of pI:pC in CEBPA f/fMx1Cre+ mice led to reduced CEBPA mRNA levels compared to pI:pC injected CEBPA f/f fMx1Cre− mice and resulted in an upregulation of miR-182 in lineage−/c-Kit+ myeloid progenitor cells. Expression was measured using qPCR and quantified compared to the mean of all animals. Data represent the mean ± SD of four animals (**p < 0.01). P values were calculated using unpaired Student’s t-test. f Relative expression levels of miR-182 and CEBPA in sorted murine bone marrow subpopulations. LSK—Lineage−Sca-1+cKit+ myeloid progenitors, CMP—common myeloid progenitors, GMP—granulocyte-macrophage progenitor, NP—neutrophils. g Treatment of human CD34+ hematopoietic progenitor cells with G-CSF in vitro led to a rapid decrease of miR-182 expression and correlated inversely to C/EBPα protein levels. C/EBPα protein level was analyzed using western blot (left side, upper panel). The stage of differentiation was shown by flow cytometry after 14 days (left side, lower panel). MiR-182 expression was measured using qPCR (right panel). Normalization for miR-182 expression was done using U6 (human samples) or snoRNA-135 (mouse samples). For CEBPA expression normalization, GAPDH was used. Data represent the mean ± SD of three independent experiments (*p < 0.05). P-values were calculated using unpaired Student’s t-testCC BY · PubMed Central
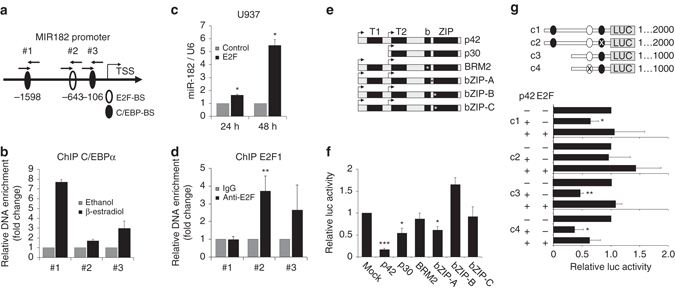
Fig. 2 MiR-182 expression is blocked by C/EBPα p42. a Schematic overview about the minimal MIR182 promoter region. b ChIP assay in K562-C/EBPα-ER cells revealed a binding of C/EBPα to both distal (#1) and proximal (#3) C/EBP binding sites. Analysis was calculated as a ratio between β-estradiol and ethanol treated cells. Data represent the mean ± SD of two independent experiments. c Transient overexpression of E2F1 in U937 cells leads to enhanced miR-182 expression levels at the indicated time points. Expression was measured using qPCR. Data represent the mean ± SD of three independent experiments (*p < 0.05). P values were calculated using unpaired Student’s t-test. d ChIP assay in K562-C/EBPα-ER cells showed a binding of E2F1 predominantly in the region of the predicted E2F binding site (#2). Data represent the mean ± SD of four independent experiments. (**p < 0.01). P values were calculated using unpaired Student’s t-test. e Schematic representation of different C/EBPα mutant forms used for luciferase assay. P42 represents the wild-type, p30 the N-terminal truncated mutant. BRM2 represents a point mutation in the E2F interaction domain at amino acids 294 and 297. The other mutants are insertions in the bZIP domain: bZIP-A (R300-D301 del—ins QN), bZIP-B (dupl. K313) and bZIP-C (dupl. K312). The asterisks mark the region of the point mutation. f Luciferase assay with full length MIR182 minimal promoter showed significantly reduced luciferase activity after C/EBPα-p42, C/EBPα-p30 and bZIP-mutant-A, but not C/EBPα-BRM2, bZIP-mutant-B and bZIP-mutant-C overexpression. g Effects of C/EBPα p42 and E2F on luciferase activity can be abolished using specific point mutations in the indicated binding sites. Luciferase activity was measured using different indicated MIR182 promoter constructs including mutations in the proximal C/EBP site (c2) and the E2F site (c4). Black circles highlight C/EBP binding sites and white circle the E2F site. Co-expression of E2F1 can partially rescue the effect of C/EBPα on promoter luciferase activity. Activity was normalized to pGL3-control. All luciferase experiments were normalized to transfection with equal amounts of pcDNA3.1 empty vector (backbone of all C/EBPα constructs and E2F). Renilla luciferase (pRL) served as internal normalization control. Data represent the mean ± SD of three independent experiments (*p < 0.05; **p < 0.01; ***p < 0.001). P values were calculated using unpaired Student’s t-test
Fig. 2 MiR-182 expression is blocked by C/EBPα p42. a Schematic overview about the minimal MIR182 promoter region. b ChIP assay in K562-C/EBPα-ER cells revealed a binding of C/EBPα to both distal (#1) and proximal (#3) C/EBP binding sites. Analysis was calculated as a ratio between β-estradiol and ethanol treated cells. Data represent the mean ± SD of two independent experiments. c Transient overexpression of E2F1 in U937 cells leads to enhanced miR-182 expression levels at the indicated time points. Expression was measured using qPCR. Data represent the mean ± SD of three independent experiments (*p < 0.05). P values were calculated using unpaired Student’s t-test. d ChIP assay in K562-C/EBPα-ER cells showed a binding of E2F1 predominantly in the region of the predicted E2F binding site (#2). Data represent the mean ± SD of four independent experiments. (**p < 0.01). P values were calculated using unpaired Student’s t-test. e Schematic representation of different C/EBPα mutant forms used for luciferase assay. P42 represents the wild-type, p30 the N-terminal truncated mutant. BRM2 represents a point mutation in the E2F interaction domain at amino acids 294 and 297. The other mutants are insertions in the bZIP domain: bZIP-A (R300-D301 del—ins QN), bZIP-B (dupl. K313) and bZIP-C (dupl. K312). The asterisks mark the region of the point mutation. f Luciferase assay with full length MIR182 minimal promoter showed significantly reduced luciferase activity after C/EBPα-p42, C/EBPα-p30 and bZIP-mutant-A, but not C/EBPα-BRM2, bZIP-mutant-B and bZIP-mutant-C overexpression. g Effects of C/EBPα p42 and E2F on luciferase activity can be abolished using specific point mutations in the indicated binding sites. Luciferase activity was measured using different indicated MIR182 promoter constructs including mutations in the proximal C/EBP site (c2) and the E2F site (c4). Black circles highlight C/EBP binding sites and white circle the E2F site. Co-expression of E2F1 can partially rescue the effect of C/EBPα on promoter luciferase activity. Activity was normalized to pGL3-control. All luciferase experiments were normalized to transfection with equal amounts of pcDNA3.1 empty vector (backbone of all C/EBPα constructs and E2F). Renilla luciferase (pRL) served as internal normalization control. Data represent the mean ± SD of three independent experiments (*p < 0.05; **p < 0.01; ***p < 0.001). P values were calculated using unpaired Student’s t-testCC BY · PubMed Central
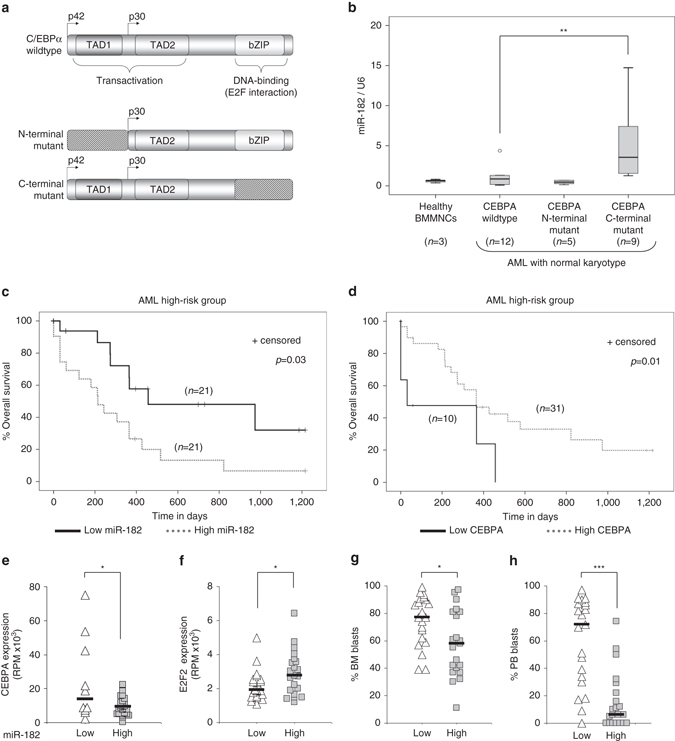
Fig. 3 MiR-182 expression defines a subgroup of AML. a Schematic representation of different types of C/EBPα found in AML. b Relative expression of miR-182 in samples derived from bone marrow mononuclear cells (BMMNCs) of healthy donors (n = 3) or normal karyotype AML patients with either CEBPA wild-type (n = 12), CEBPA N-terminal mutation (n = 5) or CEBPA C-terminal mutation (n = 9). MiR-182 expression was elevated only in AML patients carrying a mutation in the C-terminal region of the CEBPA gene. Normalization was done using U6 and compared to the mean of all patient samples (** p< 0.01). P values were calculated using Mann-Whitney-U test. c Overall survival of high-risk AML patients according to the median divided miR-182 expression. P values were calculated using Log-rank test. d Overall survival of according to the CEBPA expression. Expression quartiles were created and the group with the lowest CEBPA expression (first quartile) was compared to the rest (second, third and fourth quartile). The only existing CEBPA mutated patient (ID2952) was excluded from the analysis. P values were calculated using Log-rank test. e Correlation between miR-182 and CEBPA expression in high-risk AML. Groups were divided into four quartiles according to the miR-182 expression. The low group represents the first quartile with the lowest expression levels of miR-182, while the high group combines the rest. Low miR-182 expressing patients showed significantly higher CEBPA levels (n = 41, *p < 0.05). P values were calculated using unpaired Student’s t-test. f Correlation between miR-182 and E2F2 expression in high-risk AML. Groups were divided according to the median miR-182 expression. High miR-182 expressing patients showed significantly higher E2F2 levels. (n = 42, *p < 0.05). P values were calculated using unpaired Student’s t-test. g Correlation between miR-182 expression and percentage of bone marrow blasts in the high-risk AML patient set. Groups were divided according to the median miR-182 expression. High miR-182 expressing patients showed significantly lower bone marrow blast counts. (n = 42, *p < 0.05). P-values were calculated using unpaired Student’s t-test. h Correlation between miR-182 and percentage of peripheral blood blasts in the high-risk AML patient set. Groups were divided according to the median miR-182 expression. High miR-182 expressing patients showed significantly lower peripheral blood blast counts. (n = 42, ***p < 0.001). P values were calculated using unpaired Student’s t-test
Fig. 3 MiR-182 expression defines a subgroup of AML. a Schematic representation of different types of C/EBPα found in AML. b Relative expression of miR-182 in samples derived from bone marrow mononuclear cells (BMMNCs) of healthy donors (n = 3) or normal karyotype AML patients with either CEBPA wild-type (n = 12), CEBPA N-terminal mutation (n = 5) or CEBPA C-terminal mutation (n = 9). MiR-182 expression was elevated only in AML patients carrying a mutation in the C-terminal region of the CEBPA gene. Normalization was done using U6 and compared to the mean of all patient samples (** p< 0.01). P values were calculated using Mann-Whitney-U test. c Overall survival of high-risk AML patients according to the median divided miR-182 expression. P values were calculated using Log-rank test. d Overall survival of according to the CEBPA expression. Expression quartiles were created and the group with the lowest CEBPA expression (first quartile) was compared to the rest (second, third and fourth quartile). The only existing CEBPA mutated patient (ID2952) was excluded from the analysis. P values were calculated using Log-rank test. e Correlation between miR-182 and CEBPA expression in high-risk AML. Groups were divided into four quartiles according to the miR-182 expression. The low group represents the first quartile with the lowest expression levels of miR-182, while the high group combines the rest. Low miR-182 expressing patients showed significantly higher CEBPA levels (n = 41, *p < 0.05). P values were calculated using unpaired Student’s t-test. f Correlation between miR-182 and E2F2 expression in high-risk AML. Groups were divided according to the median miR-182 expression. High miR-182 expressing patients showed significantly higher E2F2 levels. (n = 42, *p < 0.05). P values were calculated using unpaired Student’s t-test. g Correlation between miR-182 expression and percentage of bone marrow blasts in the high-risk AML patient set. Groups were divided according to the median miR-182 expression. High miR-182 expressing patients showed significantly lower bone marrow blast counts. (n = 42, *p < 0.05). P-values were calculated using unpaired Student’s t-test. h Correlation between miR-182 and percentage of peripheral blood blasts in the high-risk AML patient set. Groups were divided according to the median miR-182 expression. High miR-182 expressing patients showed significantly lower peripheral blood blast counts. (n = 42, ***p < 0.001). P values were calculated using unpaired Student’s t-testCC BY · PubMed Central
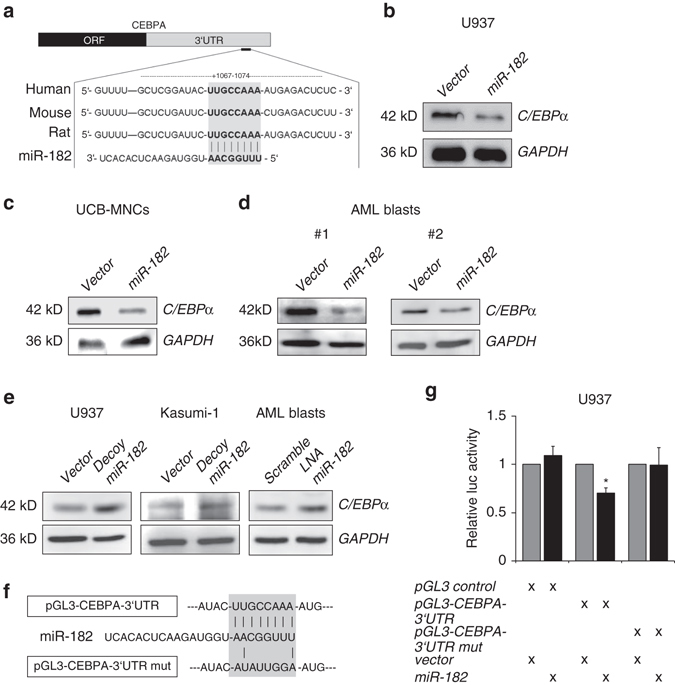
Fig. 4 C/EBPα is a direct target of miR-182. a Schematic overview about the highly conserved binding site for miR-182 in the 3′-UTR of the CEBPA mRNA. b–d Transient overexpression of human miR-182 led to a reduction of C/EBPα protein amount in b U937 cells, umbilical cord blood mononuclear cells (UCB-MNCs) c and primary AML-blasts d in vitro. e A block of miR-182 by either stable infection of U937 or Kasumi-1 cells with decoy-182 vector (left panels) or LNA treatment of primary AML blasts in vitro (right panel) led to elevated C/EBPα protein levels. f Schematic overview about the miR-182 binding site in the luciferase vector and the mutation of the indicated nucleotides. g Luciferase reporter and mutagenesis assay. U937 cells were co-transfected with either pGL3-control vector, pGL3-CEBPA-3′UTR or pGL3-CEBPA-mutant-3′UTR and pcDNA-6.2 empty (gray bars) or pcDNA-6.2-miR-182 (black bars). An overexpression of miR-182 inhibited the relative luciferase activity only when co-transfected with the pGL3-CEBPA-3′UTR. Normalization was done using Renilla luciferase construct (pRL). Data represent the mean ± SD of three independent experiments. (*p < 0.05) P values were calculated using unpaired Student’s t-test
Fig. 4 C/EBPα is a direct target of miR-182. a Schematic overview about the highly conserved binding site for miR-182 in the 3′-UTR of the CEBPA mRNA. b–d Transient overexpression of human miR-182 led to a reduction of C/EBPα protein amount in b U937 cells, umbilical cord blood mononuclear cells (UCB-MNCs) c and primary AML-blasts d in vitro. e A block of miR-182 by either stable infection of U937 or Kasumi-1 cells with decoy-182 vector (left panels) or LNA treatment of primary AML blasts in vitro (right panel) led to elevated C/EBPα protein levels. f Schematic overview about the miR-182 binding site in the luciferase vector and the mutation of the indicated nucleotides. g Luciferase reporter and mutagenesis assay. U937 cells were co-transfected with either pGL3-control vector, pGL3-CEBPA-3′UTR or pGL3-CEBPA-mutant-3′UTR and pcDNA-6.2 empty (gray bars) or pcDNA-6.2-miR-182 (black bars). An overexpression of miR-182 inhibited the relative luciferase activity only when co-transfected with the pGL3-CEBPA-3′UTR. Normalization was done using Renilla luciferase construct (pRL). Data represent the mean ± SD of three independent experiments. (*p < 0.05) P values were calculated using unpaired Student’s t-testCC BY · PubMed Central
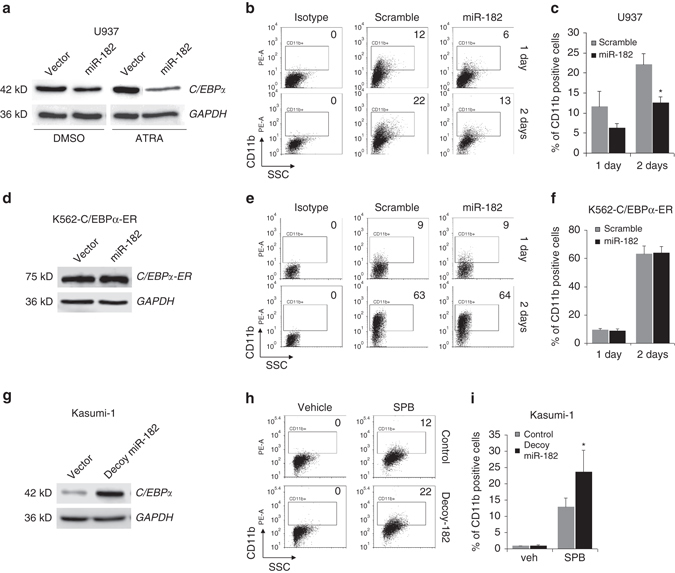
Fig. 5 MiR-182 blocks granulocytic differentiation in vitro. a Overexpression of miR-182 reduced the amount of C/EBPα protein in both DMSO treated and ATRA treated U937 cells as analyzed by western blot. b and c Enforced expression of miR-182 led to a reduced percentage of CD11b-positive U937 cells after treatment with ATRA. b Representative FACS analysis for myeloid marker CD11b in miR-182 or scramble transfected U937 cells treated for 24 or 48 h with 1 µM ATRA to induce granulocytic differentiation and c summary of all experimental repetitions. Data represent the mean ± SD of three independent experiments. (*p < 0.05) P values were calculated using unpaired Student’s t-test. d Overexpression of miR-182 did not affect the amount of C/EBPα-ER fusionprotein in K562-C/EBPα-p42-ER cells as analyzed by western blot. e and f Enforced expression of miR-182 did not affect the percentage of CD11b-positive K562-C/EBPα-ER cells after treatment with β-estradiol. e Representative FACS analysis for myeloid marker CD11b in miR-182 or scramble transfected K562-C/EBPα-ER cells treated for 24 or 48 h with 5 µM β-estradiol to induce granulocytic differentiation and f summary of all experimental repetitions. Data represent the mean ± SD of three independent experiments. g Block of miR-182 by decoy lentiviral infection increased the amount of C/EBPα protein level in Kasumi-1 cells as analyzed by western blot. h and i A block of miR-182 accelerates myeloid differentiation of Kasumi-1 cells induced by 1 mM Sodium phenylbutyrate (SPB). h Representative FACS analysis for myeloid marker CD11b in decoy-miR-182 or control infected Kasumi-1 cells treated for 72 h with either vehicle control (left panel) or 1 mM SPB to induce granulocytic differentiation and i summary of all experimental repetitions. Data represent the mean ± SD of four independent experiments. (*p < 0.05) P values were calculated using unpaired Student’s t-test
Fig. 5 MiR-182 blocks granulocytic differentiation in vitro. a Overexpression of miR-182 reduced the amount of C/EBPα protein in both DMSO treated and ATRA treated U937 cells as analyzed by western blot. b and c Enforced expression of miR-182 led to a reduced percentage of CD11b-positive U937 cells after treatment with ATRA. b Representative FACS analysis for myeloid marker CD11b in miR-182 or scramble transfected U937 cells treated for 24 or 48 h with 1 µM ATRA to induce granulocytic differentiation and c summary of all experimental repetitions. Data represent the mean ± SD of three independent experiments. (*p < 0.05) P values were calculated using unpaired Student’s t-test. d Overexpression of miR-182 did not affect the amount of C/EBPα-ER fusionprotein in K562-C/EBPα-p42-ER cells as analyzed by western blot. e and f Enforced expression of miR-182 did not affect the percentage of CD11b-positive K562-C/EBPα-ER cells after treatment with β-estradiol. e Representative FACS analysis for myeloid marker CD11b in miR-182 or scramble transfected K562-C/EBPα-ER cells treated for 24 or 48 h with 5 µM β-estradiol to induce granulocytic differentiation and f summary of all experimental repetitions. Data represent the mean ± SD of three independent experiments. g Block of miR-182 by decoy lentiviral infection increased the amount of C/EBPα protein level in Kasumi-1 cells as analyzed by western blot. h and i A block of miR-182 accelerates myeloid differentiation of Kasumi-1 cells induced by 1 mM Sodium phenylbutyrate (SPB). h Representative FACS analysis for myeloid marker CD11b in decoy-miR-182 or control infected Kasumi-1 cells treated for 72 h with either vehicle control (left panel) or 1 mM SPB to induce granulocytic differentiation and i summary of all experimental repetitions. Data represent the mean ± SD of four independent experiments. (*p < 0.05) P values were calculated using unpaired Student’s t-testCC BY · PubMed Central
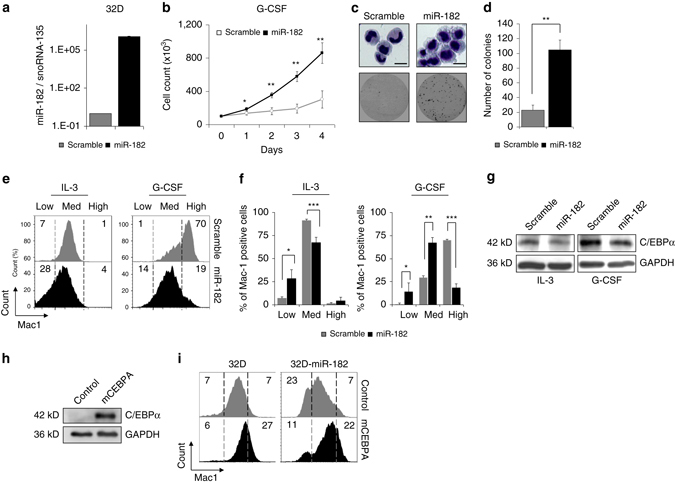
Fig. 6 Exogenous C/EBPα abrogates miR-182 mediated effects. a MiR-182 levels in 32D cells transduced with either miR-182 or scramble lentivirus. MiR-182 expression was measured by qPCR. b MiR-182 expressing 32D cells showed increased cell numbers under G-CSF conditions (black line) compared to control scramble transduced cells (gray line). 1 × 10⁵ cells were initially seeded and cultured in medium without IL-3 and supplemented with 20 ng/ml G-CSF. Data represent the mean ± SD of three independent experiments. (*p < 0.05; **p < 0.01) P values were calculated using unpaired Student’s t-test. c Morphological analyses by cytospins followed by Wright-Giemsa-staining (top panel). MiR-182 expressing 32D cells exhibited less morphological signs of mature granulocytes and remained in an immature stage after treatment with G-CSF for 7 days. Representative plate from a CFU-assay of 32D-scramble or miR-182 expressing cells after 7 days under G-CSF conditions (bottom panel). Scale bar 5 µM. d Summary of 4 independent CFU-assays demonstrated enhanced colony forming unit ability of miR-182 expressing 32D cells after 7 days under G-CSF conditions. Data represent the mean ± SD. (**p < 0.01) P-values were calculated using unpaired Student’s t-test. e and f Stable overexpression of miR-182 led to a reduced percentage of Mac-1 positive 32D cells under both IL-3 and G-CSF conditions. e Representative flow cytometry analysis for myeloid marker Mac-1 in miR-182 or scramble expressing 32D cells under IL-3 conditions (left panel) or after treatment with 20 ng/ml G-CSF for 7 days (right panel) and f summary of all experimental repetitions. Y-axis indicate the percentage of Mac-1 positive cells. Data represent the mean ± SD of three independent experiments. (*p < 0.05; **p < 0.01; ***p < 0.001) P-values were calculated using unpaired Student’s t-test. g Western blot analysis of 32D cells stably expressing either scramble or miR-182 sequence revealed reduced C/EBPα protein levels under IL-3 conditions or after treatment for 7 days with 20 ng/ml G-CSF. h Transduction of 32D cells with exogenous murine CEBPA enhances the detectable amount of C/EBPα protein. Analysis was performed using western blot. i Exogenous C/EBPα lacking a natural 3′UTR can rescue the miR-182 induced phenotype in 32D cells. Representative flow cytometry analysis for Mac-1 in either parental 32D cells or 32D cells stably expressing miR-182 transduced with control or mCEBPA. Analysis was made 10 days after transduction
Fig. 6 Exogenous C/EBPα abrogates miR-182 mediated effects. a MiR-182 levels in 32D cells transduced with either miR-182 or scramble lentivirus. MiR-182 expression was measured by qPCR. b MiR-182 expressing 32D cells showed increased cell numbers under G-CSF conditions (black line) compared to control scramble transduced cells (gray line). 1 × 10⁵ cells were initially seeded and cultured in medium without IL-3 and supplemented with 20 ng/ml G-CSF. Data represent the mean ± SD of three independent experiments. (*p < 0.05; **p < 0.01) P values were calculated using unpaired Student’s t-test. c Morphological analyses by cytospins followed by Wright-Giemsa-staining (top panel). MiR-182 expressing 32D cells exhibited less morphological signs of mature granulocytes and remained in an immature stage after treatment with G-CSF for 7 days. Representative plate from a CFU-assay of 32D-scramble or miR-182 expressing cells after 7 days under G-CSF conditions (bottom panel). Scale bar 5 µM. d Summary of 4 independent CFU-assays demonstrated enhanced colony forming unit ability of miR-182 expressing 32D cells after 7 days under G-CSF conditions. Data represent the mean ± SD. (**p < 0.01) P-values were calculated using unpaired Student’s t-test. e and f Stable overexpression of miR-182 led to a reduced percentage of Mac-1 positive 32D cells under both IL-3 and G-CSF conditions. e Representative flow cytometry analysis for myeloid marker Mac-1 in miR-182 or scramble expressing 32D cells under IL-3 conditions (left panel) or after treatment with 20 ng/ml G-CSF for 7 days (right panel) and f summary of all experimental repetitions. Y-axis indicate the percentage of Mac-1 positive cells. Data represent the mean ± SD of three independent experiments. (*p < 0.05; **p < 0.01; ***p < 0.001) P-values were calculated using unpaired Student’s t-test. g Western blot analysis of 32D cells stably expressing either scramble or miR-182 sequence revealed reduced C/EBPα protein levels under IL-3 conditions or after treatment for 7 days with 20 ng/ml G-CSF. h Transduction of 32D cells with exogenous murine CEBPA enhances the detectable amount of C/EBPα protein. Analysis was performed using western blot. i Exogenous C/EBPα lacking a natural 3′UTR can rescue the miR-182 induced phenotype in 32D cells. Representative flow cytometry analysis for Mac-1 in either parental 32D cells or 32D cells stably expressing miR-182 transduced with control or mCEBPA. Analysis was made 10 days after transductionCC BY · PubMed Central
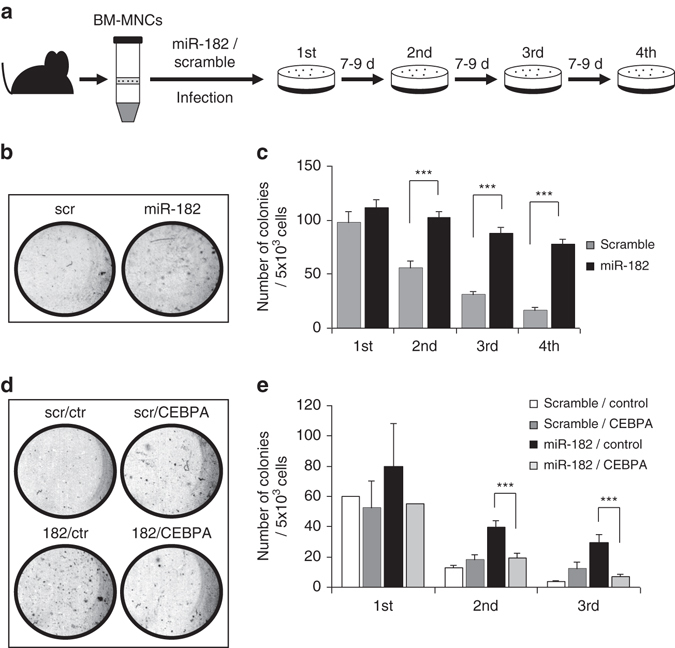
Fig. 7 Enforced expression of miR-182 enhances replating capacity. a Schematic overview of the experimental strategy. Bone marrow cells were isolated from the tibia and femur and ficolled to obtain the mononuclear cells (BM-MNCs). Cells were infected with virus coding for murine miR-182 or scramble control and sorted for GFP + cells two days after infection. Cells were placed in semisolid medium and replated every 7–9 days. b Representative plates of CFU-assay after the fourth round of replating revealed more colonies after enforced miR-182 expression compared to control. c Summary of all replating rounds as a result of 4 independent wells of a 12 well plate. MiR-182 expressing mBM-MNCs showed significantly enhanced replating capacity. Data represent the mean ± SD of four independent wells. (***p < 0.001) P values were calculated using unpaired Student’s t-test. d Exogenous C/EBPα lacking a 3′UTR rescues the ability of miR-182 to enhance replating capacity: Representative plates of CFU-assay after third round of replating revealed more colonies after enforced miR-182 expression (182-ctr). This effect was rescued by additional infection with CEBPA coding lentiviral vectors (182-CEBPA). e Summary of all replating rounds as a result of 4 independent wells of a 12 well plate at the second and third replating round. MiR-182-CEBPA double expressing mBM-MNCs showed significantly reduced replating capacity compared to miR-182-control expression cells. Data represent the mean ± SD of four independent wells. (***p < 0.001) P values were calculated using unpaired Student’s t-test. scr = miR-scramble control vector, ctr = CEBPA empty control vector
Fig. 7 Enforced expression of miR-182 enhances replating capacity. a Schematic overview of the experimental strategy. Bone marrow cells were isolated from the tibia and femur and ficolled to obtain the mononuclear cells (BM-MNCs). Cells were infected with virus coding for murine miR-182 or scramble control and sorted for GFP + cells two days after infection. Cells were placed in semisolid medium and replated every 7–9 days. b Representative plates of CFU-assay after the fourth round of replating revealed more colonies after enforced miR-182 expression compared to control. c Summary of all replating rounds as a result of 4 independent wells of a 12 well plate. MiR-182 expressing mBM-MNCs showed significantly enhanced replating capacity. Data represent the mean ± SD of four independent wells. (***p < 0.001) P values were calculated using unpaired Student’s t-test. d Exogenous C/EBPα lacking a 3′UTR rescues the ability of miR-182 to enhance replating capacity: Representative plates of CFU-assay after third round of replating revealed more colonies after enforced miR-182 expression (182-ctr). This effect was rescued by additional infection with CEBPA coding lentiviral vectors (182-CEBPA). e Summary of all replating rounds as a result of 4 independent wells of a 12 well plate at the second and third replating round. MiR-182-CEBPA double expressing mBM-MNCs showed significantly reduced replating capacity compared to miR-182-control expression cells. Data represent the mean ± SD of four independent wells. (***p < 0.001) P values were calculated using unpaired Student’s t-test. scr = miR-scramble control vector, ctr = CEBPA empty control vectorCC BY · PubMed Central
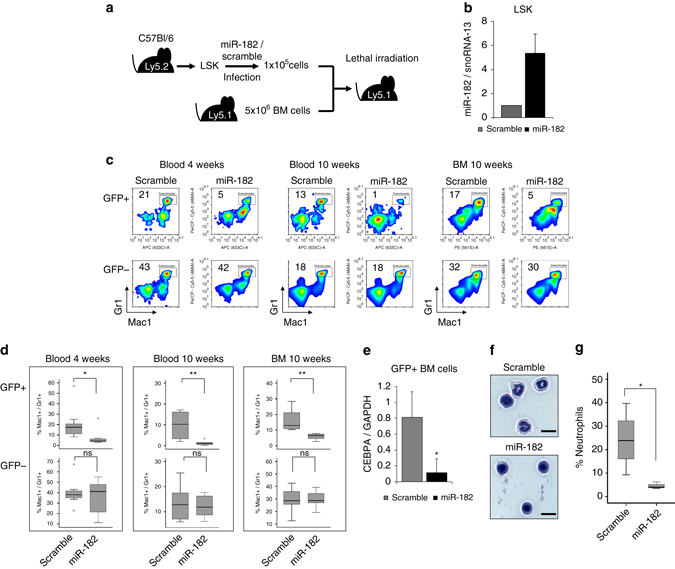
Fig. 8 Enforced expression of miR-182 blocks granulocytic differentiation in vivo. a Schematic overview of the LSK based transplantation model. b MiR-182 levels in GFP+ LSK cells transduced with either miR-182 or scramble lentiviral particles. MiR-182 expression was measured by qPCR 48 h after transduction. c Representative flow cytometry analysis from blood (4 and 10 weeks) and bone marrow (10 weeks) after transplantation revealed a reduced percentage of Mac1+/Gr1+ granulocytes in the GFP+ fraction of mice transplanted with miR-182 transduced LSK cells compared to mice transplanted with scramble transduced cells. GFP− cells served as controls. d Summary of flow cytometry analysis from blood and bone marrow at indicated time points after transplantation. Percentage of mature Mac1+/Gr1+ granulocytes in the GFP+ fraction of mice transplanted with miR-182 transduced LSK cells was significantly reduced. No effect was observed in the GFP− fraction. Bars represent the summary of 3 independent bone marrow transplantations with the indicated total number of animals (4 weeks: scramble n = 9 and miR-182 n = 8; 10 weeks: scramble n = 8 and miR-182 n = 6; *p < 0.05; **p < 0.01; ns—not significant). P values were calculated using unpaired Student’s t-test. e MiR-182 expressing mice showed reduced CEBPA mRNA levels in the bone marrow. GFP + cells from the bone marrow 10 weeks after transplantation were sorted and analyzed by qPCR for CEBPA mRNA expression. Data represent the mean ± SD of four independent animals. (*p < 0.05) P values were calculated using unpaired Student’s t-test. f and g Cell morphology analysis from GFP+ sorted bone marrow cells 10 weeks after transplantation by Wright-Giemsa-staining showed reduced numbers of mature neutrophils in miR-182 transduced mice. f Representative photographs (Scale bar 5 µM) and g summary of four mice (scramble) and three mice (miR-182), respectively. (*p < 0.05) P values were calculated using unpaired Student’s t-test
Fig. 8 Enforced expression of miR-182 blocks granulocytic differentiation in vivo. a Schematic overview of the LSK based transplantation model. b MiR-182 levels in GFP+ LSK cells transduced with either miR-182 or scramble lentiviral particles. MiR-182 expression was measured by qPCR 48 h after transduction. c Representative flow cytometry analysis from blood (4 and 10 weeks) and bone marrow (10 weeks) after transplantation revealed a reduced percentage of Mac1+/Gr1+ granulocytes in the GFP+ fraction of mice transplanted with miR-182 transduced LSK cells compared to mice transplanted with scramble transduced cells. GFP− cells served as controls. d Summary of flow cytometry analysis from blood and bone marrow at indicated time points after transplantation. Percentage of mature Mac1+/Gr1+ granulocytes in the GFP+ fraction of mice transplanted with miR-182 transduced LSK cells was significantly reduced. No effect was observed in the GFP− fraction. Bars represent the summary of 3 independent bone marrow transplantations with the indicated total number of animals (4 weeks: scramble n = 9 and miR-182 n = 8; 10 weeks: scramble n = 8 and miR-182 n = 6; *p < 0.05; **p < 0.01; ns—not significant). P values were calculated using unpaired Student’s t-test. e MiR-182 expressing mice showed reduced CEBPA mRNA levels in the bone marrow. GFP + cells from the bone marrow 10 weeks after transplantation were sorted and analyzed by qPCR for CEBPA mRNA expression. Data represent the mean ± SD of four independent animals. (*p < 0.05) P values were calculated using unpaired Student’s t-test. f and g Cell morphology analysis from GFP+ sorted bone marrow cells 10 weeks after transplantation by Wright-Giemsa-staining showed reduced numbers of mature neutrophils in miR-182 transduced mice. f Representative photographs (Scale bar 5 µM) and g summary of four mice (scramble) and three mice (miR-182), respectively. (*p < 0.05) P values were calculated using unpaired Student’s t-testCC BY · PubMed Central
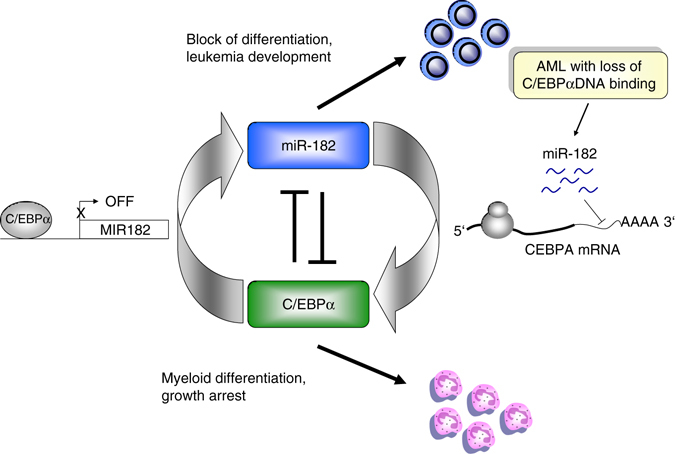
Fig. 9 Schematic model of the identified C/EBPα-miR-182 interaction. During myeloid differentiation (lower panel), C/EBPα is active, binds to the MIR182 promoter and reduces miR-182 expression. Elevated miR-182 levels, especially in AML with defective C/EBPα DNA binding capacity, reduce the amount of functional C/EBPα protein by direct binding to the CEBPA 3′UTR and block myeloid differentiation (upper panel). C/EBPα is a critical transcription factor involved in myelopoiesis and its inactivation is associated with acute myeloid leukemia (AML). Here the authors show a negative feedback loop between C/EBPα and miR-182 and identify this miRNA as a marker of high-risk AML
Fig. 9 Schematic model of the identified C/EBPα-miR-182 interaction. During myeloid differentiation (lower panel), C/EBPα is active, binds to the MIR182 promoter and reduces miR-182 expression. Elevated miR-182 levels, especially in AML with defective C/EBPα DNA binding capacity, reduce the amount of functional C/EBPα protein by direct binding to the CEBPA 3′UTR and block myeloid differentiation (upper panel). C/EBPα is a critical transcription factor involved in myelopoiesis and its inactivation is associated with acute myeloid leukemia (AML). Here the authors show a negative feedback loop between C/EBPα and miR-182 and identify this miRNA as a marker of high-risk AMLCC BY · PubMed Central

Verification

Claims the paper makes

The claims and statistics of this paper haven’t been checked yet.

Run the check — free, no account needed. It reads the open-access text and checks the sources it cites.

A few free checks a day · papers already verified open instantly · results are public

Claims other papers make about this one

Each is checked against this paper’s own text: does it say what the citing paper says it does?

Self-check

Percentages, sums and reported differences re-computed from the paper’s own numbers.

The self-check needs the paper’s full text.

Citations

Cites

Show all 6 references

Research works printed but not linked: 58

  1. Ferrara, F. & Schiffer, C. A. Acute myeloid leukaemia in adults. Lancet 381, 484–495 (2013). · DOI
  2. Vardiman, J. W. et al. The 2008 revision of the world health organization (WHO) classification of myeloid neoplasms and acute leukemia: rationale and important changes. Blood 114, 937–951 (2009). · DOI
  3. Castilla, L. H. C/EBPalpha in leukemogenesis: a matter of being in the right place with the right signals. Cancer Cell 13, 289–291 (2008). · DOI
  4. Lin, F. T., MacDougald, O. A., Diehl, A. M. & Lane, M. D. A 30-kDa alternative translation product of the CCAAT/enhancer binding protein alpha message: transcriptional activator lacking antimitotic activity. Proc. Natl Acad. Sci. USA 90, 9606–9610 (1993). · DOI
  5. Pabst, T. & Mueller, B. U. Complexity of CEBPA dysregulation in human acute myeloid leukemia. Clin. Cancer Res. 15, 5303–5307 (2009). · DOI
  6. Pabst, T. et al. Dominant-negative mutations of CEBPA, encoding CCAAT/enhancer binding protein-alpha (C/EBPalpha), in acute myeloid leukemia. Nat. Genet. 27, 263–270 (2001). · DOI · Paper page
  7. Lin, T. C. et al. CEBPA methylation as a prognostic biomarker in patients with de novo acute myeloid leukemia. Leukemia 25, 32–40 (2011). · DOI
  8. Radomska, H. S. et al. Block of C/EBP alpha function by phosphorylation in acute myeloid leukemia with FLT3 activating mutations. J. Exp. Med. 203, 371–381 (2006). · DOI
  9. Hegde, V. L. et al. Distinct microRNA expression profile and targeted biological pathways in functional myeloid-derived suppressor cells induced by Delta9-tetrahydrocannabinol in vivo: regulation of CCAAT/enhancer-binding protein alpha by microRNA-690. J. Biol. Chem. 288, 36810–36826 (2013). · DOI
  10. Hackanson, B. et al. Epigenetic modification of CCAAT/enhancer binding protein alpha expression in acute myeloid leukemia. Cancer Res. 68, 3142–3151 (2008). · DOI
  11. Gangaraju, V. K. & Lin, H. MicroRNAs: key regulators of stem cells. Nat. Rev. Mol. Cell Biol. 10, 116–125 (2009). · DOI
  12. Krol, J., Loedige, I. & Filipowicz, W. The widespread regulation of microRNA biogenesis, function and decay. Nat. Rev. Genet. 11, 597–610 (2010). · DOI · Paper page
  13. Zhang, X. et al. MicroRNA-101 suppresses tumor cell proliferation by Acting as an endogenous proteasome inhibitor via targeting the proteasome assembly factor POMP. Mol Cell 59, 243–257 (2015). · DOI
  14. Guo, S. et al. MicroRNA miR-125a controls hematopoietic stem cell number. Proc. Natl. Acad. Sci. USA 107, 14229–14234 (2010). · DOI · Paper page
  15. Fontana, L. et al. MicroRNAs 17-5p-20a-106a control monocytopoiesis through AML1 targeting and M-CSF receptor upregulation. Nat. Cell Biol. 9, 775–787 (2007). · DOI · Paper page
  16. Johnnidis, J. B. et al. Regulation of progenitor cell proliferation and granulocyte function by microRNA-223. Nature. 451, 1125–1129 (2008). · DOI · Paper page
  17. Gerloff, D. et al. NF-kappaB/STAT5/miR-155 network targets PU.1 in FLT3-ITD-driven acute myeloid leukemia. Leukemia 29, 535–547 (2015). · DOI · Paper page
  18. Brauer-Hartmann, D. et al. PML/RARalpha -regulated miR-181a/b cluster targets the tumor suppressor RASSF1A in Acute Promyelocytic Leukemia. Cancer Res. 75, 3411–3424 (2015). · DOI
  19. Katzerke, C. et al. Transcription factor C/EBPalpha-induced microRNA-30c inactivates Notch1 during granulopoiesis and is downregulated in acute myeloid leukemia. Blood 122, 2433–2442 (2013). · DOI
  20. Pulikkan, J. A. et al. Cell-cycle regulator E2F1 and microRNA-223 comprise an autoregulatory negative feedback loop in acute myeloid leukemia. Blood 115, 1768–1778 (2010). · DOI
  21. Pulikkan, J. A. et al. C/EBPalpha regulated microRNA-34a targets E2F3 during granulopoiesis and is down-regulated in AML with CEBPA mutations. Blood 116, 5638–5649 (2010). · DOI
  22. Keeshan, K., Santilli, G., Corradini, F., Perrotti, D. & Calabretta, B. Transcription activation function of C/EBPalpha is required for induction of granulocytic differentiation. Blood 102, 1267–1275 (2003). · DOI
  23. Zhang, H. et al. Sox4 is a key oncogenic target in C/EBPalpha mutant acute myeloid leukemia. Cancer Cell. 24, 575–588 (2013). · DOI
  24. Alberich-Jorda, M. et al. C/EBPgamma deregulation results in differentiation arrest in acute myeloid leukemia. J. Clin. Invest. 122, 4490–4504 (2012). · DOI
  25. Eyholzer, M., Schmid, S., Wilkens, L., Mueller, B. U. & Pabst, T. The tumour-suppressive miR-29a/b1 cluster is regulated by CEBPA and blocked in human AML. Br. J. Cancer 103, 275–284 (2010). · DOI
  26. Song, L. et al. TGF-beta induces miR-182 to sustain NF-kappaB activation in glioma subsets. J. Clin. Invest. 122, 3563–3578 (2012). · DOI
  27. Sachdeva, M. et al. MicroRNA-182 drives metastasis of primary sarcomas by targeting multiple genes. J. Clin. Invest. 124, 4305–4319 (2014). · DOI
  28. Ye, M. et al. C/EBPa controls acquisition and maintenance of adult haematopoietic stem cell quiescence. Nat. Cell. Biol. 15, 385–394 (2013). · DOI
  29. Niebuhr, B. et al. Investigation of C/EBPalpha function in human (versus murine) myelopoiesis provides novel insight into the impact of CEBPA mutations in acute myelogenous leukemia (AML). Leukemia 23, 978–983 (2009). · DOI
  30. Lumayag, S. et al. Inactivation of the microRNA-183/96/182 cluster results in syndromic retinal degeneration. Proc. Natl Acad. Sci. USA 110, E507–E516 (2013). · DOI
  31. D’Alo, F. et al. The amino terminal and E2F interaction domains are critical for C/EBP alpha-mediated induction of granulopoietic development of hematopoietic cells. Blood 102, 3163–3171 (2003). · DOI
  32. Green, C. L. et al. Prognostic significance of CEBPA mutations in a large cohort of younger adult patients with acute myeloid leukemia: impact of double CEBPA mutations and the interaction with FLT3 and NPM1 mutations. J. Clin. Oncol. 28, 2739–2747 (2010). · DOI
  33. TCGA. Genomic and epigenomic landscapes of adult de novo acute myeloid leukemia. N. Engl. J. Med. 368, 2059–2074 (2013). · DOI · Paper page
  34. Zhang, P. et al. Enhancement of hematopoietic stem cell repopulating capacity and self-renewal in the absence of the transcription factor C/EBP alpha. Immunity 21, 853–863 (2004). · DOI
  35. Liu, J. et al. PIG7, transactivated by AML1, promotes apoptosis and differentiation of leukemia cells with AML1-ETO fusion gene. Leukemia 26, 117–126 (2012). · DOI
  36. Souza, L. M. et al. Recombinant human granulocyte colony-stimulating factor: effects on normal and leukemic myeloid cells. Science 232, 61–65 (1986). · DOI
  37. Lieschke, G. J. et al. Mice lacking granulocyte colony-stimulating factor have chronic neutropenia, granulocyte and macrophage progenitor cell deficiency, and impaired neutrophil mobilization. Blood 84, 1737–1746 (1994). · DOI
  38. Wang, X., Scott, E., Sawyers, C. L. & Friedman, A. D. C/EBPalpha bypasses granulocyte colony-stimulating factor signals to rapidly induce PU.1 gene expression, stimulate granulocytic differentiation, and limit proliferation in 32D cl3 myeloblasts. Blood 94, 560–571 (1999). · DOI · Paper page
  39. Johansen, L. M. et al. c-Myc is a critical target for c/EBPalpha in granulopoiesis. Mol. Cell Biol. 21, 3789–3806 (2001). · DOI · Paper page
  40. Cammenga, J. et al. Induction of C/EBPalpha activity alters gene expression and differentiation of human CD34 + cells. Blood. 101, 2206–2214 (2003). · DOI
  41. Liss, A. et al. The gene signature in CCAAT-enhancer-binding protein alpha dysfunctional acute myeloid leukemia predicts responsiveness to histone deacetylase inhibitors. Haematologica 99, 697–705 (2014). · DOI
  42. Slomiany, B. A., D’Arigo, K. L., Kelly, M. M. & Kurtz, D. T. C/EBPalpha inhibits cell growth via direct repression of E2F-DP-mediated transcription. Mol. Cell Biol. 20, 5986–5997 (2000). · DOI
  43. Kirstetter, P. et al. Modeling of C/EBPalpha mutant acute myeloid leukemia reveals a common expression signature of committed myeloid leukemia-initiating cells. Cancer. Cell. 13, 299–310 (2008). · DOI · Paper page
  44. Porse, B. T. et al. E2F repression by C/EBPalpha is required for adipogenesis and granulopoiesis in vivo. Cell 107, 247–258 (2001). · DOI
  45. Porse, B. T. et al. Loss of C/EBP alpha cell cycle control increases myeloid progenitor proliferation and transforms the neutrophil granulocyte lineage. J. Exp. Med. 202, 85–96 (2005). · DOI · Paper page
  46. Santana-Lemos, B. A. et al. The CEBPA gene is down-regulated in acute promyelocytic leukemia and its upstream promoter, but not the core promoter, is highly methylated. Haematologica 96, 617–620 (2011). · DOI
  47. Marcucci, G. et al. Clinical role of microRNAs in cytogenetically normal acute myeloid leukemia: miR-155 upregulation independently identifies high-risk patients. J. Clin. Oncol. 31, 2086–2093 (2013). · DOI
  48. Pedranzini, L. et al. Differential cytogenomics and miRNA signature of the Acute Myeloid Leukaemia Kasumi-1 cell line CD34+ 38- compartment. Leuk. Res. 34, 1287–1295 (2010). · DOI
  49. Chen, H. Z., Tsai, S. Y. & Leone, G. Emerging roles of E2Fs in cancer: an exit from cell cycle control. Nat. Rev. Cancer 9, 785–797 (2009). · DOI
  50. Bousquet, M., Harris, M. H., Zhou, B. & Lodish, H. F. MicroRNA miR-125b causes leukemia. Proc. Natl. Acad. Sci. USA 107, 21558–21563 (2010). · DOI
  51. Velu, C. S. et al. Therapeutic antagonists of microRNAs deplete leukemia-initiating cell activity. J. Clin. Invest. 124, 222–236 (2014). · DOI
  52. Favreau, A. J. & Sathyanarayana, P. miR-590-5p, miR-219-5p, miR-15b and miR-628-5p are commonly regulated by IL-3, GM-CSF and G-CSF in acute myeloid leukemia. Leuk. Res. 36, 334–341 (2012). · DOI
  53. Stittrich, A. B. et al. The microRNA miR-182 is induced by IL-2 and promotes clonal expansion of activated helper T lymphocytes. Nat. Immunol. 11, 1057–1062 (2010). · DOI
  54. De Obaldia, M. E. et al. T cell development requires constraint of the myeloid regulator C/EBP-alpha by the Notch target and transcriptional repressor Hes1. Nat. Immunol. 14, 1277–1284 (2013). · DOI
  55. Ma, O., Hong, S., Guo, H., Ghiaur, G. & Friedman, A. D. Granulopoiesis requires increased C/EBPalpha compared to monopoiesis, correlated with elevated Cebpa in immature G-CSF receptor versus M-CSF receptor expressing cells. PLoS ONE 9, e95784 (2014). · DOI
  56. Braun, J., Misiak, D., Busch, B., Krohn, K. & Huttelmaier, S. Rapid identification of regulatory microRNAs by miTRAP (miRNA trapping by RNA in vitro affinity purification). Nucleic Acids Res. 42, e66 (2014). · DOI
  57. Mullokandov, G. et al. High-throughput assessment of microRNA activity and function using microRNA sensor and decoy libraries. Nat. Methods 9, 840–846 (2012). · DOI · Paper page
  58. Salomonis, N. et al. Alternative splicing regulates mouse embryonic stem cell pluripotency and differentiation. Proc. Natl Acad. Sci. USA 107, 10514–10519 (2010). · DOI

Cited by

See all 40

Metadata

Authors
Wurm, A. A., Zjablovskaja, P., Kardosova, M., Gerloff, D., Bräuer-Hartmann, D., Katzerke, C., Hartmann, J.-U., Benoukraf, T., Fricke, S., Hilger, N., Müller, A.-M., Bill, M., Schwind, S., Tenen, D. G., Niederwieser, D., Alberich-Jorda, M., & Behre, G.
Venue
Nature Communications
Published
2017-06-29
Volume
8
Issue
1
ISSN
2041-1723
Cited by
40
References
6
Language
en

About these checks

Registry, retraction, Cites and statistics results are computed, not judged, with one exception: a printed reference that no index lists is read once by a model before it counts as a citation error. Claims are extracted by a model and kept only when their quote appears verbatim in the text; each cited source is then checked, with a model’s help, for whether it says what the claim relies on. Those verdicts can be wrong — read the claim’s quote and the cited source before relying on one.

Statistics and arithmetic are recomputed, not judged.

Confidence bands are shown only for fields calibrated on our annotated test set. None is calibrated yet, so no band is shown.

What counts as a claim ›How we measure confidence ›How we check this ›

Are you an author, or do you see a problem with this page? Request a review

How to cite

Cite CoChat for the checks on this page, and the paper for its own findings.

This page
CoChat. (2026). Citation check: Disruption of the C/EBPα—miR-182 balance impairs granulocytic differentiation. https://app.cochat.ai/papers/10.1038/s41467-017-00032-6
The paper
Wurm, A. A., Zjablovskaja, P., Kardosova, M., Gerloff, D., Bräuer-Hartmann, D., Katzerke, C., Hartmann, J.-U., Benoukraf, T., Fricke, S., Hilger, N., Müller, A.-M., Bill, M., Schwind, S., Tenen, D. G., Niederwieser, D., Alberich-Jorda, M., & Behre, G. (2017). Disruption of the C/EBPα—miR-182 balance impairs granulocytic differentiation. Nature Communications. https://doi.org/10.1038/s41467-017-00032-6