

The DOI matches its Crossref record; 50 of the 50 references it cites were found in a registry or an index.
The microbiota protects against respiratory infection via GM-CSF signaling
Open accessAbstract
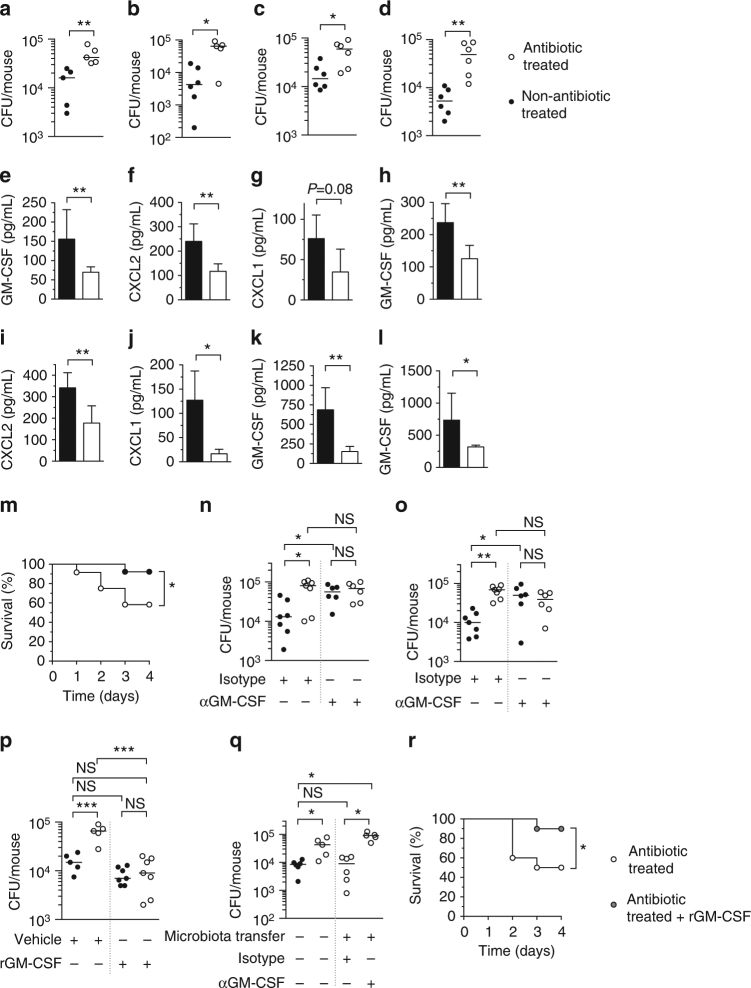
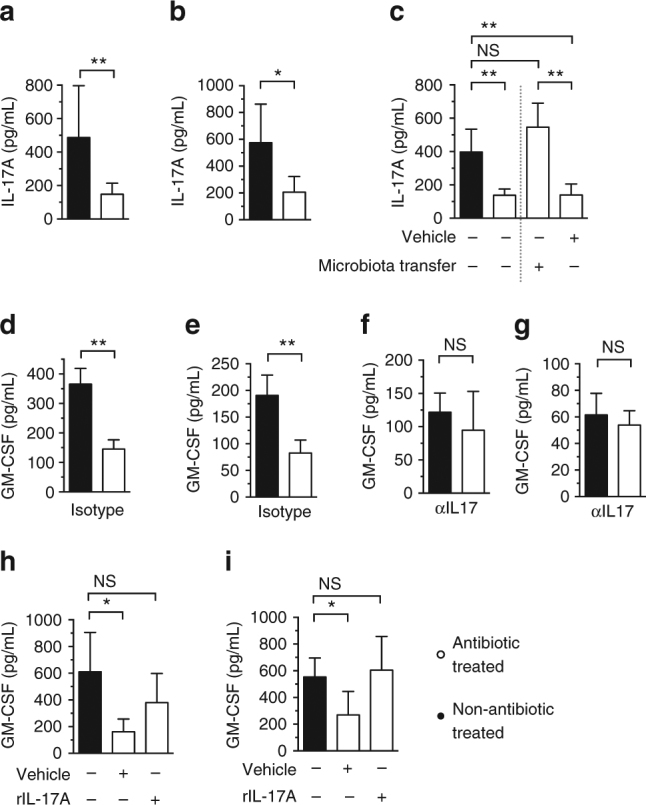
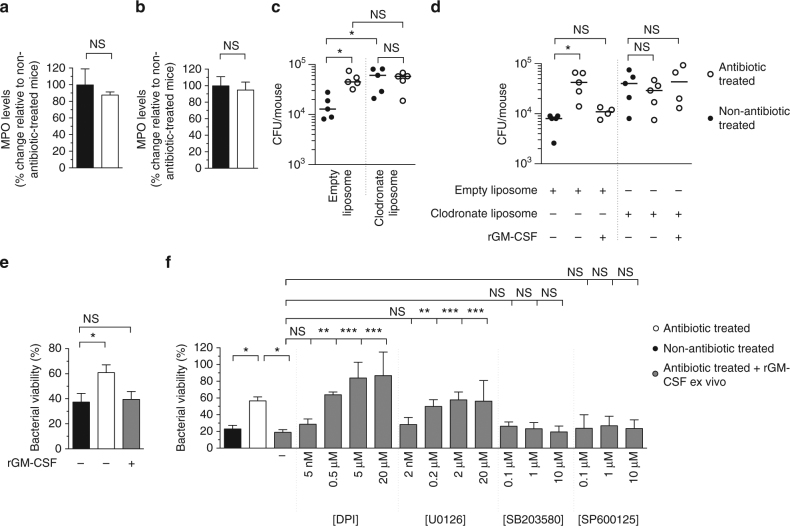
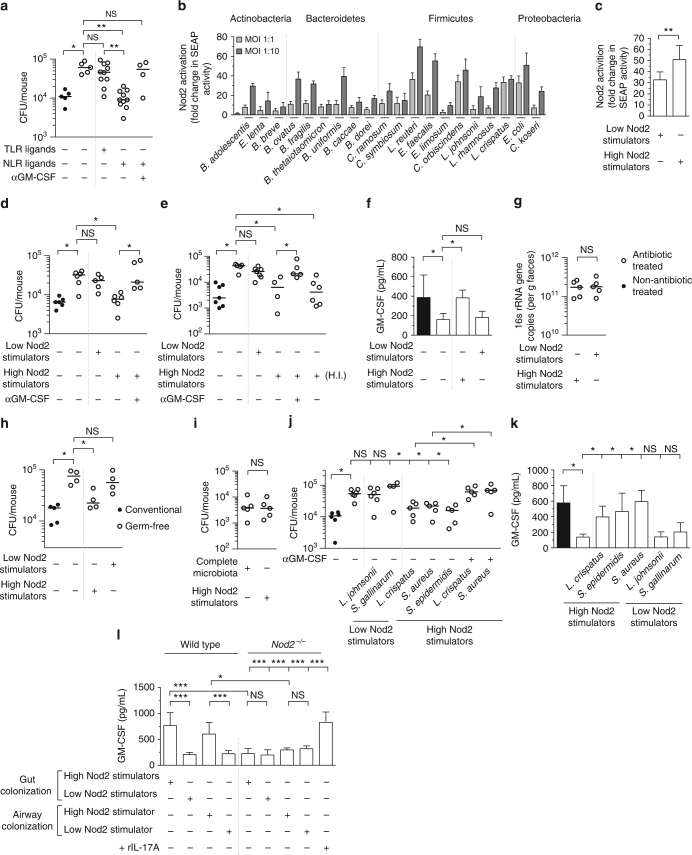
The microbiota promotes resistance to respiratory infection, but the mechanistic basis for this is poorly defined. Here, we identify members of the microbiota that protect against respiratory infection by the major human pathogens Streptococcus pneumoniae and Klebsiella pneumoniae. We show that the microbiota enhances respiratory defenses via granulocyte-macrophage colony-stimulating factor (GM-CSF) signaling, which stimulates pathogen killing and clearance by alveolar macrophages through extracellular signal-regulated kinase signaling. Increased pulmonary GM-CSF production in response to infection is primed by the microbiota through interleukin-17A. By combining models of commensal colonization in antibiotic-treated and germ-free mice, using cultured commensals from the Actinobacteria, Bacteroidetes, Firmicutes, and Proteobacteria phyla, we found that potent Nod-like receptor-stimulating bacteria in the upper airway (Staphylococcus aureus and Staphylococcus epidermidis) and intestinal microbiota (Lactobacillus reuteri, Enterococcus faecalis, Lactobacillus crispatus and Clostridium orbiscindens) promote resistance to lung infection through Nod2 and GM-CSF. Our data reveal the identity, location, and properties of bacteria within the microbiota that regulate lung immunity, and delineate the host signaling axis they activate to protect against respiratory infection.
Overview
The claims and statistics of this paper haven’t been checked yet.
Run the check — free, no account needed. It reads the open-access text and checks the sources it cites.
Integrity signals
Registry
Cites
Statistics
Figures
Verification
Claims the paper makes
The claims and statistics of this paper haven’t been checked yet.
Run the check — free, no account needed. It reads the open-access text and checks the sources it cites.
Claims other papers make about this one
Each is checked against this paper’s own text: does it say what the citing paper says it does?
In the citing paper
“administration of Lactobacillus reuteri, Enterococcus faecalis, Lactobacillus crispatus, and Clostridium orbiscindens, which are strong stimulators of NOD2 (i.e., cytosolic receptor for muramyl dipeptide, which is found in cell walls of certain bacteria), are able to protect against bacterial pneumonia by enhancing GM-CSF production”
From Respiratory viral infection-induced microbiome alterations and secondary bacterial pneumonia. (2018) · cites this paper as [66]
Self-check
Percentages, sums and reported differences re-computed from the paper’s own numbers.
The self-check needs the paper’s full text.
Citations
Cites
Indigenous bacteria from the gut microbiota regulate host serotonin biosynthesis
Yano, J. M., Yu, K., Donaldson, G. P., Shastri, G. G., Ann, P., Ma, L., Nagler, C. R., Ismagilov, R. F., Mazmanian, S. K., & Hsiao, E. Y. (2015) · Cell · doi:10.1016/j.cell.2015.02.047 · Cited by 3,614
The human microbiome: at the interface of health and disease
Cho, I., & Blaser, M. J. (2012) · Nature Reviews Genetics · doi:10.1038/nrg3182 · Cited by 3,449
Microbiota regulates immune defense against respiratory tract influenza A virus infection
Ichinohe, T., Pang, I. K., Kumamoto, Y., Peaper, D. R., Ho, J. H., Murray, T. S., & Iwasaki, A. (2011) · Proceedings of the National Academy of Sciences · doi:10.1073/pnas.1019378108 · Cited by 1,502
Guilliams, M., de Kleer, I., Henri, S., Post, S., Vanhoutte, L., Prijck, S. D., Deswarte, K., MALISSEN, B., Hammad, H., & Lambrecht, B. N. (2013) · The Journal of Experimental Medicine · doi:10.1084/jem.20131199 · Cited by 1,342
The role of Streptococcus pneumoniae virulence factors in host respiratory colonization and disease
Kadioglu, A., Weiser, J. N., Paton, J. C., & Andrew, P. W. (2008) · Nature Reviews Microbiology · doi:10.1038/nrmicro1871 · Cited by 1,184
The first 1000 cultured species of the human gastrointestinal microbiota
Rajilić-Stojanović, M., & de Vos, W. M. (2014) · FEMS Microbiology Reviews · doi:10.1111/1574-6976.12075 · Cited by 1,182
Recognition of peptidoglycan from the microbiota by Nod1 enhances systemic innate immunity
Clarke, T. B., Davis, K. M., Lysenko, E. S., Zhou, A. Y., Yu, Y., & Weiser, J. N. (2010) · Nature Medicine · doi:10.1038/nm.2087 · Cited by 1,154
Self-citationLymphoid tissue genesis induced by commensals through NOD1 regulates intestinal homeostasis
Bouskra, D., Brézillon, C., Bérard, M., Werts, C., Varona, R., Boneca, I. G., & Eberl, G. (2008) · Nature · doi:10.1038/nature07450 · Cited by 1,107
The Gut Microbiota Plays a Protective Role in the Host Defence Against Pneumococcal Pneumonia
Schuijt, T. J., Lankelma, J. M., Scicluna, B. P., de Sousa e Melo, F., Roelofs, J. J. T. H., de Boer, J. D., Hoogendijk, A. J., de Beer, R., de Vos, A., Belzer, C., et al. (2016) · Gut · doi:10.1136/gutjnl-2015-309728 · Cited by 832
Commensal bacteria protect against food allergen sensitization
Stefka, A. T., Feehley, T., Tripathi, P., Qiu, J., McCoy, K. D., Mazmanian, S. K., Tjota, M. Y., Seo, G., Cao, S. Z., Theriault, B. R., et al. (2014) · Proceedings of the National Academy of Sciences · doi:10.1073/pnas.1412008111 · Cited by 812
Cited by
Sorted by citations
Enaud, R., Prével, R., Ciarlo, E., Beaufils, F., Wieërs, G., Guery, B. P., & Delhaès, L. (2020) · Frontiers in Cellular and Infection Microbiology · doi:10.3389/fcimb.2020.00009 · Cited by 786
The influence of the microbiome on respiratory health
Wypych, T. P., Wickramasinghe, L. C., & Marsland, B. J. (2019) · Nature Immunology · doi:10.1038/s41590-019-0451-9 · Cited by 611
Kennedy, E. A., King, K. Y., & Baldridge, M. T. (2018) · Frontiers in Physiology · doi:10.3389/fphys.2018.01534 · Cited by 602
Klebsiella pneumoniae infection biology: living to counteract host defences
Bengoechea, J. A., & Sá‐Pessoa, J. (2018) · FEMS Microbiology Reviews · doi:10.1093/femsre/fuy043 · Cited by 605
Respiratory viral infection-induced microbiome alterations and secondary bacterial pneumonia.
Hanada, S., Pirzadeh, M., Carver, K. Y., & Deng, J. C. (2018) · Frontiers in Immunology · doi:10.3389/fimmu.2018.02640 · Cited by 495
Functional effects of the microbiota in chronic respiratory disease
Budden, K. F., Shukla, S. D., Rehman, S. F., Bowerman, K. L., Keely, S., Hugenholtz, P., Armstrong-James, D. P. H., Adcock, I. M., Chotirmall, S. H., Chung, K. F., et al. (2019) · The Lancet Respiratory Medicine · doi:10.1016/s2213-2600(18)30510-1 · Cited by 453
The role of the lung microbiota and the gut–lung axis in respiratory infectious diseases
Dumas, A., Bernard, L., Poquet, Y., Lugo-Villarino, G., & Neyrolles, O. (2018) · Cellular Microbiology · doi:10.1111/cmi.12966 · Cited by 444
Lung microbiome: new insights into the pathogenesis of respiratory diseases
Li, R., Li, J., & Zhou, X. (2024) · Signal Transduction and Targeted Therapy · doi:10.1038/s41392-023-01722-y · Cited by 483
Colistin kills bacteria by targeting lipopolysaccharide in the cytoplasmic membrane
Sabnis, A., Hagart, K. L., Klöckner, A., Becce, M., Evans, L. E., Furniss, R. C. D., Mavridou, D. A. I., Murphy, R. A., Stevens, M. M., Davies, J. C., et al. (2021) · eLife · doi:10.7554/elife.65836 · Cited by 393
Self-citationSencio, V., Barthélémy, A., Tavares, L. P., Machado, M. G., Soulard, D., Cuinat, C., Queiroz‐Junior, C. M., Noordine, M.-L., Salomé‐Desnoulez, S., Deryuter, L., et al. (2020) · Cell Reports · doi:10.1016/j.celrep.2020.02.013 · Cited by 367
Sepsis therapies: learning from 30 years of failure of translational research to propose new leads
Cavaillon, J., Singer, M., & Skirecki, T. (2020) · EMBO Molecular Medicine · doi:10.15252/emmm.201810128 · Cited by 333
Sencio, V., Machado, M. G., & Trottein, F. (2021) · Mucosal Immunology · doi:10.1038/s41385-020-00361-8 · Cited by 322
Mucosal immune responses to infection and vaccination in the respiratory tract
Mettelman, R. C., Allen, E. K., & Thomas, P. G. (2022) · Immunity · doi:10.1016/j.immuni.2022.04.013 · Cited by 283
The Gut Microbiota and Respiratory Diseases: New Evidence
Li, C., Haiyue, L., Yanxia, L., Jianbing, P., & Su, J. (2020) · Journal of Immunology Research · doi:10.1155/2020/2340670 · Cited by 275
Gallo, O., Locatello, L. G., Mazzoni, A., Novelli, L., & Annunziato, F. (2020) · Mucosal Immunology · doi:10.1038/s41385-020-00359-2 · Cited by 253
Microbiota Modulation of the Gut-Lung Axis in COVID-19
de Oliveira, G. L. V., Oliveira, C. N. S., Pinzan, C. F., de Salis, L. V. V., & Cardoso, C. R. D. B. (2021) · Frontiers in Immunology · doi:10.3389/fimmu.2021.635471 · Cited by 242
Hinks, T., Marchi, E., Jabeen, M., Olshansky, M., Kurioka, A., Pediongco, T. J., Meehan, B. S., Kostenko, L., Turner, S. J., Corbett, A. J., et al. (2019) · Cell Reports · doi:10.1016/j.celrep.2019.07.039 · Cited by 230
The Regulation of Inflammation by Innate and Adaptive Lymphocytes
Cronkite, D. A., & Strutt, T. M. (2018) · Journal of Immunology Research · doi:10.1155/2018/1467538 · Cited by 239
Loss of gut barrier integrity triggers activation of islet-reactive T cells and autoimmune diabetes
Sorini, C., Cosorich, I., Conte, M. L., Giorgi, L. D., Facciotti, F., Lucianò, R., Rocchi, M., Ferrarese, R., Sanvito, F., Canducci, F., et al. (2019) · Proceedings of the National Academy of Sciences · doi:10.1073/pnas.1814558116 · Cited by 225
Malainou, C., Abdin, S. M., Lachmann, N., Matt, U., & Herold, S. (2023) · Journal of Clinical Investigation · doi:10.1172/jci170501 · Cited by 215
The lung microbiome: progress and promise
Whiteside, S. A., McGinniss, J. E., & Collman, R. G. (2021) · Journal of Clinical Investigation · doi:10.1172/jci150473 · Cited by 203
Role of probiotics to combat viral infections with emphasis on COVID-19
Sundararaman, A., Ray, M., Veeranna, R. P., & Halami, P. M. (2020) · Applied Microbiology and Biotechnology · doi:10.1007/s00253-020-10832-4 · Cited by 186
The Th17/Treg Cell Balance: A Gut Microbiota-Modulated Story
Cheng, H., Guan, X., Chen, D., & Ma, W. (2019) · Microorganisms · doi:10.3390/microorganisms7120583 · Cited by 191
Origin and ontogeny of lung macrophages: from mice to humans
Evren, E., Ringqvist, E. E., & Willinger, T. (2019) · Immunology · doi:10.1111/imm.13154 · Cited by 185
Mycobacterium tuberculosis: An Adaptable Pathogen Associated With Multiple Human Diseases
Chai, Q., Zhang, Y., & Liu, C. H. (2018) · Frontiers in Cellular and Infection Microbiology · doi:10.3389/fcimb.2018.00158 · Cited by 181
Commensal Bacteria: An Emerging Player in Defense Against Respiratory Pathogens
Khan, R. S., Petersen, F. C., & Shekhar, S. (2019) · Frontiers in Immunology · doi:10.3389/fimmu.2019.01203 · Cited by 167
Intestinal microbiota mediates Enterotoxigenic Escherichia coli-induced diarrhea in piglets
Bin, P., Tang, Z., Liu, S., Chen, S., Xia, Y., Liu, J., Wu, H., & Zhu, G. (2018) · BMC Veterinary Research · doi:10.1186/s12917-018-1704-9 · Cited by 165
Early Life Microbiota and Respiratory Tract Infections
Piters, W. A. A. D. S., Binkowska, J. M., & Bogaert, D. (2020) · Cell Host & Microbe · doi:10.1016/j.chom.2020.07.004 · Cited by 156
Gheorghe, C. E., Ritz, N. L., Martin, J. A., Wardill, H. R., Cryan, J. F., & Clarke, G. A. (2021) · Gut Microbes · doi:10.1080/19490976.2021.1941711 · Cited by 156
Zhang, Q., Jin, H., Feng, J., Hu, X., Wang, T., Gong, W., Huang, K. L., Guo, Y., Zou, Z., Xian, L., et al. (2020) · Genome biology · doi:10.1186/s13059-020-02007-1 · Cited by 149
Dysbiosis, malnutrition and enhanced gut-lung axis contribute to age-related respiratory diseases
Saint‐Criq, V., Lugo‐Villarino, G., & Thomas, M. (2020) · Ageing Research Reviews · doi:10.1016/j.arr.2020.101235 · Cited by 152
Integrated gut virome and bacteriome dynamics in COVID-19 patients
Cao, J., Wang, C., Zhang, Y., Lei, G., Xu, K., Zhao, N., Lu, J., Meng, F., Yu, L., Yan, J., et al. (2021) · Gut Microbes · doi:10.1080/19490976.2021.1887722 · Cited by 140
Drummond, R. A., Desai, J. V., Ricotta, E. E., Swamydas, M., Deming, C., Conlan, S., Quinones, M., Matei-Rascu, V., Sheriff, L., Lecky, D., et al. (2022) · Cell Host & Microbe · doi:10.1016/j.chom.2022.04.013 · Cited by 141
Shang, L., Liu, H., Yu, H., Chen, M., Yang, T., Zeng, X., & Qiao, S. (2021) · Antibiotics · doi:10.3390/antibiotics10060643 · Cited by 134
Sequeira, R. P., McDonald, J. A. K., Marchesi, J. R., & Clarke, T. B. (2020) · Nature Microbiology · doi:10.1038/s41564-019-0640-1 · Cited by 136
Self-citationDumas, A., Corral, D., Colom, A., Levillain, F., Peixoto, A., Hudrisier, D., Poquet, Y., & Neyrolles, O. (2018) · Frontiers in Immunology · doi:10.3389/fimmu.2018.02656 · Cited by 133
Hu, Y., Yang, Q., Liu, B., Dong, J., Sun, L., Zhu, Y., Su, H., Yang, J., Yang, F., Chen, X., et al. (2018) · Journal of Infection · doi:10.1016/j.jinf.2018.08.006 · Cited by 128
Verma, A., Bhagchandani, T., Rai, A., Nikita, N., Sardarni, U. K., Bhavesh, N. S., Gulati, S., Malik, R., & Tandon, R. (2024) · ACS Omega · doi:10.1021/acsomega.3c05846 · Cited by 127
The microbiota in pneumonia: From protection to predisposition
Thibeault, C., Suttorp, N., & Opitz, B. (2021) · Science Translational Medicine · doi:10.1126/scitranslmed.aba0501 · Cited by 111
Dehhaghi, M., Panahi, H. K. S., Heng, B., & Guillemin, G. J. (2020) · Frontiers in Cell and Developmental Biology · doi:10.3389/fcell.2020.562812 · Cited by 105
GABA transporter sustains IL-1β production in macrophages
Xia, Y., He, F., Wu, X., Tan, B., Chen, S., Liao, Y., Qi, M., Chen, S., Peng, Y., Yin, Y., et al. (2021) · Science Advances · doi:10.1126/sciadv.abe9274 · Cited by 102
Horn, K. J., Schopper, M. A., Drigot, Z., & Clark, S. E. (2022) · Nature Communications · doi:10.1038/s41467-022-31074-0 · Cited by 97
Wu, T. H., Xu, F., Su, C., Li, H., Lv, N., Liu, Y., Gao, Y., Lan, Y., & Li, J.-B. (2020) · Frontiers in Immunology · doi:10.3389/fimmu.2020.01331 · Cited by 96
Intestinal dysbiosis compromises alveolar macrophage immunity to Mycobacterium tuberculosis
Khan, N., Mendonca, L., Dhariwal, A., Fontès, G., Menzies, D., Xia, J., Divangahi, M., & King, I. L. (2019) · Mucosal Immunology · doi:10.1038/s41385-019-0147-3 · Cited by 97
Lung Microbiome in Asthma: Current Perspectives
Loverdos, K., Bellos, G., Kokolatou, L., Vasileiadis, I., Giamarellos‐Bourboulis, E. J., Pecchiari, M., Koulouris, N. G., Koutsoukou, A., & Rovina, N. (2019) · Journal of Clinical Medicine · doi:10.3390/jcm8111967 · Cited by 91
Jordan, C. K. I., Brown, R. L., Larkinson, M. L. Y., Sequeira, R. P., Edwards, A. M., & Clarke, T. B. (2023) · Cell Host & Microbe · doi:10.1016/j.chom.2023.07.008 · Cited by 90
Self-citationThe role of interleukin-17 in asthma: a protective response?
Hynes, G., & Hinks, T. (2020) · ERJ Open Research · doi:10.1183/23120541.00364-2019 · Cited by 93
Lung inflammation and disease: A perspective on microbial homeostasis and metabolism
Méndez, R., Banerjee, S., Bhattacharya, S. K., & Banerjee, S. (2018) · IUBMB Life · doi:10.1002/iub.1969 · Cited by 86
Tian, X., Hellman, J., Horswill, A. R., Crosby, H. A., Francis, K. P., & Prakash, A. (2019) · Frontiers in Microbiology · doi:10.3389/fmicb.2019.00159 · Cited by 85
Potential contribution of beneficial microbes to face the COVID-19 pandemic
Antunes, A. E. C., Vinderola, G., Xavier-Santos, D., & Sivieri, K. (2020) · Food Research International · doi:10.1016/j.foodres.2020.109577 · Cited by 86
Commensal Microbiota Regulate Vertebrate Innate Immunity-Insights From the Zebrafish
Murdoch, C. C., & Rawls, J. F. (2019) · Frontiers in Immunology · doi:10.3389/fimmu.2019.02100 · Cited by 81
Commensal bacteria in the upper respiratory tract regulate susceptibility to infection
Clark, S. E. (2020) · Current Opinion in Immunology · doi:10.1016/j.coi.2020.03.010 · Cited by 83
Farsi, Y., Tahvildari, A., Arbabi, M., Vazife, F., Sechi, L. A., Bonjar, A. H. S., Jamshidi, P. K., Nasiri, M. J., & Mirsaeidi, M. S. (2022) · Frontiers in Cellular and Infection Microbiology · doi:10.3389/fcimb.2022.804644 · Cited by 81
Microbiota-Derived Short-Chain Fatty Acids Promote LAMTOR2-Mediated Immune Responses in Macrophages
Wu, T., Li, H., Su, C., Xu, F., Yang, G., Sun, K., Xu, M., Lv, N., Meng, B., Liu, Y., et al. (2020) · mSystems · doi:10.1128/msystems.00587-20 · Cited by 78
Shu, Z., Li, P., Yu, B., Huang, S., & Chen, Y. (2020) · Oral Oncology · doi:10.1016/j.oraloncology.2019.104559 · Cited by 79
l -Serine Lowers the Inflammatory Responses during Pasteurella multocida Infection
He, F., Yin, Z., Wu, C., Xia, Y., Wu, M., Li, P., Zhang, H., Yin, Y., Li, N., Zhu, G., et al. (2019) · Infection and Immunity · doi:10.1128/iai.00677-19 · Cited by 74
Microbiota-mediated protection against antibiotic-resistant pathogens
Panwar, R., Sequeira, R. P., & Clarke, T. B. (2021) · Genes and Immunity · doi:10.1038/s41435-021-00129-5 · Cited by 74
Self-citationJoseph, L., Merciecca, T., Forestier, C., Balestrino, D., & Miquel, S. (2021) · Microorganisms · doi:10.3390/microorganisms9061282 · Cited by 82
Vareille-Delarbre, M., Miquel, S., Garcin, S., Bertran, T., Balestrino, D., Evrard, B., & Forestier, C. (2019) · Infection and Immunity · doi:10.1128/iai.00570-19 · Cited by 70
How oxygenation shapes immune responses: emerging roles for physioxia and pathological hypoxia
Mirchandani, A. S., Sánchez-García, M. A., & Walmsley, S. R. (2024) · Nature reviews. Immunology · doi:10.1038/s41577-024-01087-5 · Cited by 77
Relationship between nasopharyngeal microbiota and patient’s susceptibility to viral infection
Dubourg, G., Edouard, S., & Raoult, D. (2019) · Expert Review of Anti-infective Therapy · doi:10.1080/14787210.2019.1621168 · Cited by 66
Wu, Z., Ding, L., Bao, J., Liu, Y., Zhang, Q., Wang, J., Li, R., Ishfaq, M., & Li, J. (2019) · Frontiers in Microbiology · doi:10.3389/fmicb.2019.02615 · Cited by 67
More of the Gut in the Lung: How Two Microbiomes Meet in ARDS.
Mukherjee, S., & Hanidziar, D. (2018) · Europe PMC (PubMed Central) · Cited by 70
Antibiotic-related gut dysbiosis induces lung immunodepression and worsens lung infection in mice
Dessein, R., Bauduin, M., Grandjean, T., Guern, R. L., Figeac, M., Beury, D., Faure, K., Faveeuw, C., Guery, B. P., Gosset, P., et al. (2020) · Critical Care · doi:10.1186/s13054-020-03320-8 · Cited by 69
Microbiome-immune interactions in tuberculosis
Mori, G., Morrison, M., & Blumenthal, A. (2021) · PLoS Pathogens · doi:10.1371/journal.ppat.1009377 · Cited by 80
The role of microbiota in respiratory health and diseases, particularly in tuberculosis
Shah, T., Shah, Z., Baloch, Z., & Cui, X. (2021) · Biomedicine & Pharmacotherapy · doi:10.1016/j.biopha.2021.112108 · Cited by 73
Microbiota and Immunity during Respiratory Infections: Lung and Gut Affair
Marrella, V., Nicchiotti, F., & Cassani, B. (2024) · International Journal of Molecular Sciences · doi:10.3390/ijms25074051 · Cited by 72
Innovative Animal Model of DSS-Induced Ulcerative Colitis in Pseudo Germ-Free Mice
Gancarčíková, S., Lauko, S., Hrčková, G., Andrejčáková, Z., Hajdučková, V., Maďar, M., Fecskeová, L. K., Mudroňová, D., Mravcová, K., Štrkolcová, G., et al. (2020) · Cells · doi:10.3390/cells9122571 · Cited by 63
Role of the Microbiome in Interstitial Lung Diseases
Chioma, O. S., Hesse, L. E., Chapman, A., & Drake, W. P. (2021) · Frontiers in Medicine · doi:10.3389/fmed.2021.595522 · Cited by 65
Stricker, S., Hain, T., Chao, C., & Rudloff, S. (2022) · International Journal of Molecular Sciences · doi:10.3390/ijms23126791 · Cited by 64
Growth Factors as Immunotherapeutic Targets in Cardiovascular Disease
Mindur, J. E., & Świrski, F. K. (2019) · Arteriosclerosis Thrombosis and Vascular Biology · doi:10.1161/atvbaha.119.311994 · Cited by 58
Probiotics in the prophylaxis of COVID-19: something is better than nothing
Gohil, K. N., Samson, R., Dastager, S. G., & Dharne, M. S. (2020) · 3 Biotech · doi:10.1007/s13205-020-02554-1 · Cited by 60
Role of the Microbiota in Lung Cancer: Insights on Prevention and Treatment
Pizzo, F., Maroccia, Z., Ferri, I. H., & Fiorentini, C. (2022) · International Journal of Molecular Sciences · doi:10.3390/ijms23116138 · Cited by 60
From germ-free to wild: modulating microbiome complexity to understand mucosal immunology
Thomson, C. A., Morgan, S., Ohland, C., & McCoy, K. D. (2022) · Mucosal Immunology · doi:10.1038/s41385-022-00562-3 · Cited by 59
Hu, L., Sun, L., Yang, C., Zhang, D., Wei, Y.-Y., Yang, M., Wu, H., & Fei, G. (2024) · Journal of Translational Medicine · doi:10.1186/s12967-024-05376-4 · Cited by 56
Tian, X., Hellman, J., Horswill, A. R., Crosby, H. A., Francis, K. P., & Prakash, A. (2019) · Frontiers in Microbiology · doi:10.3389/fmicb.2019.00518 · Cited by 54
Pathophysiology of acute lung injury in patients with acute brain injury: the triple-hit hypothesis
Ziaka, M., & Exadaktylos, A. K. (2024) · Critical Care · doi:10.1186/s13054-024-04855-w · Cited by 54
Peng, G., & Fadeel, B. (2022) · Advanced Drug Delivery Reviews · doi:10.1016/j.addr.2022.114422 · Cited by 54
Mechanistic Insights into the Impact of Air Pollution on Pneumococcal Pathogenesis and Transmission
Beentjes, D., Shears, R. K., French, N., Neill, D. R., & Kadioglu, A. (2022) · American Journal of Respiratory and Critical Care Medicine · doi:10.1164/rccm.202112-2668tr · Cited by 52
Immunological design of commensal communities to treat intestinal infection and inflammation
Brown, R. L., Larkinson, M. L. Y., & Clarke, T. B. (2021) · PLoS Pathogens · doi:10.1371/journal.ppat.1009191 · Cited by 49
Self-citationBernard, L., Colom, A., Monard, S., Namouchi, A., Cescato, M., Garnier, H., Leon‐Icaza, S. A., Métais, A., Dumas, A., Corral, D., et al. (2021) · The Journal of Immunology · doi:10.4049/jimmunol.2001044 · Cited by 49
Immune Memory in Aging: a Wide Perspective Covering Microbiota, Brain, Metabolism, and Epigenetics
Bulut, O. P., Kılıç, G., & Domínguez‐Andrés, J. (2021) · Clinical Reviews in Allergy & Immunology · doi:10.1007/s12016-021-08905-x · Cited by 50
Airway microbiome-immune crosstalk in chronic obstructive pulmonary disease
Kayongo, A., Robertson, N. M., Siddharthan, T., Ntayi, M. L., Ndawula, J. C., Sande, O. J., Bagaya, B. S., Kirenga, B., Mayanja‐Kizza, H., Joloba, M. L., et al. (2023) · Frontiers in Immunology · doi:10.3389/fimmu.2022.1085551 · Cited by 50
Eribo, O. A., du Plessis, N., & Chegou, N. N. (2021) · Infection and Immunity · doi:10.1128/iai.00321-21 · Cited by 45
Kotlyarov, S. N., & Котлярова, А. А. (2021) · International Journal of Molecular Sciences · doi:10.3390/ijms22147634 · Cited by 50
Wang, J., Ishfaq, M., & Li, J. (2021) · Veterinary Immunology and Immunopathology · doi:10.1016/j.vetimm.2021.110192 · Cited by 44
Qi, M., Cao, Z., Shang, P., Zhang, H., Hussain, R., Mehmood, K., Chang, Z., Wu, Q., & Dong, H. (2021) · Microbial Pathogenesis · doi:10.1016/j.micpath.2021.105106 · Cited by 44
Microbiome Modulation as a Novel Strategy to Treat and Prevent Respiratory Infections
Mindt, B. C., & DiGiandomenico, A. (2022) · Antibiotics · doi:10.3390/antibiotics11040474 · Cited by 47
The role of gut-lung axis in COPD: Pathogenesis, immune response, and prospective treatment
Song, Z., Meng, Y., Fricker, M., Li, X., Tian, H., Tan, Y., & Qin, L. (2024) · Heliyon · doi:10.1016/j.heliyon.2024.e30612 · Cited by 44
Lung Microbiome Participation in Local Immune Response Regulation in Respiratory Diseases
Lira-Lucio, J. A., Falfán‐Valencia, R., Ramírez‐Venegas, A., Buendía-Roldán, I., Rojas‐Serrano, J., Mejía, M. E., & Pérez-Rubio, G. (2020) · Microorganisms · doi:10.3390/microorganisms8071059 · Cited by 45
Xia, G., Zhang, M., Wu, Q., Wang, H., Zhou, H., He, Y., & Yin, J. (2021) · Frontiers in Cellular and Infection Microbiology · doi:10.3389/fcimb.2021.715475 · Cited by 42
Impact of Lung Microbiota on COPD
Russo, C., Colaianni, V., Ielo, G., Valle, M. S., Spicuzza, L., & Malaguarnera, L. (2022) · Biomedicines · doi:10.3390/biomedicines10061337 · Cited by 41
The gut-lung axis: the impact of the gut mycobiome on pulmonary diseases and infections
Sey, E. A., & Warris, A. (2024) · Oxford Open Immunology · doi:10.1093/oxfimm/iqae008 · Cited by 39
From the Role of Microbiota in Gut‐Lung Axis to SARS‐CoV‐2 Pathogenesis
Badi, S. A., Tarashi, S., Fateh, A., Rohani, P., Masotti, A., & Siadat, S. D. (2021) · Mediators of Inflammation · doi:10.1155/2021/6611222 · Cited by 39
The Airway Pathobiome in Complex Respiratory Diseases: A Perspective in Domestic Animals
Mach, N., Baranowski, É., Nouvel, L., & Citti, C. (2021) · Frontiers in Cellular and Infection Microbiology · doi:10.3389/fcimb.2021.583600 · Cited by 46
Lejeune, S., Deschildre, A., Rouzic, O. L., Engelmann, I., Dessein, R., Pichavant, M., & Gosset, P. (2020) · Biochemical Pharmacology · doi:10.1016/j.bcp.2020.114046 · Cited by 40
Sanchez, J. F., Maknojia, A., & King, K. Y. (2024) · Blood · doi:10.1182/blood.2023021174 · Cited by 41
Air pollution and the respiratory microbiome
Soumana, I. H., & Carlsten, C. (2021) · Journal of Allergy and Clinical Immunology · doi:10.1016/j.jaci.2021.05.013 · Cited by 37
How does the microbiota control systemic innate immunity?
Jordan, C. K. I., & Clarke, T. B. (2024) · Trends in Immunology · doi:10.1016/j.it.2023.12.002 · Cited by 40
Self-citationAdvances in gut-lung axis research: clinical perspectives on pneumonia prevention and treatment
Ye, F., Li, L., Wang, J., & Hongfeng, Y. (2025) · Frontiers in Immunology · doi:10.3389/fimmu.2025.1576141 · Cited by 40
Metadata
- Authors
- Brown, R. L., Sequeira, R. P., & Clarke, T. B.
- Affiliations
- Imperial College London (GB)
- Corresponding author
- Clarke, Thomas B.
- Venue
- Nature Communications
- Published
- 2017-11-15
- Volume
- 8
- Issue
- 1
- Pages
- 1512-1512
- ISSN
- 2041-1723 (ISSN-L)
- PMC
- PMC5688119
- OpenAlex
- W2768027710
- Cited by
- 378
- References
- 50
- Citations by year
- 2026: 30 · 2025: 39 · 2024: 53 · 2023: 36 · 2022: 56 · 2021: 52 · 2020: 68 · 2019: 27 · 2018: 17
- FWCI
- 12.74
- Type
- journal article
- Language
- en
- Open access
- gold
- doi.org
- Locations
- Nature Communications (publishedVersion, cc-by)
- Europe PMC (PubMed Central) (publishedVersion, cc-by)
- PubMed Central (publishedVersion, cc-by)
- PubMed (publishedVersion)
- RePEc: Research Papers in Economics (submittedVersion)
- DOAJ (DOAJ: Directory of Open Access Journals) (submittedVersion, cc-by-sa)
- Spiral (Imperial College London) (submittedVersion, cc-by)
- Funders
- Wellcome Trust (107660/Z/15/Z, 107660)
- Medical Research Council (MR/J006874/1)
- Topics
- Life Sciences › Biochemistry, Genetics and Molecular Biology › Molecular Biology › Gut microbiota and health
- Life Sciences › Immunology and Microbiology › Immunology › Immune Response and Inflammation
- Life Sciences › Agricultural and Biological Sciences › Plant Science › Plant-Microbe Interactions and Immunity
- Keywords
- gut microbiota, respiratory infections, GM-CSF signaling, Streptococcus pneumoniae, Klebsiella pneumoniae, alveolar macrophages, ERK signaling, IL-17A, NOD2, NOD-like receptors, Staphylococcus aureus, Staphylococcus epidermidis, Lactobacillus reuteri, Enterococcus faecalis, lung immunity, commensal bacteria, germ-free mice, antibiotic-treated mice
- MeSH terms
- Animals, Humans, Klebsiella pneumoniae, Lung, Mice, Inbred C57BL, Respiratory Tract Infections, Streptococcus pneumoniae, Signal Transduction, Granulocyte-Macrophage Colony-Stimulating Factor, Macrophages, Alveolar, Mice, Knockout, Interleukin-17, Microbial Interactions, HEK293 Cells, Microbiota
About these checks
Registry, retraction, Cites and statistics results are computed, not judged, with one exception: a printed reference that no index lists is read once by a model before it counts as a citation error. Claims are extracted by a model and kept only when their quote appears verbatim in the text; each cited source is then checked, with a model’s help, for whether it says what the claim relies on. Those verdicts can be wrong — read the claim’s quote and the cited source before relying on one.
Statistics and arithmetic are recomputed, not judged.
Confidence bands are shown only for fields calibrated on our annotated test set. None is calibrated yet, so no band is shown.
What counts as a claim ›How we measure confidence ›How we check this ›
Are you an author, or do you see a problem with this page? Request a review
