

The DOI matches its Crossref record; 46 of the 46 references it cites were found in a registry or an index.
TNFα blockade overcomes resistance to anti-PD-1 in experimental melanoma
Open accessAbstract
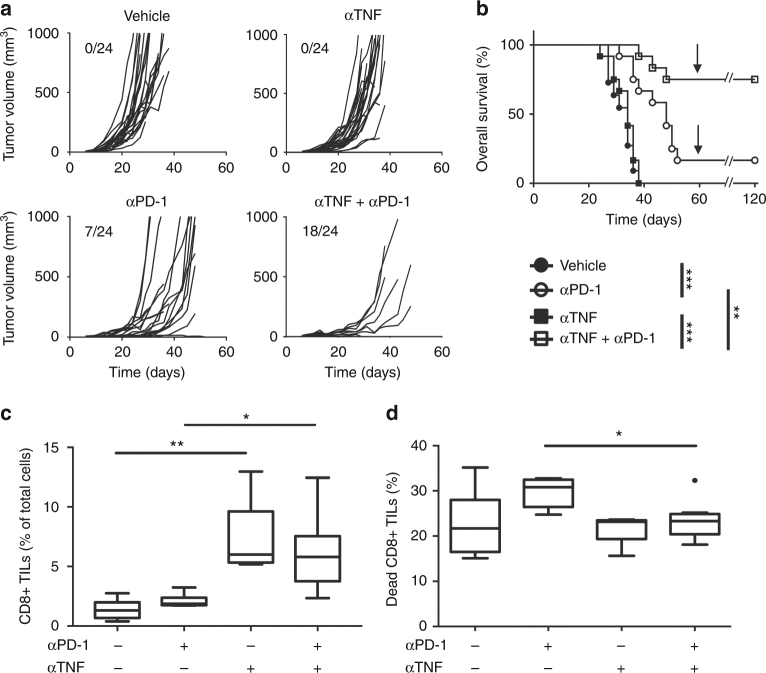
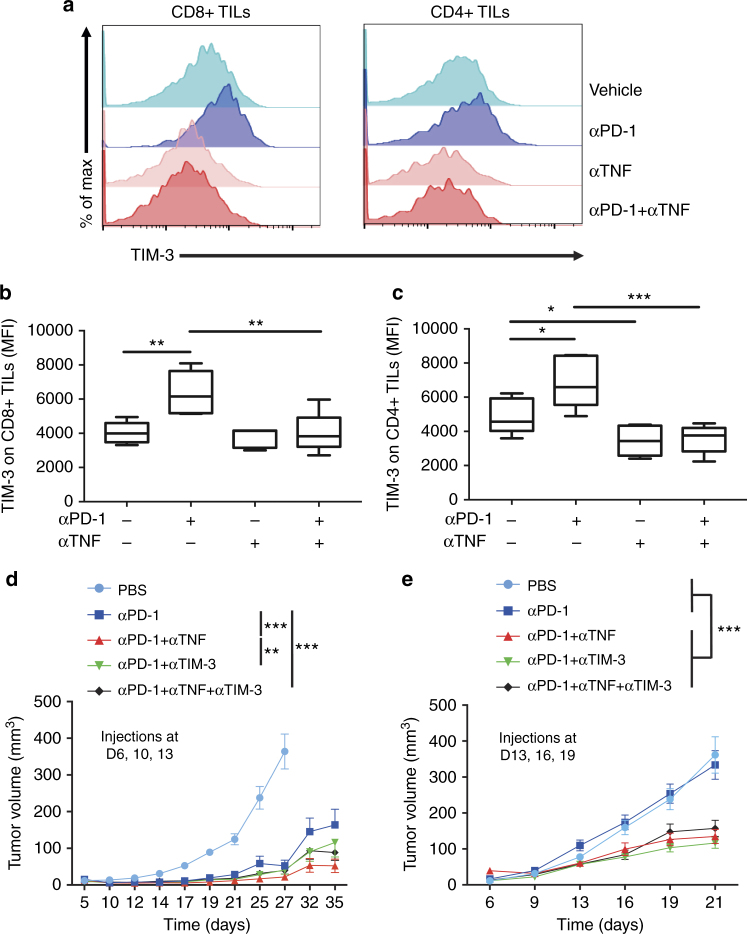
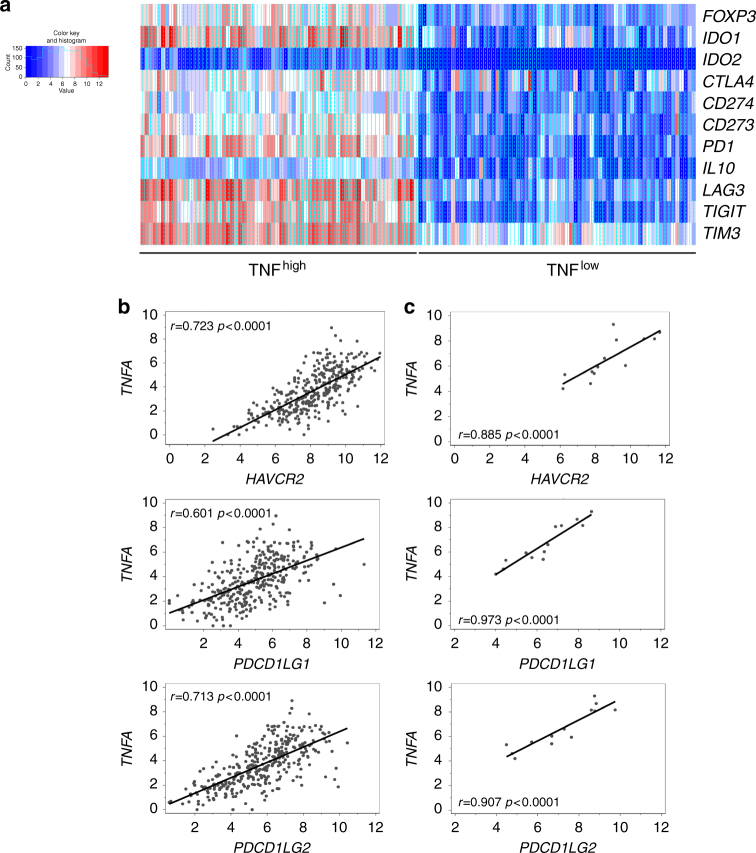
Antibodies against programmed cell death-1 (PD-1) have considerably changed the treatment for melanoma. However, many patients do not display therapeutic response or eventually relapse. Moreover, patients treated with anti-PD-1 develop immune-related adverse events that can be cured with anti-tumor necrosis factor α (TNF) antibodies. Whether anti-TNF antibodies affect the anti-cancer immune response remains unknown. Our recent work has highlighted that TNFR1-dependent TNF signalling impairs the accumulation of CD8+ tumor-infiltrating T lymphocytes (CD8+ TILs) in mouse melanoma. Herein, our results indicate that TNF or TNFR1 blockade synergizes with anti-PD-1 on anti-cancer immune responses towards solid cancers. Mechanistically, TNF blockade prevents anti-PD-1-induced TIL cell death as well as PD-L1 and TIM-3 expression. TNF expression positively correlates with expression of PD-L1 and TIM-3 in human melanoma specimens. This study provides a strong rationale to develop a combination therapy based on the use of anti-PD-1 and anti-TNF in cancer patients.
Overview
The claims and statistics of this paper haven’t been checked yet.
Run the check — free, no account needed. It reads the open-access text and checks the sources it cites.
Integrity signals
Registry
Cites
Statistics
Figures
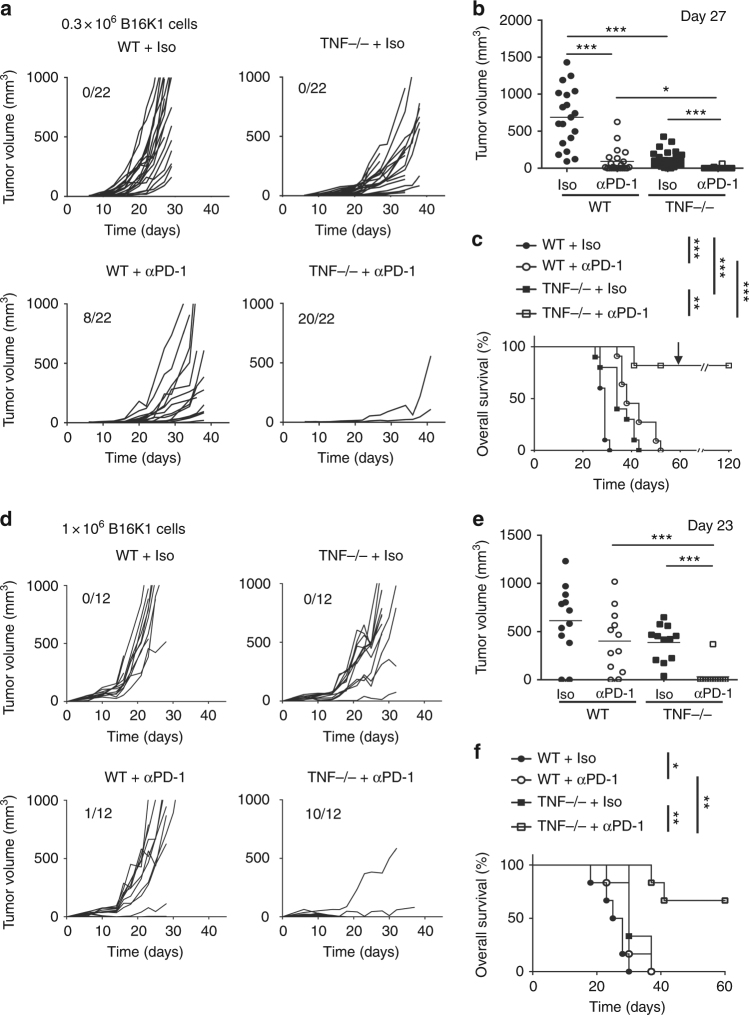
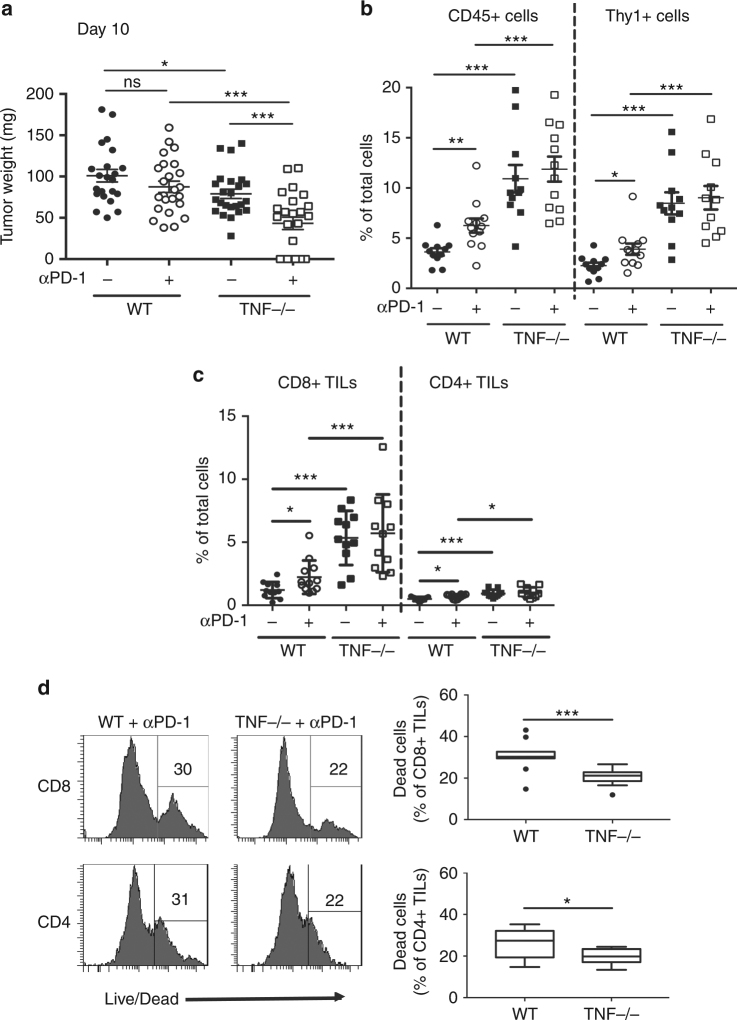
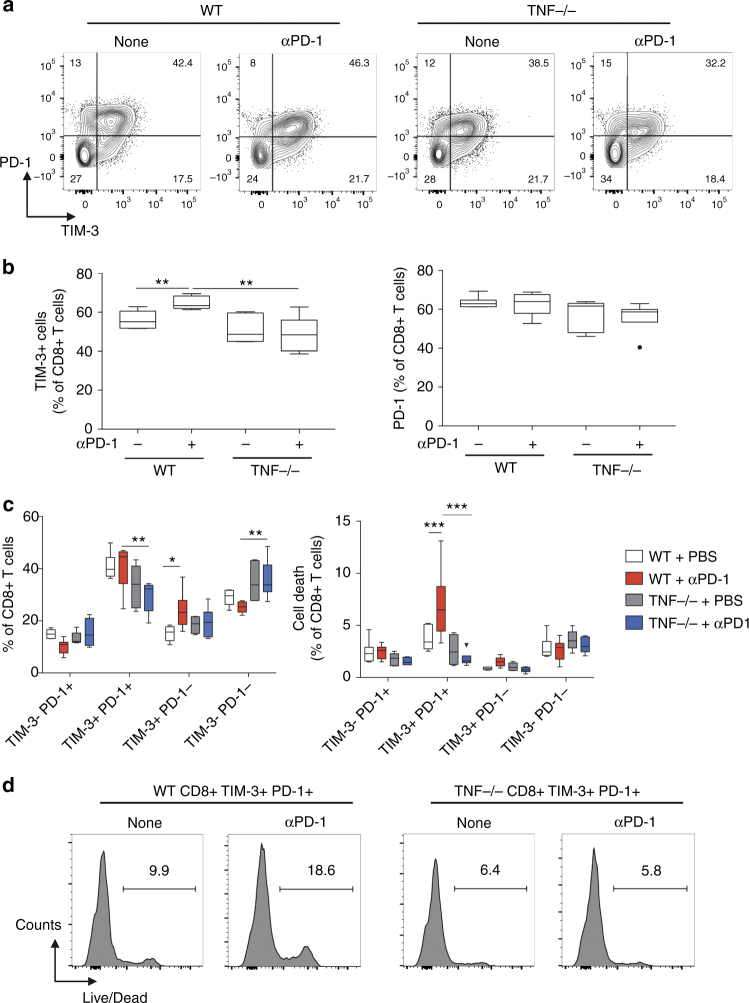
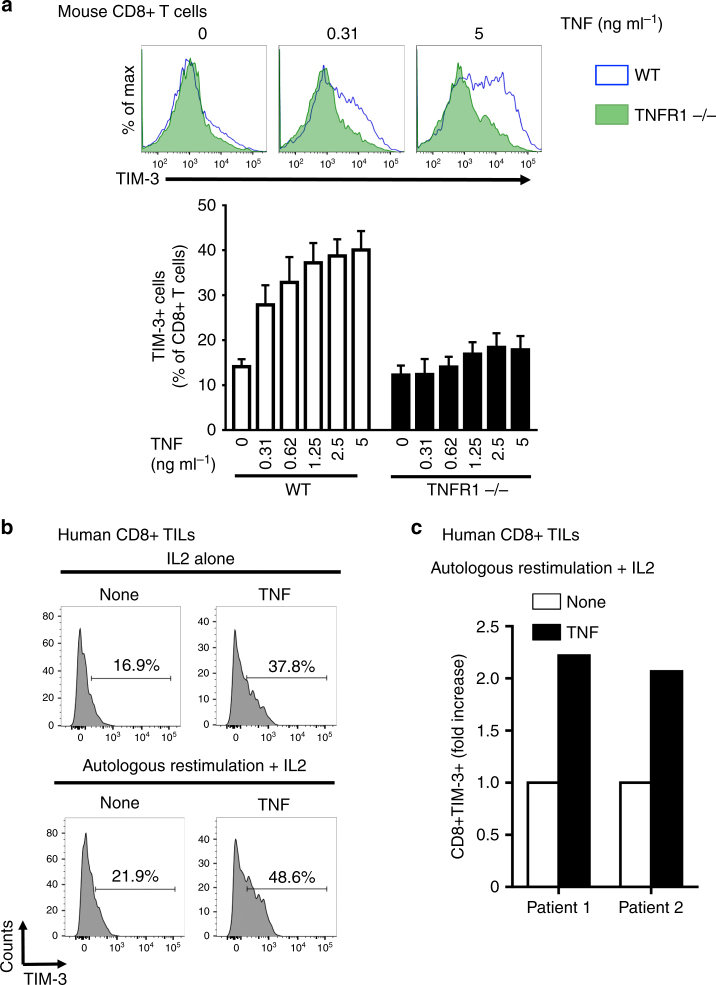
Verification
Claims the paper makes
The claims and statistics of this paper haven’t been checked yet.
Run the check — free, no account needed. It reads the open-access text and checks the sources it cites.
Claims other papers make about this one
Each is checked against this paper’s own text: does it say what the citing paper says it does?
In the citing paper
“Contrarily, other published reports showed evidence in mouse models that anti-TNF-a enhances the antitumor activity of combined anti-PD-1 and anti-CTLA-4 immunotherapy, 61 reinforces both CD8 T-cell-dependent immunity and anti-PD-1 therapy, by preventing anti-PD-1-induced cell death of tumor infiltrating lymphocytes as well as PD-L1 and T-cell immunoglobulin and mucin-domain containing-3 (Tim-3)”
From Autoimmune diseases and immune-checkpoint inhibitors for cancer therapy: Review of the literature and personalized risk-based prevention strategy (2020) · cites this paper as [62]
Self-check
Percentages, sums and reported differences re-computed from the paper’s own numbers.
The self-check needs the paper’s full text.
Citations
Cites
PD-1 and PD-L1 Immune Checkpoint Blockade to Treat Breast Cancer
Hartkopf, A. D., Taran, F., Wallwiener, M., Walter, C. B., Krämer, B., Grischke, E., & Brucker, S. Y. (2016) · Breast Care · doi:10.1159/000453569 · Cited by 30,989
Adverse Renal Effects of Immune Checkpoint Inhibitors: A Narrative Review
Wanchoo, R., Karam, S., Uppal, N. N., Barta, V. S., Deray, G., Devoe, C., Launay‐Vacher, V., Jhaveri, K. D., & on behalf of Cancer and Kidney International Network Workgroup on Immune Checkpoint Inhibitors (2017) · American Journal of Nephrology · doi:10.1159/000455014 · Cited by 15,320
Nivolumab versus docetaxel in advanced nonsquamous non-small-cell lung cancer
Borghaei, H., Paz-Ares, L., Horn, L., Spigel, D. R., Steins, M., Ready, N. E., Chow, L. Q., Vokes, E. E., Felip, E., Holgado, E., et al. (2015) · New England Journal of Medicine · doi:10.1056/nejmoa1507643 · Cited by 9,335 · cited 1×
“Thus, synergism of TNF/TNFR1 de fi ciency and anti-PD-1 is likely not restricted to melanoma but applies to other cancers, such as lung carcinoma, which can bene fi t from anti-PD-1 according to phase 2 and phase 3 clinical trials 25,26 .”
Combined Nivolumab and Ipilimumab or Monotherapy in Untreated Melanoma
Larkin, J., Chiarion-Sileni, V., Gonzalez, R., Grob, J. J., Cowey, C. L., Lao, C. D., Schadendorf, D., Dummer, R., Smylie, M., Rutkowski, P., et al. (2015) · New England Journal of Medicine · doi:10.1056/nejmoa1504030 · Cited by 8,157
PD-1 blockade induces responses by inhibiting adaptive immune resistance
Tumeh, P. C., Harview, C. L., Yearley, J. H., Shintaku, I. P., Taylor, E. J. M., Robert, L., Chmielowski, B., Spasic, M., Henry, G., Ciobanu, V., et al. (2014) · Nature · doi:10.1038/nature13954 · Cited by 6,609 · cited 2×
“We show here that TNF blockade leads to an increased content of CD8+ TILs, which is predictive of the response to anti-PD-1 in melanoma patients 33 .”
Pembrolizumab versus Ipilimumab in Advanced Melanoma
Robert, C., Schachter, J., Long, G. V., Arance, A., Grob, J. J., Mortier, L., Daud, A., Carlino, M. S., McNeil, C., Lotem, M., et al. (2015) · New England Journal of Medicine · doi:10.1056/nejmoa1503093 · Cited by 5,887
Primary, Adaptive, and Acquired Resistance to Cancer Immunotherapy
Sharma, P., Hu-Lieskovan, S., Wargo, J. A., & Ribas, A. (2017) · Cell · doi:10.1016/j.cell.2017.01.017 · Cited by 5,588
Nivolumab in Previously Untreated Melanoma without BRAF Mutation
Robert, C., Long, G. V., Brady, B., Dutriaux, C., Maio, M., Mortier, L., Hassel, J. C., Rutkowski, P., McNeil, C., Kalinka-Warzocha, E., et al. (2015) · New England Journal of Medicine · doi:10.1056/nejmoa1412082 · Cited by 5,519 · cited 2×
“In addition, responders develop severe immune-related adverse events (irAEs) with a frequency close to 12% 19,20 .”
An endotoxin-induced serum factor that causes necrosis of tumors
Carswell, E. A., Old, L. J., Kassel, R. L., Green, S., Fiore, N., & Williamson, B. (1975) · Proceedings of the National Academy of Sciences · doi:10.1073/pnas.72.9.3666 · Cited by 4,532 · cited 2×
“Whereas TNF was fi rst identi fi ed as a cytotoxic soluble factor 4 , mounting evidence indicates that TNF facilitates the accumulation and/or biological activity of regulatory T lymphocytes (Tregs) 12 , regulatory B lymphocytes (Bregs) 8 as well as myeloid-derived suppressor cells (MDSC) 9 , which…”
Genomic classification of cutaneous melanoma
Akbani, R., Akdemir, K. C., Aksoy, B. A., Albert, M., Ally, A., Amin, S. B., Arachchi, H., Arora, A., Auman, J. T., Ayala, B., et al. (2015) · Cell · doi:10.1016/j.cell.2015.05.044 · Cited by 3,151
Cited by
Sorted by citations
Items 101–200 of 384
Tuscano, J. M., Maverakis, E. M., Groshen, S. G., Tsao-Wei, D. D., Luxardi, G., Merleev, A. A., Beaven, A., DiPersio, J. F., Popplewell, L. L., Chen, R. E., et al. (2019) · Clinical Cancer Research · doi:10.1158/1078-0432.ccr-19-0438 · Cited by 47
“Importantly, in experimental systems, it has been demonstrated that TNF blockade can overcome resistance to anti–PD-1 therapy (21).”
BackgroundTNFα and Immune Checkpoint Inhibition: Friend or Foe for Lung Cancer?
Benoot, T., Piccioni, E., Ridder, K. D., & Goyvaerts, C. (2021) · International Journal of Molecular Sciences · doi:10.3390/ijms22168691 · Cited by 48
Combination of STING and TLR 7/8 Agonists as Vaccine Adjuvants for Cancer Immunotherapy
Bhatnagar, S., Revuri, V., Shah, M., Larson, P. G., Shao, Z., Yu, D., Prabha, S., Griffith, T. S., Ferguson, D. M., & Panyam, J. (2022) · Cancers · doi:10.3390/cancers14246091 · Cited by 46
“TNF-α can have either anti-cancer activity or behave as an immunosuppressive cytokine [42].”
Rounis, K., Makrakis, D., Tsigkas, A.-P., Georgiou, A., Galanakis, N., Papadaki, C., Monastirioti, A. A., Vamvakas, L. N., Kalbakis, K., Vardakis, N., et al. (2021) · Translational Lung Cancer Research · doi:10.21037/tlcr-21-460 · Cited by 46
“The vast majority of these processes have been demonstrated in experimental models to affect the Cancer-Immunity-Cycle (11) and to exert a negative effect on antitumor immunity (12-16).”
BackgroundProgresses and Perspectives of Anti-PD-1/PD-L1 Antibody Therapy in Head and Neck Cancers
Yang, B., Liu, T., Qu, Y., Liu, H., Zheng, S. G., Cheng, B., & Sun, J. (2018) · Frontiers in Oncology · doi:10.3389/fonc.2018.00563 · Cited by 47
Approaching Inflammation Paradoxes—Proinflammatory Cytokine Blockages Induce Inflammatory Regulators
Liu, M., Saredy, J., Zhang, R., Shao, Y., Sun, Y., Yang, W. Y., Wang, J., Liu, L., Drummer, C., Johnson, C., et al. (2020) · Frontiers in Immunology · doi:10.3389/fimmu.2020.554301 · Cited by 46
Chen, L., Jiang, X., Li, Y., Zhang, Q., Li, Q., Zhang, X., Zhang, M., Yu, Q., & Gao, D. (2022) · Clinical Immunology · doi:10.1016/j.clim.2022.108962 · Cited by 46
Yahata, T., Ibrahim, A. A., Fujimura, T., Uno, T., Terada, T., Hirano, K.-I., Hosokawa, H., Ohta, A., Miyata, T., & Ando, K. (2024) · Frontiers in Immunology · doi:10.3389/fimmu.2024.1365894 · Cited by 48
Immune checkpoint inhibitor–associated nephritis—treatment standard
Barbir, E.-B., Kitchlu, A., & Herrmann, S. M. (2024) · Nephrology Dialysis Transplantation · doi:10.1093/ndt/gfae184 · Cited by 52
Management of rheumatic complications of ICI therapy: a rheumatology viewpoint
Leipe, J., & Mariette, X. (2019) · Rheumatology · doi:10.1093/rheumatology/kez360 · Cited by 43
In Vivo Syngeneic Tumor Models with Acquired Resistance to Anti–PD-1/PD-L1 Therapies
Denis, M., Grasselly, C., Choffour, P., Wierinckx, A., Mathé, D., Chettab, K., Tourette, A., Talhi, N., Bourguignon, A., Birzele, F., et al. (2022) · Cancer Immunology Research · doi:10.1158/2326-6066.cir-21-0802 · Cited by 46
“On thebasisofour data andthosereported by Bertrandand colleagues showing that anti-TNF a mAb could enhance anti-PD-1 responses in melanoma,we testedthecombination ofanti-TNF a withtheanti-PD-1 mAb to boost the T-cell response in MC38 anti – PD-1-R model (26).”
BackgroundMethodTAK1 suppresses RIPK1-dependent cell death and is associated with disease progression in melanoma
Podder, B., Guttà, C., Rožanc, J., Gerlach, E., Feoktistova, M., Panayotova‐Dimitrova, D., Alexopoulos, L. G., Leverkus, M., & Rehm, M. (2019) · Cell Death and Differentiation · doi:10.1038/s41418-019-0315-8 · Cited by 40
Guyon, N., Garnier, D., Briand, J., Nadaradjane, A., Bougras-Cartron, G., Raimbourg, J., Campone, M., Heymann, D., Vallette, F. M., Frenel, J., et al. (2020) · Cell Death and Disease · doi:10.1038/s41419-020-03224-z · Cited by 40
Low, J. T., Christie, M., Ernst, M., Dumoutier, L., Preaudet, A., Ni, Y., Griffin, M. D. W., Mielke, L. A., Strasser, A., Putoczki, T. L., et al. (2020) · Gastroenterology · doi:10.1053/j.gastro.2020.06.039 · Cited by 39
Nishioka, N., Naito, T., Notsu, A., Mori, K. P., Kodama, H., Miyawaki, E., Miyawaki, T., Mamesaya, N., Kobayashi, H., Omori, S., et al. (2020) · Cancer Medicine · doi:10.1002/cam4.3631 · Cited by 38
Hamilton, J. A. G., Lee, M., Hunter, R., Ank, R. S., Story, J. Y., Talekar, G. R., Sisroe, T., Ballak, D. B., Fedanov, A., Porter, C. C., et al. (2021) · Aging Cell · doi:10.1111/acel.13309 · Cited by 37
“…significance between the rIL-37 + CAR Ts and IgG (No CAR Ts) treated groups, and “d” denoting significance between the rIL-37 + CAR Ts and rIL-37 (No CAR Ts) treated groups. n = 5 mice/group melanoma (Bertrand et al., 2017), we determined whether IL-37 antagonized TNF-α signaling in aged T-cells.”
BackgroundLim, J. U., & Yoon, H. K. (2020) · Cytokine · doi:10.1016/j.cyto.2020.155363 · Cited by 35
A20 regulates the therapeutic effect of anti-PD-1 immunotherapy in melanoma
Guo, W., Ma, J., Guo, S., Wang, H., Wang, S., Shi, Q., Liu, L., Zhao, T., Yang, F., Chen, S., et al. (2020) · Journal for ImmunoTherapy of Cancer · doi:10.1136/jitc-2020-001866 · Cited by 35
“13–15 To be specific, tumor necrosis factor-α (TNF-α ) that is a common proinflammatory cytokine and its downstream pathway could induce tumor immune escape by elevating the expressions of immune checkpoint molecules.”
Alexander, J. L., Ibraheim, H., Sheth, B., Little, J., Khan, M., Richards, C., Hunter, N., Chauhan, D., Ratnakumaran, R., Mchugh, K., et al. (2021) · Journal for ImmunoTherapy of Cancer · doi:10.1136/jitc-2021-002742 · Cited by 35
Zhang, Z., Zhang, C., Luo, Y., Zhang, G., Wu, P., Sun, N., & He, J. (2021) · Clinical and Translational Medicine · doi:10.1002/ctm2.525 · Cited by 34
Kim, J., Kang, S., Kim, K. W., Heo, M.-G., Park, D.-I., Lee, J., Lim, N. J., Min, D., & Won, C. (2021) · Biomaterials · doi:10.1016/j.biomaterials.2021.121257 · Cited by 35
Overcoming Acquired PD-1/PD-L1 Resistance with CD38 Blockade
Mittal, D., Vijayan, D., & Smyth, M. J. (2018) · Cancer Discovery · doi:10.1158/2159-8290.cd-18-0798 · Cited by 34
Steven, N. M., & Fisher, B. A. (2019) · Rheumatology · doi:10.1093/rheumatology/kez536 · Cited by 33
Gremese, E., Alivernini, S., Ferraccioli, E. S., & Ferraccioli, G. (2020) · Clinical Immunology · doi:10.1016/j.clim.2020.108395 · Cited by 33
Efentakis, P., Choustoulaki, A., Kwiatkowski, G., Varela, A., Kostopoulos, I. V., Tsekenis, G., Ntanasis‐Stathopoulos, I., Georgoulis, A., Vorgias, C. E., Gakiopoulou, H., et al. (2024) · Basic Research in Cardiology · doi:10.1007/s00395-024-01046-0 · Cited by 32
Javed, S. R., Skolariki, A., Zameer, M. Z., & Lord, S. (2024) · British Journal of Cancer · doi:10.1038/s41416-024-02833-1 · Cited by 38
Anti-TNF, a magic bullet in cancer immunotherapy?
Montfort, A., Dufau, C., Colacios, C., Andrieu‐Abadie, N., Levade, T., Filleron, T., Delord, J., Ayyoub, M., Meyer, N., & Ségui, B. (2019) · Journal for ImmunoTherapy of Cancer · doi:10.1186/s40425-019-0802-y · Cited by 32
Development of a TNF-α-mediated Trojan Horse for bacteria-based cancer therapy
Hu, C.-W., Chang, Y.-C., Liu, C.-H., Yu, Y., & Mou, Y. (2022) · Molecular Therapy · doi:10.1016/j.ymthe.2022.04.008 · Cited by 31
Dougan, M. L. (2020) · Current Gastroenterology Reports · doi:10.1007/s11894-020-0752-z · Cited by 33
Immune checkpoint inhibitor-induced diarrhea and colitis: an overview
Zoghbi, M., Burk, K. J., Haroun, E., Saadé, M., & Carreras, M. T. C. (2024) · Supportive Care in Cancer · doi:10.1007/s00520-024-08889-2 · Cited by 31
“This finding supports the development of combination therapy involving anti-PD-1 and anti-TNF for cancer patients [43].”
ResultKao, C., Charmsaz, S., Alden, S. L., Brancati, M., Li, H. L., Balaji, A., Munjal, K., Howe, K., Mitchell, S., Leatherman, J. M., et al. (2024) · Journal of Clinical Investigation · doi:10.1172/jci176567 · Cited by 33
Bird, B., Nally, K., Ronan, K. E., Clarke, G. A., Amu, S., Almeida, A. S., Flavin, R., & Finn, S. P. (2022) · Diagnostics · doi:10.3390/diagnostics12010124 · Cited by 29
Kramer, E. D., Tzetzo, S. L., Colligan, S. H., Hensen, M. L., Brackett, C. M., Clausen, B. E., Taketo, M. M., & Abrams, S. I. (2023) · JCI Insight · doi:10.1172/jci.insight.160978 · Cited by 31
“Conversely, another study demonstrated that systemic TNF-α blockade can both reduce the toxicities of and improve the response to immunotherapy in melanoma (78), suggesting that tumor response to TNF-α is tumor intrinsic and/or context dependent.”
BackgroundLucia, M. D., Cotugno, G., Bignone, V., Garzia, I., Nocchi, L., Langone, F., Petrovic, B., Sasso, E., Pepe, S., Froechlich, G., et al. (2020) · Molecular Therapy — Oncolytics · doi:10.1016/j.omto.2020.10.006 · Cited by 30
Walsh, M. J., Ali, L. R., Lenehan, P. J., Kureshi, C. T. S., Kureshi, R., Dougan, M. L., Knipe, D. M., & Dougan, S. K. (2023) · Immunotherapy Advances · doi:10.1093/immadv/ltad011 · Cited by 29
Liu, X., Xu, Y., Yin, L., Hou, Y., & Zhao, S. (2021) · International Journal of Nanomedicine · doi:10.2147/ijn.s318363 · Cited by 29
Cutaneous Adverse Reactions of Immunotherapy in Patients with Advanced Melanoma
Nikolaou, V. A., Tsimpidakis, A., & Stratigos, A. (2023) · Cancers · doi:10.3390/cancers15072084 · Cited by 28
Badran, Y. R., Zou, F., Durbin, S., Dutra, B. E., Abu‐Sbeih, H., Thomas, A. S., Altan, M., Thompson, J. A., Qiao, W., Leet, D., et al. (2023) · Journal for ImmunoTherapy of Cancer · doi:10.1136/jitc-2023-007195 · Cited by 29
Enhancing HCC Treatment: innovatively combining HDAC2 inhibitor with PD-1/PD-L1 inhibition
Han, R., Ling, C., Wang, Y., & Lu, L. (2023) · Cancer Cell International · doi:10.1186/s12935-023-03051-0 · Cited by 29
“This process is regulated by the level of acetylation at Lys 263 in the C-tail of PD-L1, which is controlled by HDAC2 [28–31].”
BackgroundEnhancing cancer immunotherapy via inhibition of soluble epoxide hydrolase
Kelly, A. G., Wang, W., Rothenberger, E., Yang, J., Gilligan, M. M., Kipper, F. C., Attaya, A., Gartung, A., Hwang, S. H., Gillespie, M. J., et al. (2024) · Proceedings of the National Academy of Sciences · doi:10.1073/pnas.2314085121 · Cited by 30
“In pre - clinical models, inhibition of TNF α and IL6 enhances antitu mor immunity by boosting T - cell responses (19, 95).”
Young, J. S., Dayani, F., Morshed, R. A., Okada, H., & Aghi, M. K. (2019) · World Neurosurgery · doi:10.1016/j.wneu.2018.12.222 · Cited by 29
Ali, L. R., Lenehan, P. J., Cardot‐Ruffino, V., Costa, A. D., Katz, M. H. G., Bauer, T. W., Nowak, J. A., Wolpin, B. M., Abrams, T. A., Patel, A. K., et al. (2023) · Clinical Cancer Research · doi:10.1158/1078-0432.ccr-23-1444 · Cited by 28
“TNF a is a plausible candidate, and TNF a blockade has been shown in mouse models to improve responses to PD-1 blockade and other immunotherapies (39, 40).”
Yang, Y., Wang, C., Sun, H., Jiang, Z., Zhang, Y. X., & Pan, Z. (2020) · Cancer Gene Therapy · doi:10.1038/s41417-020-0186-7 · Cited by 29
Marcq, E., Audenaerde, J. R. M. V., Waele, J. D., Merlin, C., Pauwels, P., van Meerbeeck, J. P., Fisher, S. A., & Smits, E. (2021) · Cancers · doi:10.3390/cancers13020282 · Cited by 27
“Although IFN γ , IL-2, IL-10, and TNF-α are described as pro-inflammatory [22,23], it should be kept in mind that IL-2 and IL-10 function via a negative feedback loop, and therefore they can also have an anti-inflammatory function depending on the context [24,25].”
BackgroundInnate Immune Defense Mechanisms by Myeloid Cells That Hamper Cancer Immunotherapy
Lebegge, E., Arnouk, S. M., Bardet, P. M. R., Kiss, M., Raes, G., & Ginderachter, J. A. V. (2020) · Frontiers in Immunology · doi:10.3389/fimmu.2020.01395 · Cited by 27
“In addition, TNFα induced upon anti-PD-1 immune checkpoint blockade, increases PD-L1 and TIM-3 expression on tumor-infiltrating T cells and promotes their cell death upon TNFα binding to TNFRs (50).”
BackgroundHRG switches TNFR1-mediated cell survival to apoptosis in Hepatocellular Carcinoma
Zou, X., Zhang, D., Song, Y., Liu, S., Qian, L., Yao, L., Li, W., Duan, Z., Wu, D., & Liu, L. (2020) · Theranostics · doi:10.7150/thno.47286 · Cited by 27
The Paradoxical Roles of Inflammation during PD-1 Blockade in Cancer
Hill, M., Segovia, M., Russo, S., Girotti, M. R., & Rabinovich, G. A. (2020) · Trends in Immunology · doi:10.1016/j.it.2020.09.003 · Cited by 26
Checkpoint blockade toxicities: Insights into autoimmunity and treatment
Walsh, M. J., & Dougan, M. L. (2021) · Seminars in Immunology · doi:10.1016/j.smim.2021.101473 · Cited by 27
Ho, W. J., Yarchoan, M. M., Charmsaz, S., Munday, R. M., Danilova, L., Sztein, M. B., Fertig, E. J., & Jaffee, E. M. (2019) · JCI Insight · doi:10.1172/jci.insight.132286 · Cited by 27
“In line with these reports, emerging evidence suggests blocking TNF may enhance anti-PD1 therapy (29, 30).”
ResultMehdi, A., Attias, M., Mahmood, N., Arakelian, A., Mihalcioiu, C. L. D., Piccirillo, C. A., Szyf, M., & Rabbani, S. A. (2020) · Frontiers in Oncology · doi:10.3389/fonc.2020.01361 · Cited by 25
Tasaki, M., YAMASHITA, M., Arai, Y., Nakamura, T., & Nakao, S. (2021) · Cancer Immunology Immunotherapy · doi:10.1007/s00262-021-02947-y · Cited by 25
“First, we evaluated the antitumor activity of a recombinant oncolytic vaccinia virus carrying transgenes to express human IL-7 and murine IL-12 (hIL-7/mIL-12-VV) and compared it to a virus expressing human IL-7 (hIL-7-VV; human IL-7 is reactive for mouse immune cells [21]), murine IL-12 (mIL-12-VV) or neither cytokine…”
MethodTumor immunotherapy: Mechanisms and clinical applications
Nong, C., Guan, P., Li, L., Zhang, H., & Hu, H. (2022) · MedComm – Oncology · doi:10.1002/mog2.8 · Cited by 27
Matsuo, N., Azuma, K., Murotani, K., Murata, D., Matama, G., Kawahara, A., Kojima, T., Tokito, T., & Hoshino, T. (2023) · Thoracic Cancer · doi:10.1111/1759-7714.14881 · Cited by 26
Qin, G., Bai, F., Hu, H., Zhang, J., Zhan, W., Wu, Z., Li, J., Fu, Y., & Deng, Y. (2024) · Molecular Medicine · doi:10.1186/s10020-024-00780-4 · Cited by 24
Advancements and challenges in immunocytokines: A new arsenal against cancer
Shi, W., Liu, N., & Lu, H. (2024) · Acta Pharmaceutica Sinica B · doi:10.1016/j.apsb.2024.07.024 · Cited by 25
“Initially recognized for its cytotoxic properties, TNF-a is now understood to also have an immunosuppressive function, promoting the accumulation and/or activity of Tregs, regulatory B lymphocytes (Bregs), as well as MDSCs 98 .”
Yang, L., Dong, X., Xing, X., Cui, X., Li, L., & Zhang, L. (2020) · World Journal of Gastrointestinal Oncology · doi:10.4251/wjgo.v12.i11.1346 · Cited by 25
Zhou, C., Sun, B., Zhou, P., Yang, Z., Wang, Z.-T., Liu, G., Gan, W., Wang, Z., Zhou, J., Fan, J., et al. (2023) · Clinical Immunology · doi:10.1016/j.clim.2023.109770 · Cited by 24
Understanding and Overcoming the Inflammatory Toxicities of Immunotherapy
Dougan, M. L. (2020) · Cancer Immunology Research · doi:10.1158/2326-6066.cir-20-0372 · Cited by 24
“In animal models, inhibition of TNFa and IL6 improves antitumor immunity by enhancing T-cell responses (1, 52).”
Enhanced Immunotherapeutic Efficacy of Anti–PD-L1 Antibody in Combination with an EP4 Antagonist
Sajiki, Y., Konnai, S., Cai, Z., Takada, K., Okagawa, T., Maekawa, N., Fujisawa, S., Kato, Y., Suzuki, Y., Murata, S., et al. (2020) · ImmunoHorizons · doi:10.4049/immunohorizons.2000089 · Cited by 24
“Furthermore, recent studies have shown that the blockade ofTNF-a improves the efficacy of PD-1blockade (50, 51); however, the underlying detailed mechanism has not been fully elucidated.”
BackgroundMinz, A. P., Mohapatra, D., Dutta, M., Sethi, M., Parida, D., Mohapatra, A. P., Mishra, S., Kar, S., Sasmal, P. K., & Senapati, S. (2023) · Cancer Immunology, Immunotherapy · doi:10.1007/s00262-023-03562-9 · Cited by 24
“Earlier reports have established the effects of IL-6 /TNF-α in inducing PD-L1 in various cancer cells like thyroid and melanoma cancer thereby facilitating immune escape in cancer cells [42–45].”
BackgroundMcCulloch, T. R., Rossi, G. R., Alim, L., Lam, P. Y., Wong, J. K. M., Coleborn, E., Kumari, S., Keane, C., Kueh, A. J., Herold, M. J., et al. (2024) · Nature Communications · doi:10.1038/s41467-024-54232-y · Cited by 23
“In T cells, TNF has been associated with dysfunction during chronic viral infection and cancer through upregulation of programmed cell death protein 1 (PD-1) and T cell immunoglobulin and mucin domain-containing protein 3 (Tim3), as well as impairment of cytokine production 11,12 .”
Chatzidionysiou, K., Liapi, M., Tsakonas, G., Gunnarsson, I., & Catrina, A. (2020) · Clinical Rheumatology · doi:10.1007/s10067-020-05420-w · Cited by 24
“In addition to that, there seems to be a potential synergistic effect of TNF inhibitors with CPI [55, 56].”
BackgroundSenescence and Aging: Does It Impact Cancer Immunotherapies?
Maggiorani, D., & Beausejour, C. M. (2021) · Cells · doi:10.3390/cells10071568 · Cited by 25
Shen, J., Qiu, Z., Wu, Q., Zhang, G., Harris, R., Sun, D., Rantala, J., Barshop, W. D., Zhao, L., Lv, D., et al. (2022) · Molecular Cell · doi:10.1016/j.molcel.2022.01.022 · Cited by 24
“4T1-luc tumors exhibited poor response to anti-PD-1 treatment (Figures 6H and 6I), corroborating a previous report (Bertrand et al., 2017).”
ResultRetractedDeng, Y., Zhao, L., Huang, X., Zeng, Y., Xiong, Z., & Zuo, M. (2022) · Nutrition · doi:10.1016/j.nut.2022.111829 · Cited by 27
Fuente, F. D. L., Belkhir, R., Henry, J., Nguyen, C. D., Pham, T., Germain, V., Gavand, P., Labadie, C., Brière, C., Lauret, A., et al. (2022) · RMD Open · doi:10.1136/rmdopen-2022-002612 · Cited by 23
The prospect of tumor microenvironment-modulating therapeutical strategies
Eulberg, D., Frömming, A., Lapid, K., Mangasarian, A., & Barak, A. F. (2022) · Frontiers in Oncology · doi:10.3389/fonc.2022.1070243 · Cited by 24
Immunological analyses reveal an immune subtype of uveal melanoma with a poor prognosis
Pan, H., Lu, L., Cui, J., Yang, Y., Wang, Z., & Fan, X. (2020) · Aging · doi:10.18632/aging.102693 · Cited by 22
Toward Systems Biomarkers of Response to Immune Checkpoint Blockers
Lapuente-Santana, Ó., & Eduati, F. (2020) · Frontiers in Oncology · doi:10.3389/fonc.2020.01027 · Cited by 23
“These cytokines induce PD-L1 expression through JAK-STAT and NF-kB signaling, inducting acquired resistance to the immune response (75, 76).”
BackgroundInfliximab for Treatment of Immune Adverse Events and Its Impact on Tumor Response
Parvathareddy, V., Selamet, U., Sen, A. A., Mamlouk, O., Song, J., Page, V. D., Abdelrahim, M., Diab, A. K., Abdel‐Wahab, N., & Abudayyeh, A. (2023) · Cancers · doi:10.3390/cancers15215181 · Cited by 22
Biologic treatment of psoriasis in oncologic patients
Rusiñol, L., Camiña‐Conforto, G., & Puig, L. (2022) · Expert Opinion on Biological Therapy · doi:10.1080/14712598.2022.2152322 · Cited by 23
“kinumab, IL-17 and IL-23 inhibitors can be used in patients with cancer, always evaluating the case individually, considering patients’ wills and alternatives, assessing remission times, and assuming the limitations in available evidence[30,65,69].”
BackgroundBa, H., Dai, Z., Zhang, Z., Zhang, P., Yin, B., Wang, J., Li, Z., & Zhou, X. (2023) · Journal for ImmunoTherapy of Cancer · doi:10.1136/jitc-2021-003837 · Cited by 24
Immunotherapy in Melanoma: Recent Advancements and Future Directions
Mooradian, M. J., & Sullivan, R. J. (2023) · Cancers · doi:10.3390/cancers15164176 · Cited by 23
Pandey, S., Anang, V., & Schumacher, M. M. (2024) · International review of cytology · doi:10.1016/bs.ircmb.2024.01.006 · Cited by 24
Selvin, T., Berglund, M., Lenhammar, L., Jarvius, M., Nygren, P., Fryknäs, M., Larsson, R., & Andersson, C. R. (2023) · BMC Cancer · doi:10.1186/s12885-023-10645-4 · Cited by 21
“Blocking TNF-α has emerged as a possible strategy to improve anti-cancer responses to ICI treatment as it is thought to enhance specific immune responses by limiting activation-induced cell death of cytotoxic T cells [33], [34].”
BackgroundAdvancements in CRISPR screens for the development of cancer immunotherapy strategies
Li, Y.-R., Lyu, Z., Tian, Y., Fang, Y., Zhu, Y., Chen, Y., & Yang, L. (2023) · Molecular Therapy — Oncolytics · doi:10.1016/j.omto.2023.100733 · Cited by 23
“65 In an in vitro genome-wide screening, Zhang et al. 50 demonstrated that inhibition of RNF31, an E3 ubiquitin ligase, disrupted the cell-ligand-bound TNF receptor complex 1, leading to the loss of A20 and non-canonical IKK complexes and ultimately promoted tumor apoptosis.”
BackgroundTNFR1 signaling promotes pancreatic tumor growth by limiting dendritic cell number and function
Alam, M. S., Gaida, M. M., Witzel, H. R., Otsuka, S., Abbasi, A. J., Guerin, T. M., Abdelmaksoud, A. A., Wong, N. W., Cam, M., Kozlov, S., et al. (2024) · Cell Reports Medicine · doi:10.1016/j.xcrm.2024.101696 · Cited by 21
Ebelt, N., Zuniga, E., Marzagalli, M., Zamloot, V., Blazar, B., Salgia, R., & Manuel, E. R. (2020) · Biomedicines · doi:10.3390/biomedicines8120617 · Cited by 21
“Lower doses from previously published regimens of anti-PD-1 [34,42] and anti-CTLA-4 [43,44] were chosen to more readily observe potential synergy with shIDO-ST.”
Miyawaki, T., Naito, T., Yabe, M., Kodama, H., Nishioka, N., Miyawaki, E., Mamesaya, N., Kobayashi, H., Omori, S., Wakuda, K., et al. (2021) · Supportive Care in Cancer · doi:10.1007/s00520-021-06572-4 · Cited by 22
Lin, W., Wang, X., Xu, Z., Wang, Z., Liu, T., Cao, Z., Feng, X., Gao, Y., & He, J. (2021) · Cancer Cell International · doi:10.1186/s12935-021-02358-0 · Cited by 21
Miyawaki, T., Naito, T., Doshita, K., Kodama, H., Mori, M., Nishioka, N., Iida, Y., Miyawaki, E., Mamesaya, N., Kobayashi, H., et al. (2022) · Thoracic Cancer · doi:10.1111/1759-7714.14529 · Cited by 19
Zhang, H., Xu, X., Xu, R. F., & Ye, T. (2022) · Frontiers in Oncology · doi:10.3389/fonc.2022.989167 · Cited by 20
“In addition, recent studies suggested that TNF-a and metalloproteases were key players in melanoma cells aggressiveness (62, 63).”
BackgroundPhase I trial of the TNF-α inhibitor certolizumab plus chemotherapy in stage IV lung adenocarcinomas
Paik, P. K., Luo, J., Ai, N., Kim, R. Y., Ahn, L. S. H., Biswas, A., Coker, C., Ma, W., Wong, P., Buonocore, D. J., et al. (2022) · Nature Communications · doi:10.1038/s41467-022-33719-6 · Cited by 20
Fn14 and TNFR2 as regulators of cytotoxic TNFR1 signaling
Siegmund, D., Zaitseva, O., & Wajant, H. (2023) · Frontiers in Cell and Developmental Biology · doi:10.3389/fcell.2023.1267837 · Cited by 20
From cachexia to obesity: the role of host metabolism in cancer immunotherapy
Brocco, D., Marino, P. D., & Grassandonia, A. (2019) · Current Opinion in Supportive and Palliative Care · doi:10.1097/spc.0000000000000457 · Cited by 20
Anti-PD-1 immunotherapy in advanced metastatic melanoma: State of the art and future challenges
Moreira, R. S., Bicker, J., Musicco, F., Persichetti, A., & Pereira, A. M. P. T. (2019) · Life Sciences · doi:10.1016/j.lfs.2019.117093 · Cited by 23
Wei, J., Moon, J., Yasumizu, Y., Zhang, L., Radassi, K., Buitrago-Pocasangre, N., Deerhake, M. E., Strauli, N. B., Chen, C.-W., Herman, A. E., et al. (2025) · Journal of Clinical Investigation · doi:10.1172/jci182790 · Cited by 27
“Changes in MFI were tested using a generalized linear model with Gaussian distribution and a log link function.”
Regulation of tumor growth by leukocyte-specific protein 1 in T cells
Kwon, R., Hong, B., Lee, K.-G., Choi, E., Sabbagh, L., Cho, C., Lee, N., & Kim, W. (2020) · Journal for ImmunoTherapy of Cancer · doi:10.1136/jitc-2020-001180 · Cited by 20
TNF-α-Secreting Lung Tumor-Infiltrated Monocytes Play a Pivotal Role During Anti-PD-L1 Immunotherapy
Ridder, K. D., Locy, H., Piccioni, E., Zuazo, M., Awad, R. M., Verhulst, S., Bulck, M. V., Vlaeminck, Y. D., Lecocq, Q., Reijmen, E., et al. (2022) · Frontiers in Immunology · doi:10.3389/fimmu.2022.811867 · Cited by 21
“Encouraged by these data and previous reports on TNF-a blockade to improve anti-PD-1 therapy efficacy in a mouse model of melanoma and colon carcinoma (33, 34), we evaluated the therapeutic potential of TNF-a and PD-L1 co-blockade in the LLC-Fluc model.”
Zhao, L., Jin, Y., Yang, C., & Li, C. (2020) · Clinical & Experimental Immunology · doi:10.1111/cei.13470 · Cited by 19
KIR+ CD8+ T Lymphocytes in Cancer Immunosurveillance and Patient Survival: Gene Expression Profiling
Gimeno, L., Serrano-López, E. M., Campillo, J. A., Cánovas-Zapata, M. A., Acuña, O. S., García-Cózar, F., Martínez-Sánchez, M. V., Martínez-Hernández, M. D., Soto-Ramírez, M. F., López-Cubillana, P., et al. (2020) · Cancers · doi:10.3390/cancers12102991 · Cited by 17
“TNFRSF1B controls the expression of the inhibitory receptor Tim3 [37] and promotes cell death [38].”
BackgroundImmunocytokines and cytokine neutralization for cancer immunotherapy
Berraondo, P., Cuesta, R., Aranda, F., Riaño, A. M., Eguren‐Santamaría, I., Luri‐Rey, C., Risson, A., Melero, A., Gomis, G., & Melero, I. (2025) · Trends in cancer · doi:10.1016/j.trecan.2025.04.014 · Cited by 19
Wang, X., Wang, J., Wang, Q., Ding, G., Huang, Y., & Feng, Y. (2026) · Biochimica et Biophysica Acta (BBA) - Reviews on Cancer · doi:10.1016/j.bbcan.2026.189536 · Cited by 19
TNF-α inhibitor ameliorates immune-related arthritis and pneumonitis in humanized mice
Gao, J., Miao, J., Sun, H., Fu, X., Zhang, P., Chen, Z., & Zhu, P. (2022) · Frontiers in Immunology · doi:10.3389/fimmu.2022.955812 · Cited by 19
“In a mouse melanoma model, the author demonstrated that TNF impairs the accumulation of CD8 T cells in tumor-draining lymph nodes and tumors in a TNFR1-dependent manner (61, 62).”
BackgroundRole of inflammasome activation in tumor immunity triggered by immune checkpoint blockers
Segovia, M., Russo, S., Girotti, M. R., Rabinovich, G. A., & Hill, M. (2020) · Clinical & Experimental Immunology · doi:10.1111/cei.13433 · Cited by 17
Update on Immune Checkpoint Inhibitor Enterocolitis
Kelly‐Goss, M. R., Badran, Y. R., & Dougan, M. L. (2022) · Current Gastroenterology Reports · doi:10.1007/s11894-022-00852-7 · Cited by 18
Lv, C., Yuan, D., & Cao, Y. (2020) · Journal of Pharmacology and Experimental Therapeutics · doi:10.1124/jpet.120.000284 · Cited by 17
Lafont, É. (2020) · Cancers · doi:10.3390/cancers12051113 · Cited by 18
“For instance, the Ségui’s laboratory reported that TNFR1 mediates the Activation-Induced Cell Death (AICD) of CD8+ melanoma-specific tumour infiltrating lymphocytes (TILs) [93] and that combining anti-TNF and anti-PD-1 promotes the regression of murine melanoma [94].”
BackgroundMorrissey, M. E., Byrne, R., Nulty, C., McCabe, N., Lynam‐Lennon, N., Butler, C. T., Kennedy, S. A., O’Toole, D., Larkin, J. O., McCormick, P. H., et al. (2020) · BMC Cancer · doi:10.1186/s12885-020-07012-y · Cited by 17
“As the oesophageal TME appears to be less inhibitory compared to colonic adenocarcinoma, this may have implications for informing immunotherapy, such as DC vaccines, and PD-1/PDL1 or TNF-α blockade [56, 72, 73].”
BackgroundInfluentialJacoberger-Foissac, C., Blake, S. J., Liu, J., McDonald, E., Triscott, H., Nakamura, K., Smyth, M. J., & Teng, M. W. L. (2020) · Journal for ImmunoTherapy of Cancer · doi:10.1136/jitc-2020-001687 · Cited by 17
Metadata
- Authors
- Bertrand, F., Montfort, A., Marcheteau, E., Imbert, C., Gilhodes, J., Filleron, T., Rochaix, P., Andrieu-Abadie, N., Levade, T., Meyer, N., Colacios, C., & Ségui, B.
- Affiliations
- Inserm (FR)
- Université Toulouse III - Paul Sabatier (FR)
- Corresponding author
- Ségui, Bruno
- ORCID
- Venue
- Nature Communications
- Published
- 2017-12-22
- Volume
- 8
- Issue
- 1
- Pages
- 2256-2256
- ISSN
- 2041-1723 (ISSN-L)
- PMC
- PMC5741628
- OpenAlex
- W2779658193
- Cited by
- 384
- References
- 46
- Citations by year
- 2026: 32 · 2025: 36 · 2024: 44 · 2023: 44 · 2022: 49 · 2021: 50 · 2020: 82 · 2019: 29 · 2018: 17
- FWCI
- 15.43
- Type
- journal article
- Language
- en
- Open access
- gold
- doi.org
- Locations
- Nature Communications (publishedVersion, cc-by)
- Europe PMC (PubMed Central) (publishedVersion, cc-by)
- PubMed Central (publishedVersion, cc-by)
- PubMed (publishedVersion)
- HAL (submittedVersion, cc-by)
- RePEc: Research Papers in Economics (submittedVersion)
- DOAJ (DOAJ: Directory of Open Access Journals) (submittedVersion)
- DOAJ (DOAJ: Directory of Open Access Journals) (submittedVersion, cc-by-sa)
- Funders
- Institut National de la Santé et de la Recherche Médicale (INSERM U1048, U1043, U1048)
- Institut National Du Cancer
- Fondation Toulouse Cancer Santé
- Inserm Transfert
- Topics
- Health Sciences › Medicine › Oncology › Cancer Immunotherapy and Biomarkers
- Life Sciences › Immunology and Microbiology › Immunology › T-cell and B-cell Immunology
- Life Sciences › Immunology and Microbiology › Immunology › Immunotherapy and Immune Responses
- Keywords
- anti-PD-1 therapy, melanoma, immune checkpoint inhibitor resistance, TNFR1 signaling, tumor-infiltrating lymphocytes, CD8+ T cells, PD-L1, TIM-3, combination immunotherapy, immune-related adverse events, cancer immunotherapy
- MeSH terms
- Hepatitis A Virus Cellular Receptor 2, Antineoplastic Agents, Immunological, Ipilimumab, Nivolumab, Animals, Antibodies, Monoclonal, Drug Synergism, Female, Humans, Melanoma, Melanoma, Experimental, Skin Neoplasms, Tumor Necrosis Factor-alpha, Mammary Neoplasms, Animal, Lymphocytes, Tumor-Infiltrating, CD8-Positive T-Lymphocytes, Drug Resistance, Neoplasm, Cell Line, Tumor, Receptors, Tumor Necrosis Factor, Type I, Mice, B7-H1 Antigen, Programmed Cell Death 1 Receptor
About these checks
Registry, retraction, Cites and statistics results are computed, not judged, with one exception: a printed reference that no index lists is read once by a model before it counts as a citation error. Claims are extracted by a model and kept only when their quote appears verbatim in the text; each cited source is then checked, with a model’s help, for whether it says what the claim relies on. Those verdicts can be wrong — read the claim’s quote and the cited source before relying on one.
Statistics and arithmetic are recomputed, not judged.
Confidence bands are shown only for fields calibrated on our annotated test set. None is calibrated yet, so no band is shown.
What counts as a claim ›How we measure confidence ›How we check this ›
Are you an author, or do you see a problem with this page? Request a review
