

The DOI matches its Crossref record; 73 of the 74 references it cites were found in a registry or an index.
Bifunctional immune checkpoint-targeted antibody-ligand traps that simultaneously disable TGFβ enhance the efficacy of cancer immunotherapy
Open accessAbstract
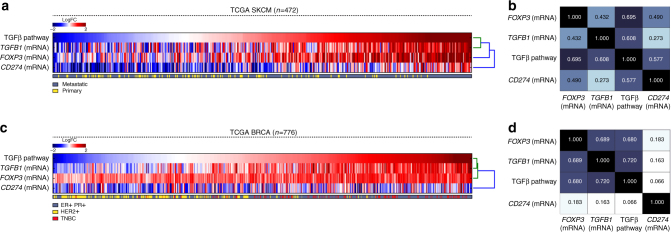
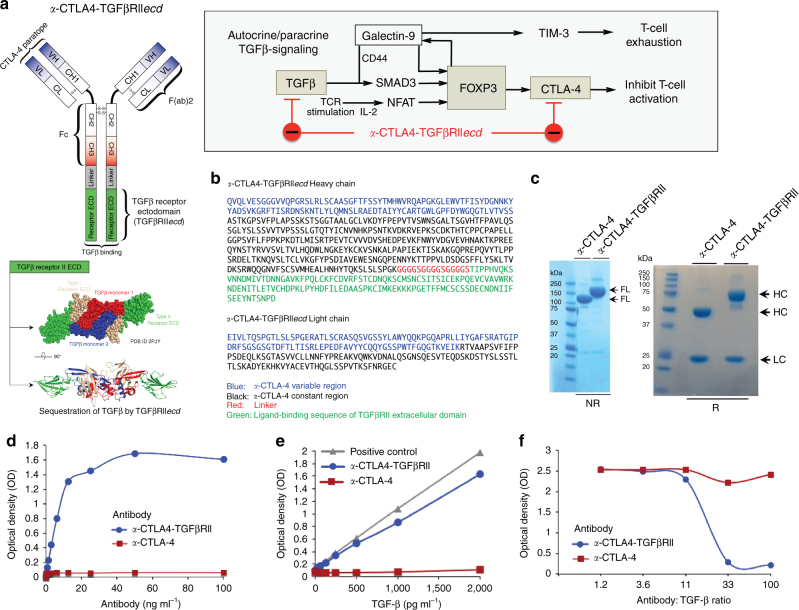
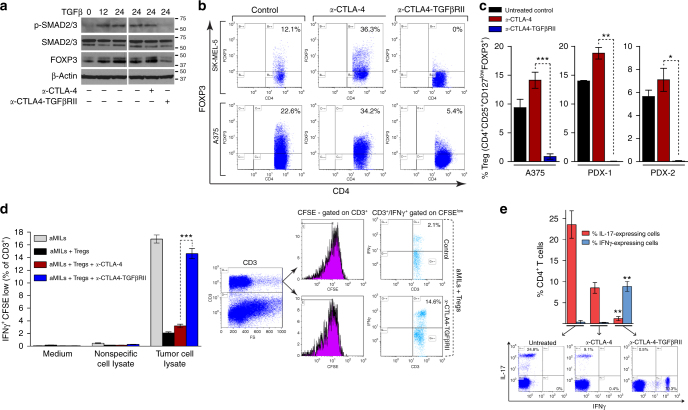
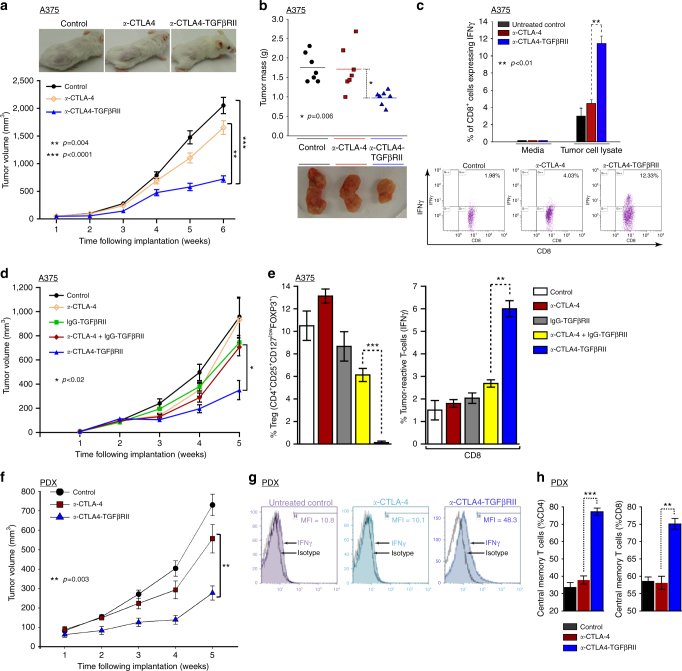
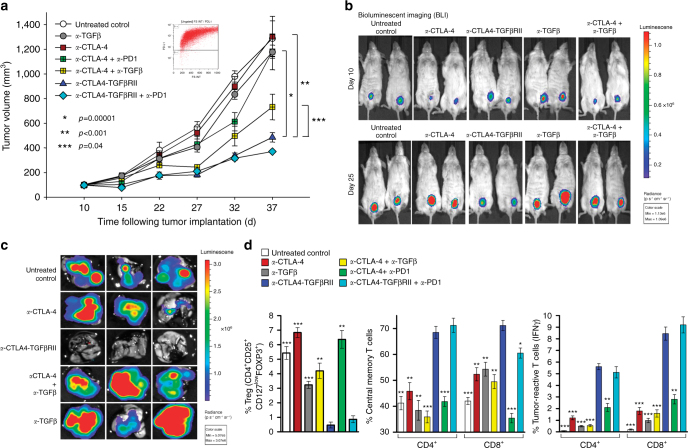
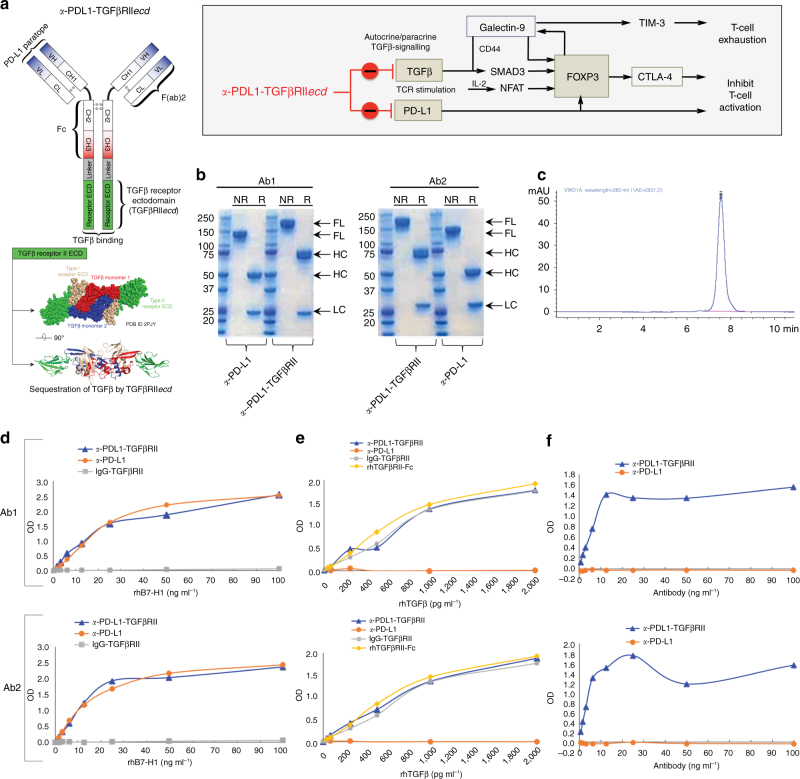
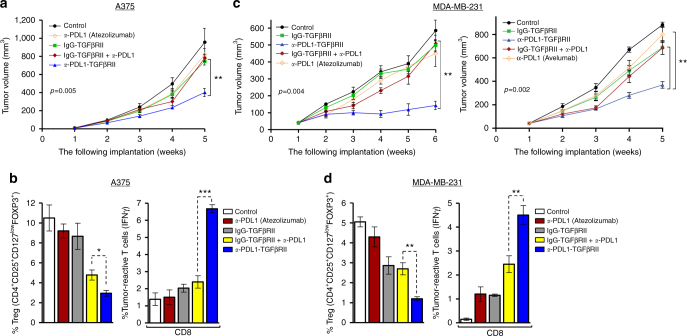
Abstract A majority of cancers fail to respond to immunotherapy with antibodies targeting immune checkpoints, such as cytotoxic T-lymphocyte antigen-4 (CTLA-4) or programmed death-1 (PD-1)/PD-1 ligand (PD-L1). Cancers frequently express transforming growth factor-β (TGFβ), which drives immune dysfunction in the tumor microenvironment by inducing regulatory T cells (Tregs) and inhibiting CD8+ and TH1 cells. To address this therapeutic challenge, we invent bifunctional antibody–ligand traps (Y-traps) comprising an antibody targeting CTLA-4 or PD-L1 fused to a TGFβ receptor II ectodomain sequence that simultaneously disables autocrine/paracrine TGFβ in the target cell microenvironment (a-CTLA4-TGFβRIIecd and a-PDL1-TGFβRIIecd). a-CTLA4-TGFβRIIecd is more effective in reducing tumor-infiltrating Tregs and inhibiting tumor progression compared with CTLA-4 antibody (Ipilimumab). Likewise, a-PDL1-TGFβRIIecd exhibits superior antitumor efficacy compared with PD-L1 antibodies (Atezolizumab or Avelumab). Our data demonstrate that Y-traps counteract TGFβ-mediated differentiation of Tregs and immune tolerance, thereby providing a potentially more effective immunotherapeutic strategy against cancers that are resistant to current immune checkpoint inhibitors.
Overview
The claims and statistics of this paper haven’t been checked yet.
Run the check — free, no account needed. It reads the open-access text and checks the sources it cites.
Integrity signals
Registry
Cites
Statistics
Figures
Verification
Claims the paper makes
The claims and statistics of this paper haven’t been checked yet.
Run the check — free, no account needed. It reads the open-access text and checks the sources it cites.
Claims other papers make about this one
Each is checked against this paper’s own text: does it say what the citing paper says it does?
In the citing paper
“Further engineering led to the development of a smaller ligand trap with a 100–1000-fold increased ligand-binding efficacy311.”
From TGFβ biology in cancer progression and immunotherapy (2021) · cites this paper as [311]
In the citing paper
“pharmacological inhibition of TGFb or its receptors resolves immunological exclusion and improves antigen presentation by malignant cells, culminating in potent anticancer immune responses that can be actioned with ICIs toward disease eradication and establishment of protective immunological memory, at least in mouse models of melanoma”
From Immunomodulation by targeted anticancer agents (2021) · cites this paper as Ravi et al., 2018
Self-check
Percentages, sums and reported differences re-computed from the paper’s own numbers.
The self-check needs the paper’s full text.
Citations
Cites
PD-1 and PD-L1 Immune Checkpoint Blockade to Treat Breast Cancer
Hartkopf, A. D., Taran, F., Wallwiener, M., Walter, C. B., Krämer, B., Grischke, E., & Brucker, S. Y. (2016) · Breast Care · doi:10.1159/000453569 · Cited by 30,989
Adverse Renal Effects of Immune Checkpoint Inhibitors: A Narrative Review
Wanchoo, R., Karam, S., Uppal, N. N., Barta, V. S., Deray, G., Devoe, C., Launay‐Vacher, V., Jhaveri, K. D., & on behalf of Cancer and Kidney International Network Workgroup on Immune Checkpoint Inhibitors (2017) · American Journal of Nephrology · doi:10.1159/000455014 · Cited by 15,320
Improved Survival with Ipilimumab in Patients with Metastatic Melanoma
Hodi, F. S., O'Day, S. J., McDermott, D. F., Weber, R. W., Sosman, J. A., Haanen, J. B., Gonzalez, R., Robert, C., Schadendorf, D., Hassel, J. C., et al. (2010) · New England Journal of Medicine · doi:10.1056/nejmoa1003466 · Cited by 15,155
The blockade of immune checkpoints in cancer immunotherapy
Pardoll, D. M. (2012) · Nature Reviews Cancer · doi:10.1038/nrc3239 · Cited by 13,838
Nivolumab versus docetaxel in advanced nonsquamous non-small-cell lung cancer
Borghaei, H., Paz-Ares, L., Horn, L., Spigel, D. R., Steins, M., Ready, N. E., Chow, L. Q., Vokes, E. E., Felip, E., Holgado, E., et al. (2015) · New England Journal of Medicine · doi:10.1056/nejmoa1507643 · Cited by 9,335
Control of Regulatory T Cell Development by the Transcription Factor Foxp3
Hori, S., Nomura, T., & Sakaguchi, S. (2003) · Science · doi:10.1126/science.1079490 · Cited by 8,187
Foxp3 programs the development and function of CD4+CD25+ regulatory T cells
Fontenot, J. D., Gavin, M. A., & Rudensky, A. Y. (2003) · Nature Immunology · doi:10.1038/ni904 · Cited by 7,745
Bettelli, E., Carrier, Y., Gao, W., Korn, T., Strom, T. B., Oukka, M., Weiner, H. L., & Kuchroo, V. K. (2006) · Nature · doi:10.1038/nature04753 · Cited by 6,992
Cancer Immunoediting: Integrating Immunity’s Roles in Cancer Suppression and Promotion
Schreiber, R. D., Old, L. J., & Smyth, M. J. (2011) · Science · doi:10.1126/science.1203486 · Cited by 6,474
Regulatory T Cells and Immune Tolerance
Sakaguchi, S., Yamaguchi, T., Nomura, T., & Ono, M. (2008) · Cell · doi:10.1016/j.cell.2008.05.009 · Cited by 5,485
Research works printed but not linked: 2
- Bedi, A. & Ravi, R. Compositions and methods for targeted immunomodulatory antibodies and fusion proteins. US patent 8,993,524 (2011).
- Bedi, A. & Ravi, R. Compositions and methods for targeted immunomodulatory antibodies and fusion proteins. US patent 9,850,306 (2011).
Cited by
Sorted by citations
Items 101–200 of 342
The Progress and Prospects of Immune Cell Therapy for the Treatment of Cancer
Han, J., Zhang, B., Zheng, S., Jiang, Y. H., Zhang, X., & Mao, K. (2024) · Cell Transplantation · doi:10.1177/09636897241231892 · Cited by 57
Unraveling resistance to immunotherapy in MSI-high colorectal cancer
Heregger, R., Huemer, F., Steiner, M., Gonzalez-Martinez, A., Greil, R., & Weiss, L. (2023) · Cancers · doi:10.3390/cancers15205090 · Cited by 52
Danielpour, D. (2024) · Pharmaceuticals · doi:10.3390/ph17040533 · Cited by 58
Colocalized targeting of TGF-β and PD-L1 by bintrafusp alfa elicits distinct antitumor responses
Lan, Y., Yeung, T.-L., Huang, H., Wegener, A. A., Saha, S., Toister‐Achituv, M., Jenkins, M. H., Chiu, L.-Y., Lazorchak, A. S., Tarcic, O., et al. (2022) · Journal for ImmunoTherapy of Cancer · doi:10.1136/jitc-2021-004122 · Cited by 50
Recent Advances in the Development of TGF-β Signaling Inhibitors for Anticancer Therapy
Lee, H.-J. (2020) · Journal of Cancer Prevention · doi:10.15430/jcp.2020.25.4.213 · Cited by 49
Huang, R.-Z., Jing, X.-T., Huang, X., Pan, Y.-M., Fang, Y., Liang, G.-B., Liao, Z., Wang, H., Chen, Z., & Zhang, Y. (2020) · Journal of Medicinal Chemistry · doi:10.1021/acs.jmedchem.9b01386 · Cited by 48
Re-education of the Tumor Microenvironment With Targeted Therapies and Immunotherapies
Ngiow, S. F., & Young, A. (2020) · Frontiers in Immunology · doi:10.3389/fimmu.2020.01633 · Cited by 51
Pharmacodynamic measures within tumors expose differential activity of PD(L)-1 antibody therapeutics
Kumar, D., Mishra, A., Lisok, A., Kureshi, R., Shelake, S., Plyku, D., Sen, R., Doucet, M., Silva, R. A. D., Mease, R. C., et al. (2021) · Proceedings of the National Academy of Sciences · doi:10.1073/pnas.2107982118 · Cited by 46
Self-citationYang, M., Wang, B., Yin, Y., Ma, X., Tang, L., Zhang, Y., Fan, Q., Yin, T., & Wang, Y. (2022) · Journal of Controlled Release · doi:10.1016/j.jconrel.2022.11.025 · Cited by 46
Newsted, D., Banerjee, S., Watt, K., Nersesian, S., Truesdell, P. F., Blazer, L. L., Cardarelli, L., Adams, J., Sidhu, S. S., & Craig, A. W. (2018) · OncoImmunology · doi:10.1080/2162402x.2018.1539613 · Cited by 46
The role of the immune system in brain metastasis.
Leibold, A. T., Monaco, G. N., & Dey, M. (2019) · PubMed · Cited by 46
Chen, B., Mu, C., Zhang, Z., He, X., & Liu, X. (2022) · Frontiers in Immunology · doi:10.3389/fimmu.2022.891268 · Cited by 48
Ho, A. Y., Wright, J. L., Blitzblau, R. C., Mutter, R. W., Duda, D. G., Norton, L., Bardia, A., Spring, L. M., Isakoff, S. J., Chen, J. H., et al. (2020) · International Journal of Radiation Oncology*Biology*Physics · doi:10.1016/j.ijrobp.2020.05.011 · Cited by 45
Improving Anti-PD-1/PD-L1 Therapy for Localized Bladder Cancer
de Jong, F. C., Rutten, V. C., Zuiverloon, T. C. M., & Theodorescu, D. (2021) · International Journal of Molecular Sciences · doi:10.3390/ijms22062800 · Cited by 44
Immune microenvironment infiltration landscape and immune-related subtypes in prostate cancer
Wu, W., Wang, X., Le, W., Lu, C., Li, H., Zhu, Y., Chen, X., An, W., Xu, C., Wu, Q., et al. (2023) · Frontiers in Immunology · doi:10.3389/fimmu.2022.1001297 · Cited by 45
Kondo, Y., Suzuki, S., Takahara, T., Ono, S., Goto, M., Miyabe, S., Sugita, Y., Ogawa, T., Ito, H., Satou, A., et al. (2021) · Cancer Science · doi:10.1111/cas.15081 · Cited by 43
Yuan, J. X., Li, Y., Zhang, H., Beeraka, N. M., Zhang, D., Wang, Q., Wang, M., Hemanth Vikram, P. R., Sethi, G., & Wang, G. (2024) · Biomedicine & Pharmacotherapy · doi:10.1016/j.biopha.2024.117714 · Cited by 47
RetractedFeng, D., Xiong, Q., Zhang, F., Shi, X., Xu, H., Wei, W., Ai, J., & Yang, L. (2022) · Frontiers in Immunology · doi:10.3389/fimmu.2022.777724 · Cited by 40
Endo, E., Okayama, H., Saito, K., Nakajima, S., Yamada, L., Ujiie, D., Kase, K., Fujita, S., Endo, H., Sakamoto, W., et al. (2020) · Molecular Cancer Research · doi:10.1158/1541-7786.mcr-20-0308 · Cited by 40
Functional nanovesicles displaying anti-PD-L1 antibodies for programmed photoimmunotherapy
Chen, H., Zhang, P., Shi, Y., Liu, C., Zhou, Q., Zeng, Y., Cheng, H., Dai, Q., Gao, X., Wang, X., et al. (2022) · Journal of Nanobiotechnology · doi:10.1186/s12951-022-01266-3 · Cited by 40
T Lymphocyte Exhaustion During Human and Experimental Visceral Leishmaniasis
Costa-Madeira, J. C., Trindade, G. B., Almeida, P. H. P., Silva, J. S., & Carregaro, V. (2022) · Frontiers in Immunology · doi:10.3389/fimmu.2022.835711 · Cited by 40
The role of coagulome in the tumor immune microenvironment
Wahab, R., Hasan, M. M., Azam, Z., Grippo, P. J., & Al-Hilal, T. A. (2023) · Advanced Drug Delivery Reviews · doi:10.1016/j.addr.2023.115027 · Cited by 43
Li, K., Liu, W., Yu, H., Chen, J., Tang, W., Wang, J., Qi, M., Sun, Y., Xu, X., Zhang, J., et al. (2024) · Journal of Clinical Investigation · doi:10.1172/jci170490 · Cited by 40
Recent advances in targeted therapy for pancreatic adenocarcinoma
Fang, Y., Yang, W., Niu, Y., & Sun, Y. (2023) · World Journal of Gastrointestinal Oncology · doi:10.4251/wjgo.v15.i4.571 · Cited by 40
Deciphering the complexities of cancer cell immune evasion: Mechanisms and therapeutic implications
Gupta, I., Hussein, O., Sastry, K. S., Bougarn, S., Gopinath, N., Chin-Smith, E. C., Sinha, Y., Korashy, H. M., & Maccalli, C. (2023) · Advances in Cancer Biology - Metastasis · doi:10.1016/j.adcanc.2023.100107 · Cited by 39
Wang, G., Tai, R., Wu, Y., Yang, S., Wang, J., Yu, X., Lei, L., Shan, Z., & Li, N. (2020) · Cytokine & Growth Factor Reviews · doi:10.1016/j.cytogfr.2020.02.002 · Cited by 38
Xu, T., Liu, Z., Huang, L., Jing, J., & Liu, X. (2022) · Frontiers in Immunology · doi:10.3389/fimmu.2022.1057850 · Cited by 38
Tolcher, A. W., Gordon, M. S., Mahoney, K. M., Seto, A., Zavodovskaya, M., Hsueh, C., Zhai, S., Tarnowski, T. L., Jürgensmeier, J. M., Stinson, S., et al. (2023) · Journal for ImmunoTherapy of Cancer · doi:10.1136/jitc-2022-005267 · Cited by 36
Bai, Y., Wang, Y., Zhang, X., Fu, J., Xing, X., Wang, C., Gao, L., Liu, Y., & Shi, L. (2019) · International Journal of Pharmaceutics · doi:10.1016/j.ijpharm.2019.118636 · Cited by 36
Umbilical cord blood derived cellular therapy: advances in clinical development
Wang, J., & Metheny, L. L. (2023) · Frontiers in Oncology · doi:10.3389/fonc.2023.1167266 · Cited by 37
Using proteomic and transcriptomic data to assess activation of intracellular molecular pathways
Buzdin, A. A., Tkachev, V., Zolotovskaia, M., Garazha, A., Moshkovskii, S. A., Borisov, N. M., Гайфуллин, Н., Sorokin, M., & Suntsova, M. (2021) · Advances in protein chemistry and structural biology · doi:10.1016/bs.apcsb.2021.02.005 · Cited by 34
Yang, Z., Xue, F. S., Li, M., Zhu, X., Lu, X., Wang, C., Xu, E., Wang, X., Zhang, L., Heng, Y., et al. (2021) · Frontiers in Oncology · doi:10.3389/fonc.2021.753330 · Cited by 33
Effects of PD-1 Signaling on Immunometabolic Reprogramming
Boussiotis, V. A., & Patsoukis, N. (2022) · Immunometabolism · doi:10.20900/immunometab20220007 · Cited by 37
Sun, Z., Zhang, Y., Cao, D., Wang, X., Yan, X., Li, H., Huang, L., Qu, X., Kong, C., Qin, H., et al. (2018) · Drug Delivery · doi:10.1080/10717544.2018.1509907 · Cited by 33
Zhou, Y., Zhu, G., Lu, X., Zheng, K. I., Wang, Q.-W., Chen, J.-N., Zhang, Q., Yan, F., & Li, X. (2020) · Cancer Immunology Immunotherapy · doi:10.1007/s00262-020-02525-8 · Cited by 33
Contribution of Macrophages and T Cells in Skeletal Metastasis
Mendoza‐Reinoso, V., McCauley, L. K., & Fournier, P. G. J. (2020) · Cancers · doi:10.3390/cancers12041014 · Cited by 35
Li, A., Chang, Y., Song, N., Wu, X., Chung, D., Riesenberg, B., Velegraki, M., Giuliani, G. D., Das, K., Okimoto, T., et al. (2022) · Journal for ImmunoTherapy of Cancer · doi:10.1136/jitc-2022-005433 · Cited by 32
Therapeutic Targeting of Tumor-Infiltrating Regulatory T Cells in Breast Cancer
Fattori, S., Roux, H., Connen, E., Robert, L., Gorvel, L., Roy, A. L., Houacine, J., Foussat, A., Chrétien, A.-S., & Olive, D. (2022) · Cancer Research · doi:10.1158/0008-5472.can-22-0654 · Cited by 36
Transforming growth factor‐β signalling in tumour resistance to the anti‐PD ‐(L)1 therapy: Updated
Mortezaee, K., & Majidpoor, J. (2023) · Journal of Cellular and Molecular Medicine · doi:10.1111/jcmm.17666 · Cited by 32
Ahuja, S., & Zaheer, S. (2023) · Cell Biology International · doi:10.1002/cbin.12097 · Cited by 33
Singh, S. P., Gouri, V., & Samant, M. (2023) · Medical Oncology · doi:10.1007/s12032-023-02204-5 · Cited by 31
The IGF-II–Insulin Receptor Isoform-A Autocrine Signal in Cancer: Actionable Perspectives
Scalia, P., Giordano, A., & Williams, S. J. (2020) · Cancers · doi:10.3390/cancers12020366 · Cited by 30
Xu, W., Yang, Y., Hu, Z., Head, M., Mangold, K. A., Sullivan, M. E., Wang, E., Saha, P., Gulukota, K., Helseth, D. L., et al. (2020) · Human Gene Therapy · doi:10.1089/hum.2020.078 · Cited by 30
Katagata, M., Okayama, H., Nakajima, S., Saito, K., Sato, T., Sakuma, M., Fukai, S., Endo, E., Sakamoto, W., Saito, M., et al. (2023) · Cancers · doi:10.3390/cancers15204943 · Cited by 31
Constantin, M., Chifiriuc, M. C., Mihăescu, G., Vrâncianu, C. O., Dobre, E.-G., Cristian, R.-E., Bleoţu, C., Bertesteanu, S. V., Grigore, R., Şerban, B., et al. (2023) · Frontiers in Oncology · doi:10.3389/fonc.2023.1273516 · Cited by 29
Elia, A. R., Caputo, S., & Bellone, M. (2018) · Frontiers in Immunology · doi:10.3389/fimmu.2018.01786 · Cited by 30
Morillon, Y. M., Rumfield, C. S., Pellom, S. T., Sabzevari, A., Roller, N., Horn, L. A., Jochéms, C., Palena, C., Greiner, J. W., & Schlom, J. (2020) · Frontiers in Oncology · doi:10.3389/fonc.2020.00549 · Cited by 29
Transforming Growth Factor-β1 in Cancer Immunology: Opportunities for Immunotherapy
Villar, V. H., Subotički, T., Đikić, D., Ajtić, O. M., Simón, F., & Santibanez, J. F. (2023) · Advances in experimental medicine and biology · doi:10.1007/978-3-031-26163-3_17 · Cited by 32
Rihan, F. A., & Udhayakumar, K. (2023) · Chaos Solitons & Fractals · doi:10.1016/j.chaos.2023.113670 · Cited by 29
Zhao, J.-W., Zhao, W., Cui, X.-H., Xing, L., Shi, J.-C., & Yu, L. (2023) · Clinical & Translational Oncology · doi:10.1007/s12094-023-03269-4 · Cited by 30
Transforming growth f actor‐beta1 and m yeloid‐derived suppressor cells: A cancerous partnership
Mojsilović, S. B., Mojsilović, S. S., Bjelica, S., & Santibanez, J. F. (2021) · Developmental Dynamics · doi:10.1002/dvdy.339 · Cited by 27
Advances in Immunotherapy and the TGF-β Resistance Pathway in Metastatic Bladder Cancer
Benjamin, D. J., & Lyou, Y. (2021) · Cancers · doi:10.3390/cancers13225724 · Cited by 27
Wang, D., Peng, L., Hua, L., Li, J., Liu, Y., & Zhou, Y. (2022) · Frontiers in Cell and Developmental Biology · doi:10.3389/fcell.2022.817800 · Cited by 26
Xing, Y., Ren, Z., Jin, R., Liu, L., Pei, J., & Yu, K. (2022) · Acta Pharmacologica Sinica · doi:10.1038/s41401-021-00840-z · Cited by 25
Dhawan, N., Afzal, M. Z., & Amin, M. A. (2023) · Current Oncology · doi:10.3390/curroncol30050343 · Cited by 25
Immune Checkpoint Inhibitors: Review of the Existing Evidence and Challenges in Breast Cancer
Jalalvand, M., Darbeheshti, F., & Rezaei, N. (2021) · Immunotherapy · doi:10.2217/imt-2020-0283 · Cited by 26
Bypassing anti-PD-(L)1 therapy: Mechanisms and management strategies
Mortezaee, K., Majidpoor, J., Najafi, S., & Tasa, D. (2022) · Biomedicine & Pharmacotherapy · doi:10.1016/j.biopha.2022.114150 · Cited by 26
Nan, Y., Bai, Y., Hu, X., Zhou, K., Wu, T., Zhu, A., Li, M., Dou, Z., Cao, Z., Zhang, X., et al. (2024) · Journal for ImmunoTherapy of Cancer · doi:10.1136/jitc-2024-009236 · Cited by 26
The PD-L1 metabolic interactome intersects with choline metabolism and inflammation
Pacheco‐Torres, J., Penet, M., Mironchik, Y., Krishnamachary, B., & Bhujwalla, Z. M. (2021) · Cancer & Metabolism · doi:10.1186/s40170-021-00245-w · Cited by 24
Liu, Z.-L., Liu, J., Staiculescu, D., & Chen, J. (2021) · Therapeutic Advances in Medical Oncology · doi:10.1177/17588359211018026 · Cited by 24
Wei, C., Chen, M., Deng, W., Bie, L., Ma, Y., Zhang, C., Liu, K., Shen, W., Wang, S., Yang, C., et al. (2021) · Briefings in Bioinformatics · doi:10.1093/bib/bbab386 · Cited by 24
Immunotherapy in advanced anal cancer: Is the beginning of a new era?
Ciardiello, D., Guerrera, L. P., Maiorano, B. A., Parente, P., Latiano, T. P., Maïo, M. D., Ciardiello, F., Troiani, T., Martinelli, E., & Maiello, E. (2022) · Cancer Treatment Reviews · doi:10.1016/j.ctrv.2022.102373 · Cited by 24
Resistance mechanisms in melanoma to immuneoncologic therapy with checkpoint inhibitors
Fenton, S. E., Sosman, J. A., & Chandra, S. (2019) · Cancer Drug Resistance · doi:10.20517/cdr.2019.28 · Cited by 28
Could the menagerie of the gut microbiome really cure cancer? Hope or hype
Abid, M. B. (2019) · Journal for ImmunoTherapy of Cancer · doi:10.1186/s40425-019-0561-9 · Cited by 24
Liu, L., Wan, W., Chang, Y., Ao, L., Xu, Y., & Xu, X. (2025) · Journal of Experimental & Clinical Cancer Research · doi:10.1186/s13046-025-03527-z · Cited by 27
Dual anti-PD-(L)1/TGF-β inhibitors in cancer immunotherapy – Updated
Karami, Z., Mortezaee, K., & Majidpoor, J. (2023) · International Immunopharmacology · doi:10.1016/j.intimp.2023.110648 · Cited by 22
Strait, A. A., & Wang, X. (2020) · Molecular Carcinogenesis · doi:10.1002/mc.23196 · Cited by 22
Li, M., Wu, B., Li, L., Lv, C., & Tian, Y. (2023) · Biochimica et Biophysica Acta (BBA) - Reviews on Cancer · doi:10.1016/j.bbcan.2023.188945 · Cited by 23
TGF-β in tumor development and progression: mechanisms and therapeutics
Liu, J., Wang, Y., Tang, C., Zhang, L., Xiong, S., Wang, J., & Dong, C. (2026) · Molecular Biomedicine · doi:10.1186/s43556-026-00403-w · Cited by 26
Biavati, L., Huff, C. A., Ferguson, A. K., Sidorski, A., Stevens, M. A., Rudraraju, L., Zucchinetti, C., Ali, S. A., Imus, P. H., Gocke, C. B., et al. (2021) · Clinical Cancer Research · doi:10.1158/1078-0432.ccr-21-1916 · Cited by 20
Self-citationMolecular Pathways and Druggable Targets in Head and Neck Squamous Cell Carcinoma
Kordbacheh, F., & Farah, C. S. (2021) · Cancers · doi:10.3390/cancers13143453 · Cited by 19
Li, L., Wen, Q., & Ding, R. (2022) · Frontiers in Oncology · doi:10.3389/fonc.2022.905520 · Cited by 19
Research progress and clinical application of predictive biomarker for immune checkpoint inhibitors
Ma, K., Jin, Q., Wang, M., Li, X., & Zhang, Y. (2019) · Expert Review of Molecular Diagnostics · doi:10.1080/14737159.2019.1617702 · Cited by 20
Chen, F., Fu, Y., Bai, G., Qiu, J., & Hua, K. (2025) · Frontiers in Pharmacology · doi:10.3389/fphar.2025.1634413 · Cited by 19
Shen, Y., Li, X., Wang, D., Zhang, L., Li, X., Su, L., Fan, X., & Yang, X. (2022) · Cancer Medicine · doi:10.1002/cam4.5170 · Cited by 17
Han, S., Cui, L., Wang, B., Ruan, Y., Shi, M., Hong, C. S., Guan, X., Chen, Z., Li, Y., Liao, Y., et al. (2025) · Cancer Immunology Research · doi:10.1158/2326-6066.cir-24-1194 · Cited by 19
Yang, Y., Liang, J., Zhao, J., Wang, X., Feng, D., Xu, H., Shen, Y., Zhang, Y., Dai, J., Wang, Z., et al. (2023) · Diagnostic Pathology · doi:10.1186/s13000-023-01384-y · Cited by 16
Lind, H., Hall, S. C., Strait, A. A., Goon, J. B., Aleman, J., Chen, S. M. Y., Karam, S. D., Young, C. D., Wang, J. H., & Wang, J. H. (2024) · Cancer Letters · doi:10.1016/j.canlet.2024.217347 · Cited by 16
Microenvironmental modulation of the developing tumour: an immune‐stromal dialogue
Jones, J. O., Moody, W. M., & Shields, J. D. (2020) · Molecular Oncology · doi:10.1002/1878-0261.12773 · Cited by 16
Immune Checkpoints in Pediatric Solid Tumors: Targetable Pathways for Advanced Therapeutic Purposes
Cocco, C., Morandi, F., & Airoldi, I. (2021) · Cells · doi:10.3390/cells10040927 · Cited by 18
Isoform specific anti-TGFβ therapy enhances antitumor efficacy in mouse models of cancer
Gupta, A., Budhu, S., Fitzgerald, K., Giese, R., Michel, A. O., Holland, A., Campesato, L. F., Snick, J. V., Uyttenhove, C., Ritter, G., et al. (2021) · Communications Biology · doi:10.1038/s42003-021-02773-z · Cited by 16
Neutralization of TGFβ Improves Tumor Immunity and Reduces Tumor Progression in Ovarian Carcinoma
Roane, B. M., Meza‐Perez, S., Katre, A. A., Goldsberry, W. N., Randall, T. D., Norian, L. A., Birrer, M. J., & Arend, R. C. (2020) · Molecular Cancer Therapeutics · doi:10.1158/1535-7163.mct-20-0412 · Cited by 15
Li, Z., Wang, F., Dang, J., Cheng, F., & Zheng, F. (2022) · Translational Cancer Research · doi:10.21037/tcr-22-292 · Cited by 14
Hunter, E., Dezfouli, M., Koutsothanasi, C., Wilson, A., Santos, F. C., Salter, M., Westra, J. W., Powell, R., Dring, A., Egan, B., et al. (2023) · Cancers · doi:10.3390/cancers15102696 · Cited by 18
Bai, M., & Liu, X. (2023) · Frontiers in Oncology · doi:10.3389/fonc.2023.1191009 · Cited by 14
Wang, B., Ou, Z., Zhong, W., Huang, L., Liao, W., Sheng, Y., Guo, Z., Chen, J., Yang, W., Chen, K., et al. (2023) · Cancer Immunology Research · doi:10.1158/2326-6066.cir-23-0117 · Cited by 14
Transforming growth factor-β1 suppress pentraxin-3 in human orbital fibroblasts
Diao, J., Chen, X., Jiang, L., Mou, P., & Wei, R.-L. (2020) · Endocrine · doi:10.1007/s12020-020-02307-3 · Cited by 14
Zhang, J., Qi, J., Wei, H., Lei, Y., Yu, H., Liu, N., Zhao, L., & Wang, P. (2021) · Frontiers in Cell and Developmental Biology · doi:10.3389/fcell.2021.667645 · Cited by 14
Wu, Y., Yu, S., & Qiao, H. (2022) · Frontiers in Pharmacology · doi:10.3389/fphar.2022.990445 · Cited by 14
Immune Microenvironment and Immunotherapeutic Management in Virus-Associated Digestive System Tumors
Sarantis, P., Trifylli, E.-M., Koustas, E., Papavassiliou, K. A., Karamouzis, M. V., & Papavassiliou, A. G. (2022) · International Journal of Molecular Sciences · doi:10.3390/ijms232113612 · Cited by 14
Yao, Y., Chen, H., Lou, M., & Chen, T. (2023) · Frontiers in Genetics · doi:10.3389/fgene.2023.1071694 · Cited by 14
Fine-tuning bispecific therapeutics
Lim, S. I. (2020) · Pharmacology & Therapeutics · doi:10.1016/j.pharmthera.2020.107582 · Cited by 14
Immune surveillance in clinical regression of pre-invasive squamous cell lung cancerPreprint
Pennycuick, A., TEIXEIRA, V. H., AbdulJabbar, K., Raza, S. E. A., Lund, T., Akarca, A. U., Rosenthal, R., Pipinikas, C., Lee-Six, H., Chandrasekharan, D. P., et al. (2019) · bioRxiv (Cold Spring Harbor Laboratory) · doi:10.1101/833004 · Cited by 14
Wang, Y., Wang, K., Zhang, H., Jia, X., Li, X., Sun, S., & Sun, D. (2023) · Frontiers in Genetics · doi:10.3389/fgene.2022.1068462 · Cited by 13
An Integrated Multi-Omics Analysis Identifying Immune Subtypes of Pancreatic Cancer
Su, Y., Wang, F., Lei, Z., Li, J., Ma, M., Yan, Y., Zhang, W., Chen, X., Xu, B., & Hu, T. (2023) · International Journal of Molecular Sciences · doi:10.3390/ijms25010142 · Cited by 13
Xiang, L., Piao, L., Wang, D., & Qi, L. (2022) · Frontiers in Immunology · doi:10.3389/fimmu.2022.974241 · Cited by 13
Pandey, P., & Khan, F. (2023) · Biochimica et Biophysica Acta (BBA) - General Subjects · doi:10.1016/j.bbagen.2023.130401 · Cited by 12
Guo, S., & Wang, Z. (2024) · Frontiers in Oncology · doi:10.3389/fonc.2024.1349308 · Cited by 13
SMAD-oncoprotein interplay: Potential determining factors in targeted therapies
Li, X., & Feng, X. (2020) · Biochemical Pharmacology · doi:10.1016/j.bcp.2020.114155 · Cited by 13
Wang, Y., Wen, H., & Sun, D. (2022) · Annals of Translational Medicine · doi:10.21037/atm-22-1430 · Cited by 12
Metadata
- Authors
- Ravi, R., Noonan, K. A., Pham, V., Bedi, R., Zhavoronkov, A., Ozerov, I. V., Makarev, E., V. Artemov, A., Wysocki, P. T., Mehra, R., Nimmagadda, S., Marchionni, L., Sidransky, D., Borrello, I. M., Izumchenko, E., & Bedi, A.
- Affiliations
- Johns Hopkins University (US)
- Stanford University (US)
- Corresponding author
- Bedi, Atul
- ORCID
- Venue
- Nature Communications
- Published
- 2018-02-21
- Volume
- 9
- Issue
- 1
- Pages
- 741-741
- ISSN
- 2041-1723 (ISSN-L)
- PMC
- PMC5821872
- OpenAlex
- W2789421415
- Cited by
- 325
- References
- 74
- Citations by year
- 2026: 13 · 2025: 26 · 2024: 37 · 2023: 57 · 2022: 45 · 2021: 52 · 2020: 56 · 2019: 17 · 2018: 21
- FWCI
- 13.78
- Type
- journal article
- Language
- en
- Open access
- gold
- doi.org
- Locations
- Nature Communications (publishedVersion, cc-by)
- PubMed Central (publishedVersion, cc-by)
- PubMed (publishedVersion)
- RePEc: Research Papers in Economics (submittedVersion)
- DOAJ (DOAJ: Directory of Open Access Journals) (submittedVersion, cc-by-sa)
- DOAJ (DOAJ: Directory of Open Access Journals) (submittedVersion)
- Funders
- National Institutes of Health (DE019032)
- National Cancer Institute (R01CA184199)
- National Institute of Dental and Craniofacial Research (P50DE019032)
- Topics
- Health Sciences › Medicine › Oncology › Cancer Immunotherapy and Biomarkers
- Life Sciences › Biochemistry, Genetics and Molecular Biology › Molecular Biology › TGF-β signaling in diseases
- Life Sciences › Immunology and Microbiology › Immunology › T-cell and B-cell Immunology
- Keywords
- TGFBR2, CTLA-4, PD-L1, immune checkpoint inhibitors, regulatory T cells, tumor microenvironment, cancer immunotherapy, Treg differentiation, immune tolerance, antitumor efficacy
- MeSH terms
- Animals, Antibodies, Breast Neoplasms, Female, Humans, Immunotherapy, Melanoma, Cohort Studies, Transforming Growth Factor beta, Lymphocytes, Tumor-Infiltrating, Mice, Inbred NOD, Receptors, Transforming Growth Factor beta, Th1 Cells, T-Lymphocytes, Regulatory, Mice, Forkhead Transcription Factors, Th17 Cells, B7-H1 Antigen, CTLA-4 Antigen
About these checks
Registry, retraction, Cites and statistics results are computed, not judged, with one exception: a printed reference that no index lists is read once by a model before it counts as a citation error. Claims are extracted by a model and kept only when their quote appears verbatim in the text; each cited source is then checked, with a model’s help, for whether it says what the claim relies on. Those verdicts can be wrong — read the claim’s quote and the cited source before relying on one.
Statistics and arithmetic are recomputed, not judged.
Confidence bands are shown only for fields calibrated on our annotated test set. None is calibrated yet, so no band is shown.
What counts as a claim ›How we measure confidence ›How we check this ›
Are you an author, or do you see a problem with this page? Request a review
