

The DOI matches its Crossref record; 61 of the 62 references it cites were found in a registry or an index.
A20 critically controls microglia activation and inhibits inflammasome-dependent neuroinflammation
Open accessAbstract
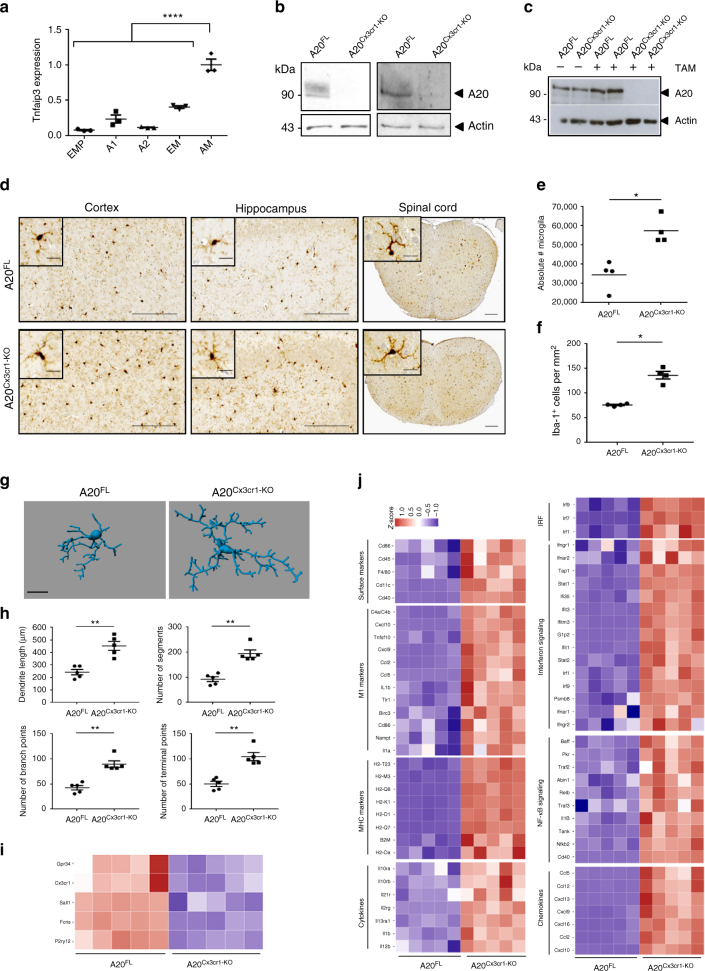
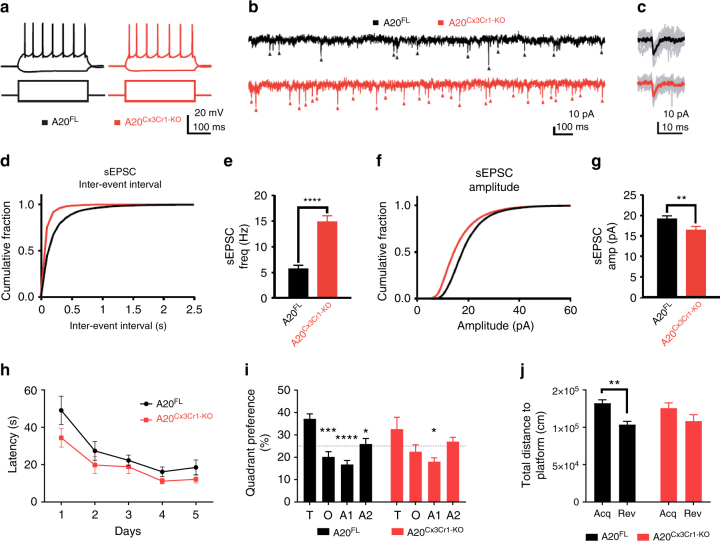
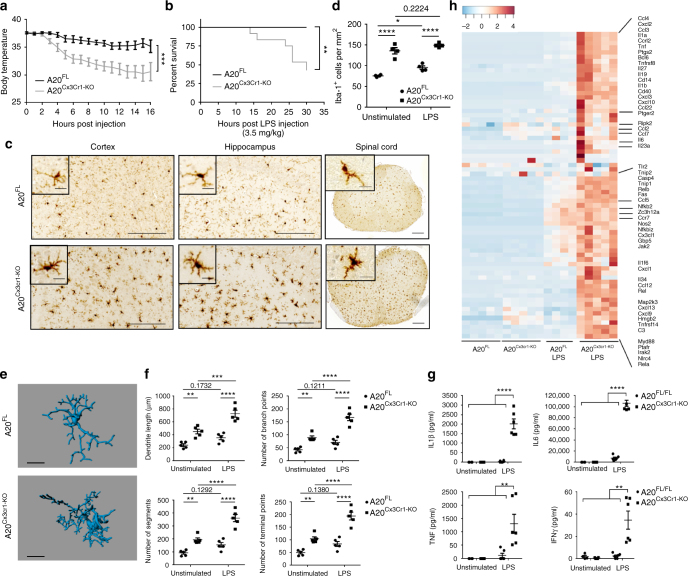
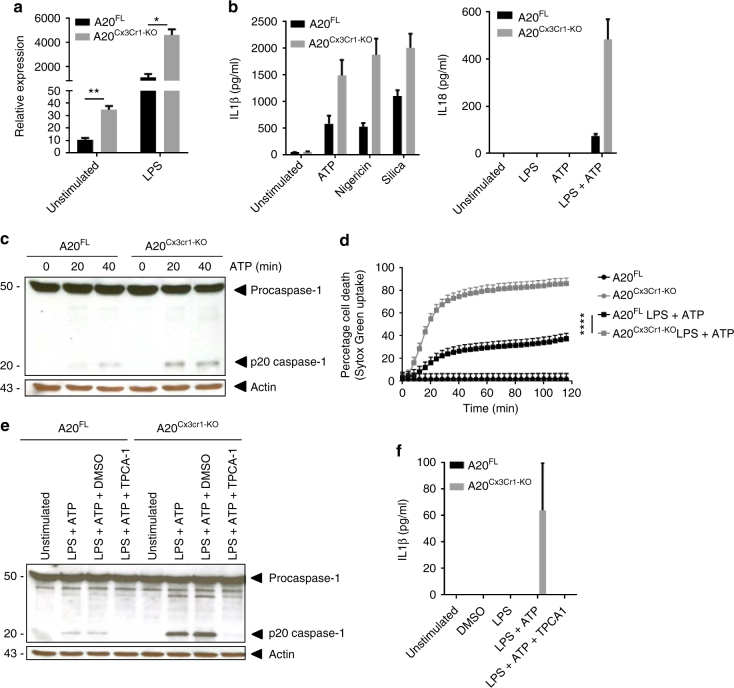
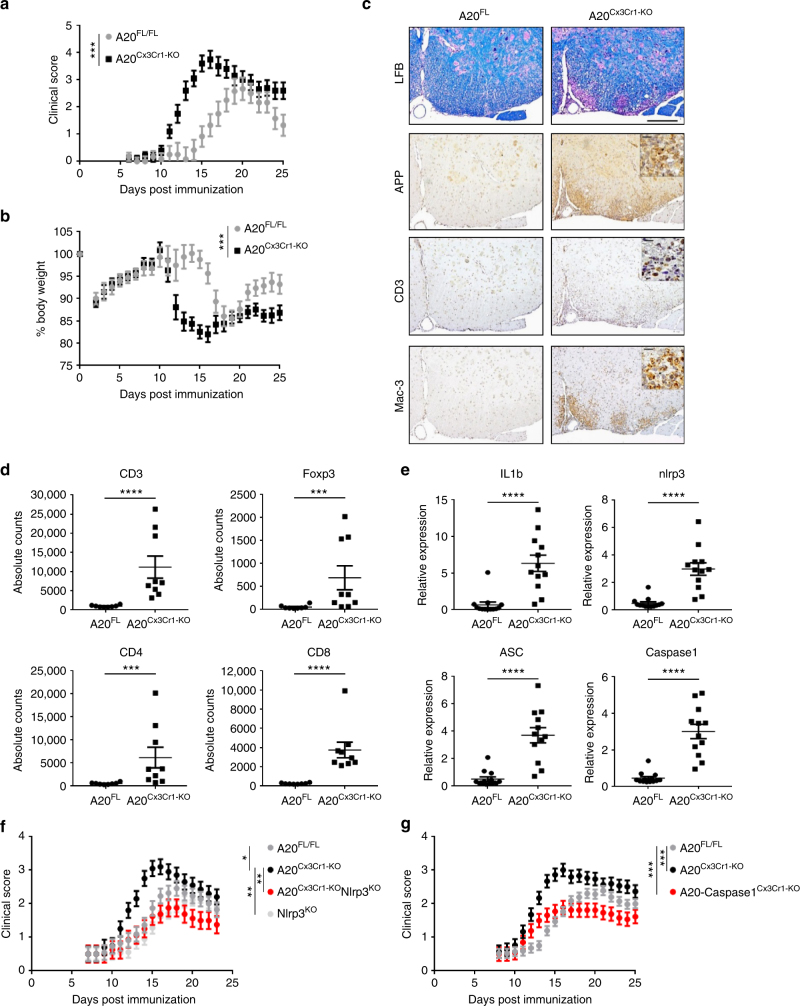
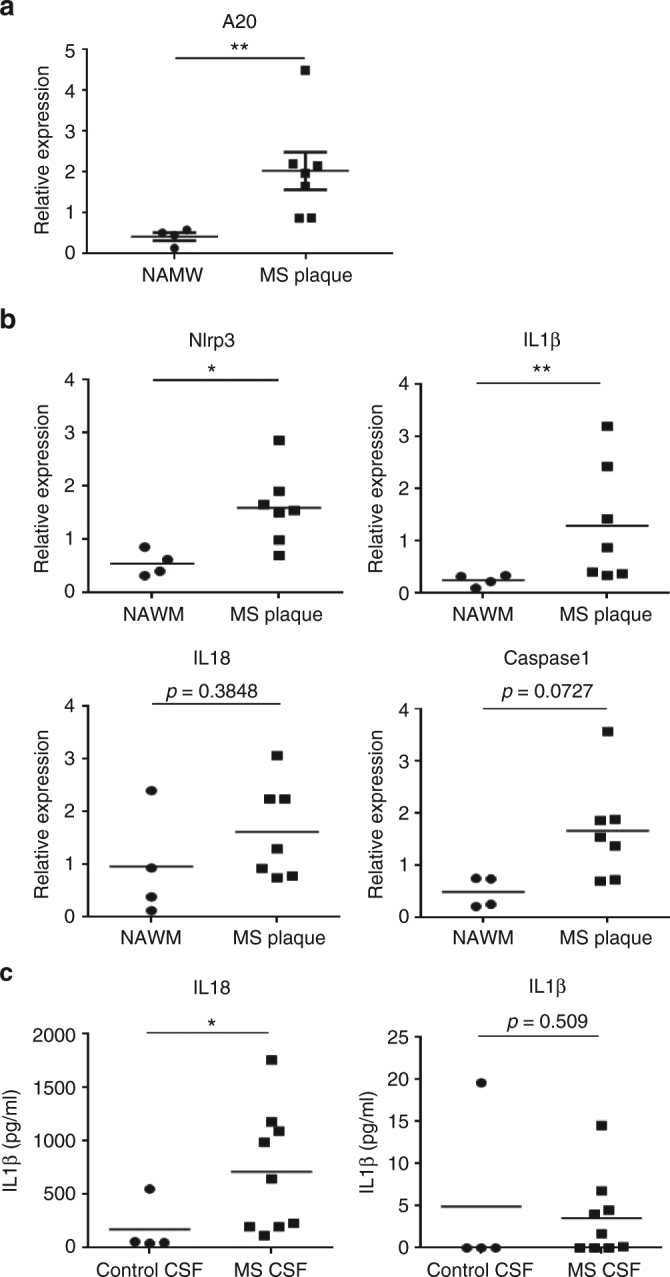
Microglia, the mononuclear phagocytes of the central nervous system (CNS), are important for the maintenance of CNS homeostasis, but also critically contribute to CNS pathology. Here we demonstrate that the nuclear factor kappa B (NF-κB) regulatory protein A20 is crucial in regulating microglia activation during CNS homeostasis and pathology. In mice, deletion of A20 in microglia increases microglial cell number and affects microglial regulation of neuronal synaptic function. Administration of a sublethal dose of lipopolysaccharide induces massive microglia activation, neuroinflammation, and lethality in mice with microglia-confined A20 deficiency. Microglia A20 deficiency also exacerbates multiple sclerosis (MS)-like disease, due to hyperactivation of the Nlrp3 inflammasome leading to enhanced interleukin-1β secretion and CNS inflammation. Finally, we confirm a Nlrp3 inflammasome signature and IL-1β expression in brain and cerebrospinal fluid from MS patients. Collectively, these data reveal a critical role for A20 in the control of microglia activation and neuroinflammation.
Overview
The claims and statistics of this paper haven’t been checked yet.
Run the check — free, no account needed. It reads the open-access text and checks the sources it cites.
Integrity signals
Registry
Cites
Statistics
Figures
Verification
Claims the paper makes
The claims and statistics of this paper haven’t been checked yet.
Run the check — free, no account needed. It reads the open-access text and checks the sources it cites.
Claims other papers make about this one
Each is checked against this paper’s own text: does it say what the citing paper says it does?
The source backs part of the claim, not all of it — or backs it for a different population, condition or comparison.
In the citing paper
“In a commonly employed mouse model for MS, experimental autoimmune encephalomyelitis, microglial NLRP3 inflammasome activation resulted in pyroptosis of oligodendrocytes, promoted inflammation and induced demyelination [194, 195].”
From Microglial function, INPP5D/SHIP1 signaling, and NLRP3 inflammasome activation: implications for Alzheimer’s disease (2023) · cites this paper as [195]
Experimental — accuracy not yet measured
Self-check
Percentages, sums and reported differences re-computed from the paper’s own numbers.
The self-check needs the paper’s full text.
Citations
Cites
STAR: ultrafast universal RNA-seq aligner
Dobin, A., Davis, C. A., Schlesinger, F., Drenkow, J., Zaleski, C., Jha, S., Batut, P., Chaisson, M., & Gingeras, T. R. (2013) · Bioinformatics · doi:10.1093/bioinformatics/bts635 · Cited by 51,709
limma powers differential expression analyses for RNA-sequencing and microarray studies
Ritchie, M. E., Phipson, B., Wu, D., Hu, Y., Law, C. W., Shi, W., & Smyth, G. K. (2015) · Nucleic Acids Research · doi:10.1093/nar/gkv007 · Cited by 40,458
featureCounts: an efficient general purpose program for assigning sequence reads to genomic features
Liao, Y., Smyth, G. K., & Shi, W. (2014) · Bioinformatics · doi:10.1093/bioinformatics/btt656 · Cited by 27,219
Neurotoxic reactive astrocytes are induced by activated microglia
Liddelow, S. A., Guttenplan, K. A., Clarke, L. E., Bennett, F. C., Bohlen, C. J., Schirmer, L., Bennett, M. L., Münch, A. E., Chung, W.-S., Peterson, T. C., et al. (2017) · Nature · doi:10.1038/nature21029 · Cited by 7,971
A Unique Microglia Type Associated with Restricting Development of Alzheimer’s Disease
Keren-Shaul, H., Spinrad, A., Weiner, A., Matcovitch-Natan, O., Dvir-Szternfeld, R., Ulland, T. K., David, E., Baruch, K., Lara-Astaiso, D., Toth, B., et al. (2017) · Cell · doi:10.1016/j.cell.2017.05.018 · Cited by 5,493
Zhang, Y., Chen, K., Sloan, S. A., Bennett, M. L., Scholze, A. R., O'Keeffe, S., Phatnani, H. P., Guarnieri, P., Caneda, C., Ruderisch, N., et al. (2014) · The Journal of Neuroscience · doi:10.1523/jneurosci.1860-14.2014 · Cited by 4,875
Fate Mapping Reveals Origins and Dynamics of Monocytes and Tissue Macrophages under Homeostasis
Yona, S., Kim, K.-W., Wolf, Y., Mildner, A., Varol, D., Breker, M., Strauss-Ayali, D., Viukov, S., Guilliams, M., Misharin, A., et al. (2013) · Immunity · doi:10.1016/j.immuni.2012.12.001 · Cited by 3,245
Self-citationBauernfeind, F. G., Horvath, G. L., Stutz, A., Alnemri, E. S., MacDonald, K. L., Speert, D. P., Fernandes‐Alnemri, T., Wu, J., Monks, B. G., Fitzgerald, K. A., et al. (2009) · The Journal of Immunology · doi:10.4049/jimmunol.0901363 · Cited by 3,087
Cryopyrin activates the inflammasome in response to toxins and ATP
Mariathasan, S., Weiss, D. S., Newton, K., McBride, J., O'Rourke, K., Roose-Girma, M., Lee, W. P., Weinrauch, Y., Monack, D. M., & Dixit, V. M. (2006) · Nature · doi:10.1038/nature04515 · Cited by 3,080
Krasemann, S., Madore, C., Cialic, R., Baufeld, C., Calcagno, N., El Fatimy, R., Beckers, L., O’Loughlin, E., Xu, Y., Fanek, Z., et al. (2017) · Immunity · doi:10.1016/j.immuni.2017.08.008 · Cited by 2,979
NLRP3 is activated in Alzheimer’s disease and contributes to pathology in APP/PS1 mice
Heneka, M. T., Kummer, M. P., Stutz, A., Delekate, A., Schwartz, S., Vieira-Saecker, A., Griep, A., Axt, D., Remus, A., Tzeng, T.-C., et al. (2013) · Nature · doi:10.1038/nature11729 · Cited by 2,898
Microglia promote learning-dependent synapse formation through brain-derived neurotrophic factor
Parkhurst, C. N., Yang, G., Ninan, I., Savas, J. N., Yates, J. R., Lafaille, J. J., Hempstead, B. L., Littman, D. R., & Gan, W.-B. (2013) · Cell · doi:10.1016/j.cell.2013.11.030 · Cited by 2,599
Mechanisms and Functions of Inflammasomes
Lamkanfi, M., & Dixit, V. M. (2014) · Cell · doi:10.1016/j.cell.2014.04.007 · Cited by 2,579
Self-citationSystemic LPS causes chronic neuroinflammation and progressive neurodegeneration
Qin, L., Wu, X., Block, M. L., Liu, Y., Breese, G. R., Hong, J., Knapp, D. J., & Crews, F. T. (2007) · Glia · doi:10.1002/glia.20467 · Cited by 2,144
Applications of the Morris water maze in the study of learning and memory
D’Hooge, R., & Deyn, P. P. D. (2001) · Brain Research Reviews · doi:10.1016/s0165-0173(01)00067-4 · Cited by 2,083
Disruption of the glucocorticoid receptor gene in the nervous system results in reduced anxiety
Tronche, F., Kellendonk, C., Kretz, O., Gass, P., Anlag, K., Orban, P. C., Bock, R., Klein, R., & Schütz, G. (1999) · Nature Genetics · doi:10.1038/12703 · Cited by 1,841
Microglia emerge from erythromyeloid precursors via Pu.1- and Irf8-dependent pathways
Kierdorf, K., Erny, D., Goldmann, T., Sander, V., Schulz, C., Perdiguero, E. G., Wieghofer, P., Heinrich, A., Riemke, P., Hölscher, C., et al. (2013) · Nature Neuroscience · doi:10.1038/nn.3318 · Cited by 1,457
Self-citationFailure to Regulate TNF-Induced NF-κB and Cell Death Responses in A20-Deficient Mice
Lee, E. G., Boone, D. L., Chai, S., Libby, S. L., Chien, M., Lodolce, J. P., & Ma, A. (2000) · Science · doi:10.1126/science.289.5488.2350 · Cited by 1,409
Microglia and brain macrophages in the molecular age: from origin to neuropsychiatric disease
Prinz, M., & Priller, J. (2014) · Nature Reviews Neuroscience · doi:10.1038/nrn3722 · Cited by 1,329
Self-citationOrigin, fate and dynamics of macrophages at central nervous system interfaces
Goldmann, T., Wieghofer, P., Jordão, M. J. C., Prutek, F., Hagemeyer, N., Frenzel, K., Amann, L., Staszewski, O., Kierdorf, K., Krueger, M., et al. (2016) · Nature Immunology · doi:10.1038/ni.3423 · Cited by 1,209
Self-citationBone marrow-derived monocytes give rise to self-renewing and fully differentiated Kupffer cells
Scott, C. L., Zheng, F., De Baetselier, P., Martens, L., Saeys, Y., De Prijck, S., Lippens, S., Abels, C., Schoonooghe, S., Raes, G., et al. (2016) · Nature Communications · doi:10.1038/ncomms10321 · Cited by 860
Self-citationInnate immunity: the missing link in neuroprotection and neurodegeneration?
Nguyen, M. D., Julien, J., & Rivest, S. (2002) · Nature reviews. Neuroscience · doi:10.1038/nrn752 · Cited by 710
Microglia activation triggers astrocyte-mediated modulation of excitatory neurotransmission
Pascual, O., Ben Achour, S., Rostaing, P., Triller, A., & Bessis, A. (2012) · Proceedings of the National Academy of Sciences · doi:10.1073/pnas.1111098109 · Cited by 693
A new type of microglia gene targeting shows TAK1 to be pivotal in CNS autoimmune inflammation
Goldmann, T., Wieghofer, P., Müller, P. F., Wolf, Y., Varol, D., Yona, S., Brendecke, S. M., Kierdorf, K., Staszewski, O., Datta, M., et al. (2013) · Nature Neuroscience · doi:10.1038/nn.3531 · Cited by 688
Self-citationLoss of ‘homeostatic’ microglia and patterns of their activation in active multiple sclerosis
Zrzavy, T., Hametner, S., Wimmer, I., Butovsky, O., Weiner, H. L., & Lassmann, H. (2017) · Brain · doi:10.1093/brain/awx113 · Cited by 684
Zhou, Q., Wang, H., Schwartz, D. M., Stoffels, M., Park, Y. H., Zhang, Y., Yang, D., Demirkaya, E., Takeuchi, M., Tsai, W. L., et al. (2015) · Nature Genetics · doi:10.1038/ng.3459 · Cited by 658
The role of peripheral immune cells in the CNS in steady state and disease
Prinz, M., & Priller, J. (2017) · Nature Neuroscience · doi:10.1038/nn.4475 · Cited by 657
Self-citationMicroglia contact induces synapse formation in developing somatosensory cortex
Miyamoto, A., Wake, H., Ishikawa, A. W., Eto, K., Shibata, K., Murakoshi, H., Koizumi, S., Moorhouse, A. J., Yoshimura, Y., & Nabekura, J. (2016) · Nature Communications · doi:10.1038/ncomms12540 · Cited by 649
Walsh, J. G., Muruve, D. A., & Power, C. (2014) · Nature Reviews Neuroscience · doi:10.1038/nrn3638 · Cited by 637
A new fate mapping system reveals context-dependent random or clonal expansion of microglia
Tay, T. L., Mai, D., Dautzenberg, J., Fernández-Klett, F., Lin, G., Sagar, Datta, M., Drougard, A., Stempfl, T., Ardura-Fabregat, A., et al. (2017) · Nature Neuroscience · doi:10.1038/nn.4547 · Cited by 597
Self-citationBain, C. C., Hawley, C. A., Garner, H., Scott, C. L., Schridde, A., Steers, N. J., Mack, M., Joshi, A., Guilliams, M., Mowat, A. M. I., et al. (2016) · Nature Communications · doi:10.1038/ncomms11852 · Cited by 527
Self-citationNegative regulation of the NLRP3 inflammasome by A20 protects against arthritis
Walle, L. V., Opdenbosch, N. V., Jacques, P., Fossoul, A., Verheugen, E., Vogel, P., Beyaert, R., Elewaut, D. S., Kanneganti, T., Loo, G., et al. (2014) · Nature · doi:10.1038/nature13322 · Cited by 515
Self-citationA20 in inflammation and autoimmunity
Catrysse, L., Vereecke, L., Beyaert, R., & Loo, G. (2013) · Trends in Immunology · doi:10.1016/j.it.2013.10.005 · Cited by 511
Gris, D., Ye, Z., Iocca, H. A., Wen, H., Craven, R. R., Gris, P., Huang, M., Schneider, M., Miller, S. D., & Ting, J. P.-Y. (2010) · The Journal of Immunology · doi:10.4049/jimmunol.0904145 · Cited by 429
Ontogeny and homeostasis of CNS myeloid cells
Prinz, M., Erny, D., & Hagemeyer, N. (2017) · Nature Immunology · doi:10.1038/ni.3703 · Cited by 413
Self-citationMicroglia turnover with aging and in an Alzheimer’s model via long-term in vivo single-cell imaging
Füger, P., Hefendehl, J. K., Veeraraghavalu, K., Wendeln, A.-C., Schlosser, C., Obermüller, U., Wegenast-Braun, B. M., Neher, J. J., Martus, P., Kohsaka, S., et al. (2017) · Nature Neuroscience · doi:10.1038/nn.4631 · Cited by 401
Targeting mi R‐155 restores abnormal microglia and attenuates disease in SOD 1 mice
Butovsky, O., Jedrychowski, M. P., Cialic, R., Krasemann, S., Murugaiyan, G., Fanek, Z., Greco, D. J., Wu, P. M., Doykan, C. E., Kiner, O., et al. (2015) · Annals of Neurology · doi:10.1002/ana.24304 · Cited by 358
Mutant superoxide dismutase 1-induced IL-1β accelerates ALS pathogenesis
Meissner, F., Molawi, K., & Zychlinsky, A. (2010) · Proceedings of the National Academy of Sciences · doi:10.1073/pnas.1002396107 · Cited by 332
Bajenaru, M. L., Zhu, Y., Hedrick, N. M., Donahoe, J. S., Parada, L. F., & Gutmann, D. H. (2002) · Molecular and Cellular Biology · doi:10.1128/mcb.22.14.5100-5113.2002 · Cited by 322
Podolin, P. L., Callahan, J. F., Bolognese, B. J., Li, Y. H., Carlson, K., Davis, T. G., Mellor, G. W., Evans, C., & Roshak, A. (2004) · Journal of Pharmacology and Experimental Therapeutics · doi:10.1124/jpet.104.074484 · Cited by 297
A Technique for Serial Collection of Cerebrospinal Fluid from the Cisterna Magna in Mouse
Liu, L., & Duff, K. (2008) · Journal of Visualized Experiments · doi:10.3791/960 · Cited by 294
Matmati, M., Jacques, P., Maelfait, J., Verheugen, E., Kool, M., Sze, M., Geboes, L., Louagie, E., Guire, C. M., Vereecke, L., et al. (2011) · Nature Genetics · doi:10.1038/ng.874 · Cited by 294
Self-citationInoue, M., Williams, K. L., Gunn, M. D., & Shinohara, M. L. (2012) · Proceedings of the National Academy of Sciences · doi:10.1073/pnas.1201836109 · Cited by 288
Singh, N., Hopkins, S. J., Hulme, S., Galea, J. P., Hoadley, M. E., Vail, A., Hutchinson, P. J., Grainger, S., Rothwell, N. J., King, A. T., et al. (2014) · Journal of Neuroinflammation · doi:10.1186/1742-2094-11-1 · Cited by 284
Vereecke, L., Sze, M., Guire, C. M., Rogiers, B., Chu, Y., Schmidt‐Supprian, M., Pasparakis, M., Beyaert, R., & Loo, G. (2010) · The Journal of Experimental Medicine · doi:10.1084/jem.20092474 · Cited by 283
Self-citationWang, W., Nguyen, L. T. T., Burlak, C., Chegini, F., Guo, F., Chataway, T., Ju, S., Fisher, O. S., Miller, D. W., Datta, D., et al. (2016) · Proceedings of the National Academy of Sciences · doi:10.1073/pnas.1610099113 · Cited by 270
The link between inflammation, synaptic transmission and neurodegeneration in multiple sclerosis
Centonze, D., Muzio, L., Rossi, S., Furlan, R., Bernardi, G., & Martino, G. (2009) · Cell Death and Differentiation · doi:10.1038/cdd.2009.179 · Cited by 196
Gorp, H. V., Saavedra, P. H. V., de Vasconcelos, N. M., Opdenbosch, N. V., Walle, L. V., Matusiak, M., Prencipe, G., Insalaco, A., Hauwermeiren, F. V., Demon, D., et al. (2016) · Proceedings of the National Academy of Sciences · doi:10.1073/pnas.1613156113 · Cited by 185
Self-citationHomeostasis of Microglia in the Adult Brain: Review of Novel Microglia Depletion Systems
Waisman, A., Ginhoux, F., Greter, M., & Bruttger, J. (2015) · Trends in Immunology · doi:10.1016/j.it.2015.08.005 · Cited by 183
Creating reference gene annotation for the mouse C57BL6/J genome assembly
Mudge, J. M., & Harrow, J. (2015) · Mammalian Genome · doi:10.1007/s00335-015-9583-x · Cited by 173
Hövelmeyer, N., Hao, Z., Kranidioti, K., Kassiotis, G., Buch, T., Frommer, F., von Hoch, L., Krämer, D., Minichiello, L., Kollias, G. A., et al. (2005) · The Journal of Immunology · doi:10.4049/jimmunol.175.9.5875 · Cited by 169
Microglia plasticity during health and disease: An immunological perspective
Shemer, A., Erny, D., Jung, S., & Prinz, M. (2015) · Trends in Immunology · doi:10.1016/j.it.2015.08.003 · Cited by 168
Self-citationShaw, P. J., Lukens, J. R., Burns, S., Chi, H., McGargill, M. A., & Kanneganti, T. (2010) · The Journal of Immunology · doi:10.4049/jimmunol.1000217 · Cited by 160
Hagemeyer, N., Kierdorf, K., Frenzel, K., Xue, J., Ringelhan, M., Abdullah, Z., Godin, I., Wieghofer, P., Jordão, M. J. C., Ulas, T., et al. (2016) · The EMBO Journal · doi:10.15252/embj.201693801 · Cited by 144
Self-citationInoue, M., & Shinohara, M. L. (2013) · Autoimmune Diseases · doi:10.1155/2013/859145 · Cited by 123
Central nervous system myeloid cells as drug targets: current status and translational challenges
Biber, K. P. H., Möller, T., Boddeke, E., & Prinz, M. (2015) · Nature Reviews Drug Discovery · doi:10.1038/nrd.2015.14 · Cited by 111
Self-citationWang, X., Deckert, M., Xuân, N. T., Nishanth, G., Just, S., Waisman, A., Naumann, M., & Schlüter, D. (2013) · Acta Neuropathologica · doi:10.1007/s00401-013-1183-9 · Cited by 92
A20 deficiency causes spontaneous neuroinflammation in mice
Guedes, R. P., Csizmadia, E., Moll, H. P., Ma, A. I., Ferran, C. J., & da Silva, C. G. (2014) · Journal of Neuroinflammation · doi:10.1186/1742-2094-11-122 · Cited by 63
Dhondt, J., Peeraer, E., Verheyen, A., Nuydens, R., Buysschaert, I., Poesen, K., Geyte, K. V., Beerens, M., Shibuya, M., Haigh, J. J., et al. (2011) · The FASEB Journal · doi:10.1096/fj.10-170944 · Cited by 60
LPA 5 receptor plays a role in pain sensitivity, emotional exploration and reversal learning
Callaerts‐Vegh, Z., Leo, S., Vermaercke, B., Meert, T. F., & D’Hooge, R. (2012) · Genes Brain & Behavior · doi:10.1111/j.1601-183x.2012.00840.x · Cited by 44
Self-citationSchnitzer, S. A., van der Heijden, G. M. F., & Powers, J. S. (2015) · Proceedings of the National Academy of Sciences · doi:10.1073/pnas.1521823113 · Cited by 17
Research works printed but not linked: 2
- Stewart, C. A. & Morris, R. The watermaze. Behav. Neurosci. I, 107–122 (1993).
- Gris, D. et al. NLRP3 plays a critical role in the development of experimental autoimmune encephalomyelitis by mediating Th1 and Th17 responses. J. Immunol. 185, 974–981 (2017). · DOI · Paper page
Cited by
Sorted by citations
The gut-brain axis: how microbiota and host inflammasome influence brain physiology and pathology
Rutsch, A., Kantsjö, J. B., & Ronchi, F. (2020) · Frontiers in Immunology · doi:10.3389/fimmu.2020.604179 · Cited by 821
Microglia: Immune and non-immune functions
Borst, K., Dumas, A. A., & Prinz, M. (2021) · Immunity · doi:10.1016/j.immuni.2021.09.014 · Cited by 804
Self-citationInflammasomes in neuroinflammatory and neurodegenerative diseases
Voet, S., Srinivasan, S., Lamkanfi, M., & van Loo, G. (2019) · EMBO Molecular Medicine · doi:10.15252/emmm.201810248 · Cited by 761
Self-citationNF-κB: At the Borders of Autoimmunity and Inflammation
Barnabei, L., Laplantine, E., Mbongo, W., Rieux‐Laucat, F., & Weil, R. (2021) · Frontiers in Immunology · doi:10.3389/fimmu.2021.716469 · Cited by 660
Shan, S., Zhang, Y., Zhao, H., Zeng, T., & Zhao, X. (2022) · Chemosphere · doi:10.1016/j.chemosphere.2022.134261 · Cited by 556
Metadata
- Authors
- Voet, S., Mc Guire, C., Hagemeyer, N., Martens, A., Schroeder, A., Wieghofer, P., Daems, C., Staszewski, O., Vande Walle, L., Jordao, M. J. C., Sze, M., Vikkula, H.-K., Demeestere, D., Van Imschoot, G., Scott, C. L., Hoste, E., Gonçalves, A., Guilliams, M., Lippens, S., Libert, C., Vandenbroucke, R. E., Kim, K.-W., Jung, S., Callaerts-Vegh, Z., Callaerts, P., de Wit, J., Lamkanfi, M., Prinz, M., & van Loo, G.
- Affiliations
- Ghent University (BE)
- University of Freiburg (DE)
- VIB-KU Leuven Center for Brain & Disease Research (BE)
- KU Leuven (BE)
- Weizmann Institute of Science (IL)
- ORCID
- Hagemeyer, Nora
- Martens, Arne
- Schroeder, Anna
- Wieghofer, Peter
- Staszewski, Ori
- Jordao, Marta Joana Costa
- Vikkula, Hanna-Kaisa
- Demeestere, Delphine
- Scott, Charlotte L.
- Hoste, Esther
- Gonçalves, Amanda
- Guilliams, Martin
- Lippens, Saskia
- Libert, Claude
- Vandenbroucke, Roos E.
- Kim, Ki-Wook
- Jung, Steffen
- Callaerts, Patrick
- de Wit, Joris
- Lamkanfi, Mohamed
- Prinz, Marco
- Venue
- Nature Communications
- Published
- 2018-05-23
- Volume
- 9
- Issue
- 1
- Pages
- 2036-2036
- ISSN
- 2041-1723 (ISSN-L)
- PMC
- PMC5964249
- OpenAlex
- W2804482952
- Cited by
- 227
- References
- 62
- Citations by year
- 2026: 15 · 2025: 21 · 2024: 28 · 2023: 34 · 2022: 39 · 2021: 30 · 2020: 33 · 2019: 23 · 2018: 3
- FWCI
- 10.01
- Type
- journal article
- Language
- en
- Open access
- gold
- doi.org
- Locations
- Nature Communications (publishedVersion, cc-by)
- Europe PMC (PubMed Central) (publishedVersion, other-oa)
- PubMed Central (publishedVersion, cc-by)
- PubMed (publishedVersion)
- Ghent University Academic Bibliography (Ghent University) (submittedVersion, cc-by)
- Lirias (KU Leuven) (submittedVersion, public-domain)
- RePEc: Research Papers in Economics (submittedVersion)
- DOAJ (DOAJ: Directory of Open Access Journals) (submittedVersion, cc-by-sa)
- DOAJ (DOAJ: Directory of Open Access Journals) (submittedVersion)
- OPUS (Augsburg University) (submittedVersion, cc-by)
- Funders
- Deutsche Forschungsgemeinschaft (SFB 992, SFB 1140, SFB/ TRR 167, TRR 167)
- Bundesministerium für Bildung und Forschung
- Fonds Wetenschappelijk Onderzoek
- Universiteit Gent
- Fondation Charcot
- Kom op tegen Kanker
- Fondation contre le Cancer
- H2020 European Research Council (683144)
- FP7 Ideas: European Research Council (281600, 311083)
- Topics
- Life Sciences › Neuroscience › Neurology › Neuroinflammation and Neurodegeneration Mechanisms
- Life Sciences › Biochemistry, Genetics and Molecular Biology › Molecular Biology › Inflammasome and immune disorders
- Life Sciences › Biochemistry, Genetics and Molecular Biology › Cancer Research › NF-κB Signaling Pathways
- Keywords
- A20, microglial activation, neuroinflammation, NLRP3 inflammasome, IL-1β, NF-κB regulation, multiple sclerosis, lipopolysaccharide, CNS homeostasis, synaptic function, cerebrospinal fluid
- MeSH terms
- NLR Family, Pyrin Domain-Containing 3 Protein, Tumor Necrosis Factor alpha-Induced Protein 3, Adult, Aged, Aged, 80 and over, Animals, Brain, Disease Models, Animal, Female, Humans, Lipopolysaccharides, Male, Middle Aged, Multiple Sclerosis, Signal Transduction, Microglia, Mice, Interleukin-1beta, Inflammasomes
About these checks
Registry, retraction, Cites and statistics results are computed, not judged, with one exception: a printed reference that no index lists is read once by a model before it counts as a citation error. Claims are extracted by a model and kept only when their quote appears verbatim in the text; each cited source is then checked, with a model’s help, for whether it says what the claim relies on. Those verdicts can be wrong — read the claim’s quote and the cited source before relying on one.
Statistics and arithmetic are recomputed, not judged.
Confidence bands are shown only for fields calibrated on our annotated test set. None is calibrated yet, so no band is shown.
What counts as a claim ›How we measure confidence ›How we check this ›
Are you an author, or do you see a problem with this page? Request a review
