Cited by 194

The DOI matches its Crossref record; 14 of the 14 references it cites were found in a registry or an index.

Neutrophil extracellular trap formation requires OPA1-dependent glycolytic ATP production

Amini, Poorya, Stojkov, Darko, Felser, Andrea, Jackson, Christopher B., Courage, Carolina, Schaller, André, Gelman, Laurent, Soriano, Maria Eugenia, Nuoffer, Jean-Marc, Scorrano, Luca, Benarafa, Charaf, Yousefi, Shida, Simon, Hans-Uwe·2018·Nature Communications

Abstract

Optic atrophy 1 (OPA1) is a mitochondrial inner membrane protein that has an important role in mitochondrial fusion and structural integrity. Dysfunctional OPA1 mutations cause atrophy of the optic nerve leading to blindness. Here, we show that OPA1 has an important role in the innate immune system. Using conditional knockout mice lacking Opa1 in neutrophils (Opa1N∆), we report that lack of OPA1 reduces the activity of mitochondrial electron transport complex I in neutrophils. This then causes a decline in adenosine-triphosphate (ATP) production through glycolysis due to lowered NAD+availability. Additionally, we show that OPA1-dependent ATP production in these cells is required for microtubule network assembly and for the formation of neutrophil extracellular traps. Finally, we show that Opa1N∆mice exhibit a reduced antibacterial defense capability against Pseudomonas aeruginosa.

Overview

The claims and statistics of this paper haven’t been checked yet.

Run the check — free, no account needed. It reads the open-access text and checks the sources it cites.

A few free checks a day · papers already verified open instantly · results are public

Integrity signals

Registry

Crossref · 10.1038/s41467-018-05387-y

Cites

14 of 14 references verified0 citation errors · 0 not checkable

Statistics

Figures

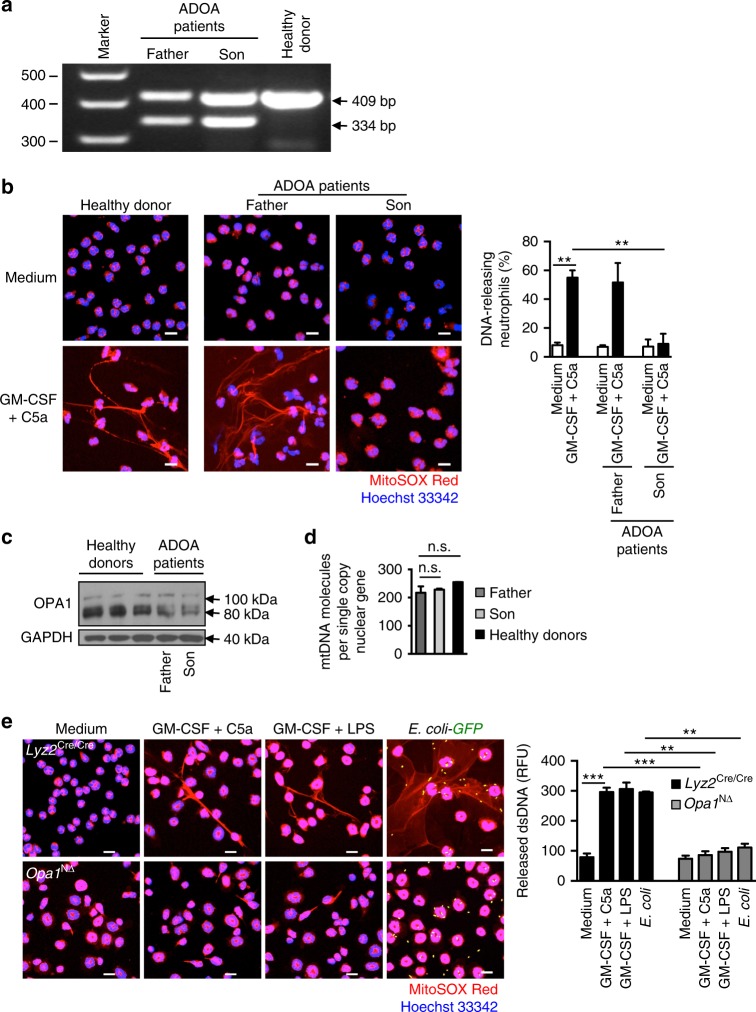
Fig. 1 Failure of DNA release by OPA1-deficient human and mouse neutrophils. a Molecular characterization of OPA1 transcripts in ADOA patients. OPA1 transcript analysis from isolated neutrophils encompassing exons 10–12 derived from a control and two ADOA patients harboring the heterozygous c.1140G>A mutation (NM_015560.2). A shortened product of 334 bp reveals the aberrantly spliced, skipped exon 11 and is detected in patients’ cDNA only. The band of 409 bp indicates the wild-type transcript. A full image of the agarose gel is provided in Supplementary Fig. 11a. b Confocal microscopy. Highly purified human blood neutrophils from control individuals and two ADAO patients were primed with GM-CSF and subsequently stimulated with C5a. Extracellular DNA was stained with MitoSOX™ Red and the nucleus with Hoechst 33342 (blue). Bars, 10 μm. Right: Quantification of the number of DNA-releasing neutrophils. Values are means ± SEM. **p < 0.01; n = 3. c Immunoblotting. Protein lysates of freshly isolated neutrophils from ADOA patients and healthy donors were analyzed for OPA1 protein expression. Full-length immunoblots are provided in Supplementary Fig. 11b. d Quantitative PCR. Genomic DNA from freshly purified human neutrophils of ADOA patients and healthy control donors were analyzed for mtDNA content (average of ATP synthase protein 8 (MT-ATP8) and mitochondrial D-Loop) per single copy nuclear gene (B2M). Values are means ± SEM (n = 3). e Confocal microscopy. Primary mature neutrophils from Opa1N∆ and control mice were primed with GM-CSF and subsequently stimulated with C5a, LPS, or co-cultured with E. coli–GFP. Extracellular DNA was stained with MitoSOX™ Red and the nucleus with Hoechst 33342 (blue). Bars, 10 μm. Right: quantification of released dsDNA in supernatants of activated neutrophils. Values are means ± SEM. n.s., not significant; **p < 0.01; ***p < 0.001; n = 5. Additional data including NET formation induced by other triggers are provided in Supplementary Fig. 2c
Fig. 1 Failure of DNA release by OPA1-deficient human and mouse neutrophils. a Molecular characterization of OPA1 transcripts in ADOA patients. OPA1 transcript analysis from isolated neutrophils encompassing exons 10–12 derived from a control and two ADOA patients harboring the heterozygous c.1140G>A mutation (NM_015560.2). A shortened product of 334 bp reveals the aberrantly spliced, skipped exon 11 and is detected in patients’ cDNA only. The band of 409 bp indicates the wild-type transcript. A full image of the agarose gel is provided in Supplementary Fig. 11a. b Confocal microscopy. Highly purified human blood neutrophils from control individuals and two ADAO patients were primed with GM-CSF and subsequently stimulated with C5a. Extracellular DNA was stained with MitoSOX™ Red and the nucleus with Hoechst 33342 (blue). Bars, 10 μm. Right: Quantification of the number of DNA-releasing neutrophils. Values are means ± SEM. **p < 0.01; n = 3. c Immunoblotting. Protein lysates of freshly isolated neutrophils from ADOA patients and healthy donors were analyzed for OPA1 protein expression. Full-length immunoblots are provided in Supplementary Fig. 11b. d Quantitative PCR. Genomic DNA from freshly purified human neutrophils of ADOA patients and healthy control donors were analyzed for mtDNA content (average of ATP synthase protein 8 (MT-ATP8) and mitochondrial D-Loop) per single copy nuclear gene (B2M). Values are means ± SEM (n = 3). e Confocal microscopy. Primary mature neutrophils from Opa1N∆ and control mice were primed with GM-CSF and subsequently stimulated with C5a, LPS, or co-cultured with E. coli–GFP. Extracellular DNA was stained with MitoSOX™ Red and the nucleus with Hoechst 33342 (blue). Bars, 10 μm. Right: quantification of released dsDNA in supernatants of activated neutrophils. Values are means ± SEM. n.s., not significant; **p < 0.01; ***p < 0.001; n = 5. Additional data including NET formation induced by other triggers are provided in Supplementary Fig. 2cCC BY · PubMed Central
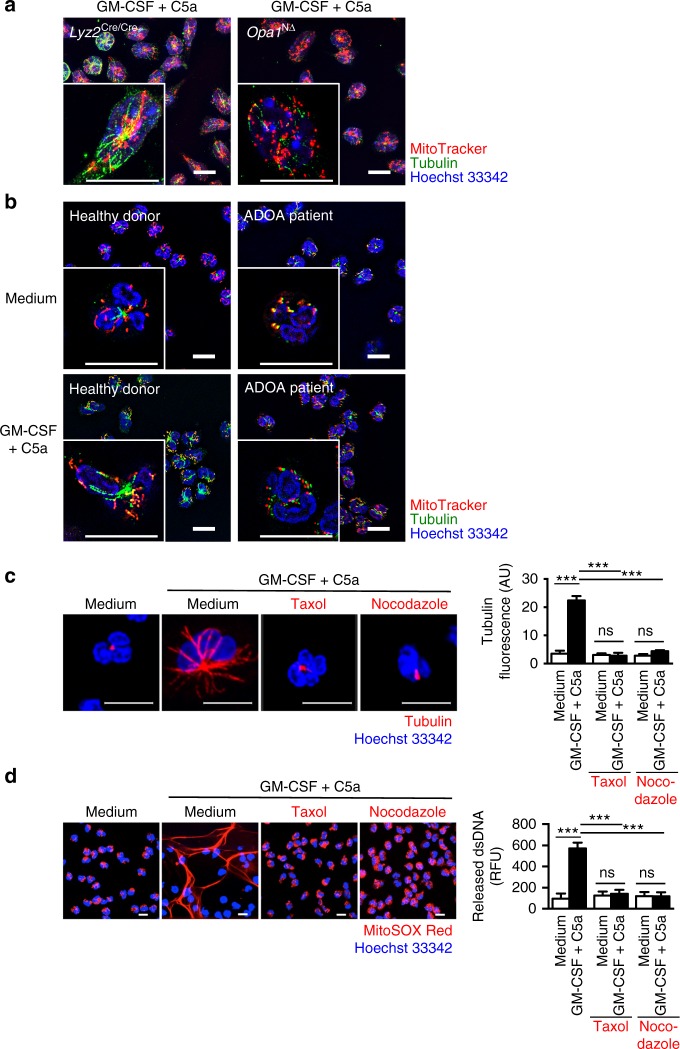
Fig. 2 Absence of microtubule formation in OPA1-deficient human and mouse neutrophils. a Super-resolution microscopy. Microtubule formation and mitochondrial morphology of primary mature neutrophils from Opa1N∆ and control mice following GM-CSF priming and subsequent C5a stimulation. Microtubules were stained with anti-α-tubulin antibody (green), the nucleus with Hoechst 33342 (blue) and mitochondria with MitoTracker® Orange (red). Images were acquired by ELYRA super-resolution microscopy. Bars, 10 µm. The data are representative of three independent experiments. Quantification and additional data including microtubule formation induced by other triggers are provided in Supplementary Fig. 4a–c. b Super-resolution microscopy. Microtubule formation and mitochondrial morphology in human blood neutrophils from control individuals and an ADAO patient (son, see Fig. 1) following GM-CSF priming and subsequent C5a stimulation. Microtubules were stained with anti-α-tubulin antibody (green), the nucleus with Hoechst 33342 (blue) and mitochondria with MitoTracker® Orange (red). Single cells are shown at higher magnification in the insets. Images were acquired by ELYRA super-resolution microscopy. Bars, 10 µm. The data are representative of three independent experiments. Quantification is provided in Supplementary Fig. 5a. c Confocal microscopy. Microtubule assembly was analyzed in human control neutrophils following pre-treatment with the indicated inhibitors and subsequent combined GM-CSF/C5a stimulation. Microtubules were stained with anti-α-tubulin antibody (red), the nucleus with Hoechst 33342 (blue). Bars, 10 µm. Right: Quantification of the microtubule network formation was performed by automated analysis of microscopy images using Imaris software. Values are means ± SEM. n.s., not significant; ***p < 0.001; n = 5. d Confocal microscopy. Human blood neutrophils from control individuals pretreated with the indicated inhibitors were stimulated with GM-CSF/C5a. Extracellular DNA was stained with MitoSOX™ Red and the nucleus with Hoechst 33342 (blue). Bars, 10 μm. Right: quantification of the released dsDNA in supernatants of activated neutrophils. Values are means ± SEM. n.s., not significant; ***p < 0.001; n = 3
Fig. 2 Absence of microtubule formation in OPA1-deficient human and mouse neutrophils. a Super-resolution microscopy. Microtubule formation and mitochondrial morphology of primary mature neutrophils from Opa1N∆ and control mice following GM-CSF priming and subsequent C5a stimulation. Microtubules were stained with anti-α-tubulin antibody (green), the nucleus with Hoechst 33342 (blue) and mitochondria with MitoTracker® Orange (red). Images were acquired by ELYRA super-resolution microscopy. Bars, 10 µm. The data are representative of three independent experiments. Quantification and additional data including microtubule formation induced by other triggers are provided in Supplementary Fig. 4a–c. b Super-resolution microscopy. Microtubule formation and mitochondrial morphology in human blood neutrophils from control individuals and an ADAO patient (son, see Fig. 1) following GM-CSF priming and subsequent C5a stimulation. Microtubules were stained with anti-α-tubulin antibody (green), the nucleus with Hoechst 33342 (blue) and mitochondria with MitoTracker® Orange (red). Single cells are shown at higher magnification in the insets. Images were acquired by ELYRA super-resolution microscopy. Bars, 10 µm. The data are representative of three independent experiments. Quantification is provided in Supplementary Fig. 5a. c Confocal microscopy. Microtubule assembly was analyzed in human control neutrophils following pre-treatment with the indicated inhibitors and subsequent combined GM-CSF/C5a stimulation. Microtubules were stained with anti-α-tubulin antibody (red), the nucleus with Hoechst 33342 (blue). Bars, 10 µm. Right: Quantification of the microtubule network formation was performed by automated analysis of microscopy images using Imaris software. Values are means ± SEM. n.s., not significant; ***p < 0.001; n = 5. d Confocal microscopy. Human blood neutrophils from control individuals pretreated with the indicated inhibitors were stimulated with GM-CSF/C5a. Extracellular DNA was stained with MitoSOX™ Red and the nucleus with Hoechst 33342 (blue). Bars, 10 μm. Right: quantification of the released dsDNA in supernatants of activated neutrophils. Values are means ± SEM. n.s., not significant; ***p < 0.001; n = 3CC BY · PubMed Central
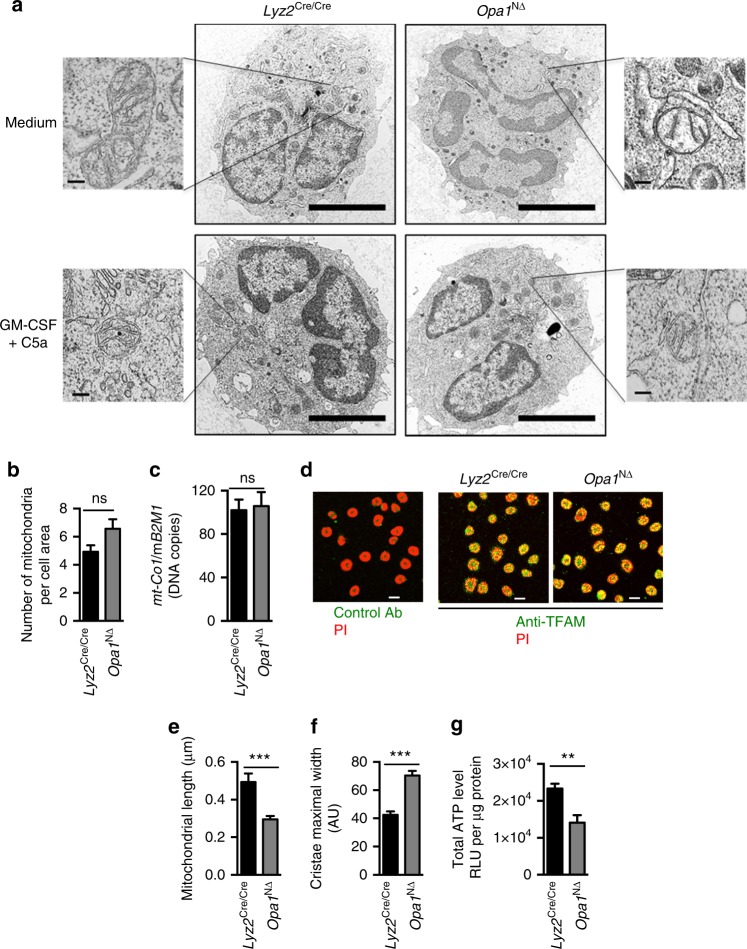
Fig. 3 Lack of Opa1 alters mitochondrial morphology and cristae structure. a Transmission electron microscopy (TEM). Primary mature neutrophils from Opa1N∆ and control mice were fixed and analyzed. Representative images are shown. Bars, 5 µm. Insets to the sides, bars, 1 µm. Mitochondria were further analyzed at higher magnification and statistical analyses are provided below in (b), (e), and (f). b The average numbers of mitochondria per neutrophil was quantified in at least 100 cells. Values are means ± SEM (n = 3); n.s., not significant. c Quantitative PCR. Freshly purified mature neutrophils from Opa1N∆ and control mice were analyzed for the number of DNA copies of mitochondrial mouse cytochrome c oxidase subunit 1 (mt-Co1) relative to mouse β2 microglobulin (B2M) which was used as a single copy nuclear-encoded reference gene. Values are means ± SEM (n = 3); n.s., not significant. d Confocal microscopy. Primary mature mouse neutrophils from Opa1N∆ and control mice were stained for TFAM expression (green) and DNA (red) using anti-TFAM antibody and PI. Bars, 10 µm; n = 3. e Average mitochondrial major axis length in freshly purified mature neutrophils from Opa1N∆ and control mice. Images were acquired by TEM and subsequently analyzed using the measurement points module of Imaris software. Data were collected from at least five mitochondria per cell and more than 50 neutrophils per experiment. Values are means ± SEM. ***p < 0.001; n = 3. f Morphometric analysis of cristae width in 60 randomly selected mitochondria of freshly purified mature neutrophils from Opa1N∆ and control mice. Values are lengths in arbitrary units (AU) and shown as means ± SEM. ***p < 0.001; n = 3. g Total cellular ATP production by freshly purified mature neutrophils from Opa1N∆ and control mice was measured by ATP-dependent luciferase activity using an ATP determination kit. Relative luciferase units (RLU) are shown as means ± SEM. **p < 0.01; n = 5. Quantification of the data obtained in activated neutrophils is provided in Supplementary Fig. 6
Fig. 3 Lack of Opa1 alters mitochondrial morphology and cristae structure. a Transmission electron microscopy (TEM). Primary mature neutrophils from Opa1N∆ and control mice were fixed and analyzed. Representative images are shown. Bars, 5 µm. Insets to the sides, bars, 1 µm. Mitochondria were further analyzed at higher magnification and statistical analyses are provided below in (b), (e), and (f). b The average numbers of mitochondria per neutrophil was quantified in at least 100 cells. Values are means ± SEM (n = 3); n.s., not significant. c Quantitative PCR. Freshly purified mature neutrophils from Opa1N∆ and control mice were analyzed for the number of DNA copies of mitochondrial mouse cytochrome c oxidase subunit 1 (mt-Co1) relative to mouse β2 microglobulin (B2M) which was used as a single copy nuclear-encoded reference gene. Values are means ± SEM (n = 3); n.s., not significant. d Confocal microscopy. Primary mature mouse neutrophils from Opa1N∆ and control mice were stained for TFAM expression (green) and DNA (red) using anti-TFAM antibody and PI. Bars, 10 µm; n = 3. e Average mitochondrial major axis length in freshly purified mature neutrophils from Opa1N∆ and control mice. Images were acquired by TEM and subsequently analyzed using the measurement points module of Imaris software. Data were collected from at least five mitochondria per cell and more than 50 neutrophils per experiment. Values are means ± SEM. ***p < 0.001; n = 3. f Morphometric analysis of cristae width in 60 randomly selected mitochondria of freshly purified mature neutrophils from Opa1N∆ and control mice. Values are lengths in arbitrary units (AU) and shown as means ± SEM. ***p < 0.001; n = 3. g Total cellular ATP production by freshly purified mature neutrophils from Opa1N∆ and control mice was measured by ATP-dependent luciferase activity using an ATP determination kit. Relative luciferase units (RLU) are shown as means ± SEM. **p < 0.01; n = 5. Quantification of the data obtained in activated neutrophils is provided in Supplementary Fig. 6CC BY · PubMed Central
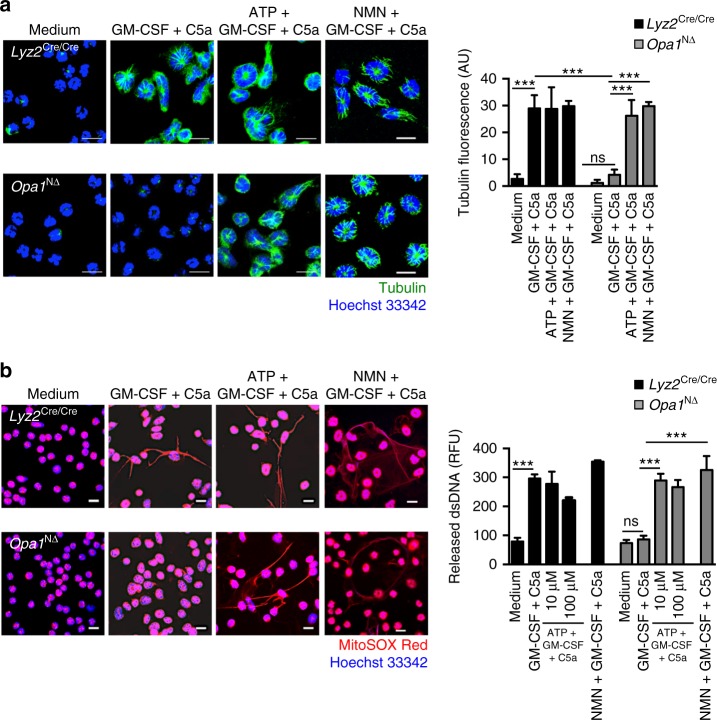
Fig. 4 Exogenous ATP or NMN restore the microtubule network and the ability of activated Opa1N∆ neutrophils to release DNA. a Confocal microscopy. GM-CSF primed and C5a-stimulated neutrophils of Opa1N∆ and control mice were pretreated with 100 μM ATP or 500 μM NMN. Microtubules were stained with anti-α-tubulin antibody (green). Bars, 10 µm. Right: quantification of the microtubule network formation was performed using automated analysis of microscopy images with Imaris software. Values are means ± SEM. n.s., not significant; ***p < 0.001; n = 5. b Confocal microscopy. GM-CSF primed and C5a-stimulated neutrophils of Opa1N∆ and control mice were pretreated with 10 and 100 μM ATP or 500 μM NMN. Extracellular DNA was stained with MitoSOX™ Red and the nucleus with Hoechst 33342 (blue). Bars, 10 µm. Right: quantification of released dsDNA in supernatants of activated neutrophils. Values are means ± SEM. n.s., not significant; ***p < 0.001; n = 4. Additional data including microtubule and NET formation induced by other stimuli known to trigger NETs are provided in Supplementary Figs. 7 and 8
Fig. 4 Exogenous ATP or NMN restore the microtubule network and the ability of activated Opa1N∆ neutrophils to release DNA. a Confocal microscopy. GM-CSF primed and C5a-stimulated neutrophils of Opa1N∆ and control mice were pretreated with 100 μM ATP or 500 μM NMN. Microtubules were stained with anti-α-tubulin antibody (green). Bars, 10 µm. Right: quantification of the microtubule network formation was performed using automated analysis of microscopy images with Imaris software. Values are means ± SEM. n.s., not significant; ***p < 0.001; n = 5. b Confocal microscopy. GM-CSF primed and C5a-stimulated neutrophils of Opa1N∆ and control mice were pretreated with 10 and 100 μM ATP or 500 μM NMN. Extracellular DNA was stained with MitoSOX™ Red and the nucleus with Hoechst 33342 (blue). Bars, 10 µm. Right: quantification of released dsDNA in supernatants of activated neutrophils. Values are means ± SEM. n.s., not significant; ***p < 0.001; n = 4. Additional data including microtubule and NET formation induced by other stimuli known to trigger NETs are provided in Supplementary Figs. 7 and 8CC BY · PubMed Central
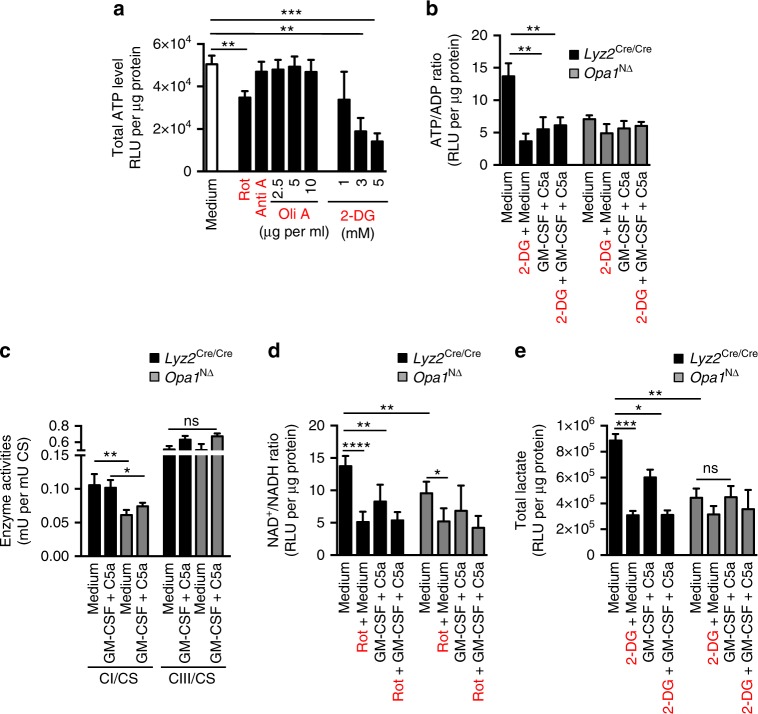
Fig. 5 Reduced glycolytic ATP production in neutrophils of Opa1N∆ mice is a consequence of reduced mitochondrial complex I activity. a ATP-dependent luciferase activity assay. Control human neutrophils were incubated with the indicated inhibitors for 70 min in a concentration-dependent manner. Relative luciferase unit (RLU) values are means ± SEM. **p < 0.01; ***p < 0.001; n = 3. b ATP/ADP bioluminescent assay. Neutrophils of Opa1N∆ and control mice were pre-treated with 3 mM 2-DG for 70 min and the ATP/ADP ratio was measured in the presence and absence of GM-CSF/C5a. RLU values are means ± SEM. **p < 0.01; n = 6. c Complex I (CI), complex III (CIII) and citrate synthase (CS) activities of mitochondria isolated from resting and GM-CSF/C5a-activated Opa1N∆ and control Hoxb8 neutrophils were assessed in the presence and absence of 10 µM rotenone (Rot) using a spectrophotometer. Values are means ± SEM. n.s., not significant; *p < 0.05; **p < 0.01; n = 3. d NAD/NADH bioluminescent assay. NAD+/NADH ratios in resting and GM-CSF/C5a-activated neutrophils of Opa1N∆ and control mice were measured after 70 min incubation in the presence and absence of 10 µM Rot using a NAD/NADH determination kit. RLU values are means ± SEM. *p < 0.05; **p < 0.01; ****p < 0.0001; n = 5. e Lactate bioluminescent assay. Lactate levels in resting and GM-CSF/C5a activated neutrophils of Opa1N∆ and control mice were measured after 70 min incubation in the presence and absence of 3 mM 2-DG using a lactate determination kit. RLU values are means ± SEM. n.s., not significant; *p < 0.05; **p < 0.01; ***p < 0.001; n = 4. ECAR and OCR data are provided in Supplementary Fig. 9
Fig. 5 Reduced glycolytic ATP production in neutrophils of Opa1N∆ mice is a consequence of reduced mitochondrial complex I activity. a ATP-dependent luciferase activity assay. Control human neutrophils were incubated with the indicated inhibitors for 70 min in a concentration-dependent manner. Relative luciferase unit (RLU) values are means ± SEM. **p < 0.01; ***p < 0.001; n = 3. b ATP/ADP bioluminescent assay. Neutrophils of Opa1N∆ and control mice were pre-treated with 3 mM 2-DG for 70 min and the ATP/ADP ratio was measured in the presence and absence of GM-CSF/C5a. RLU values are means ± SEM. **p < 0.01; n = 6. c Complex I (CI), complex III (CIII) and citrate synthase (CS) activities of mitochondria isolated from resting and GM-CSF/C5a-activated Opa1N∆ and control Hoxb8 neutrophils were assessed in the presence and absence of 10 µM rotenone (Rot) using a spectrophotometer. Values are means ± SEM. n.s., not significant; *p < 0.05; **p < 0.01; n = 3. d NAD/NADH bioluminescent assay. NAD+/NADH ratios in resting and GM-CSF/C5a-activated neutrophils of Opa1N∆ and control mice were measured after 70 min incubation in the presence and absence of 10 µM Rot using a NAD/NADH determination kit. RLU values are means ± SEM. *p < 0.05; **p < 0.01; ****p < 0.0001; n = 5. e Lactate bioluminescent assay. Lactate levels in resting and GM-CSF/C5a activated neutrophils of Opa1N∆ and control mice were measured after 70 min incubation in the presence and absence of 3 mM 2-DG using a lactate determination kit. RLU values are means ± SEM. n.s., not significant; *p < 0.05; **p < 0.01; ***p < 0.001; n = 4. ECAR and OCR data are provided in Supplementary Fig. 9CC BY · PubMed Central
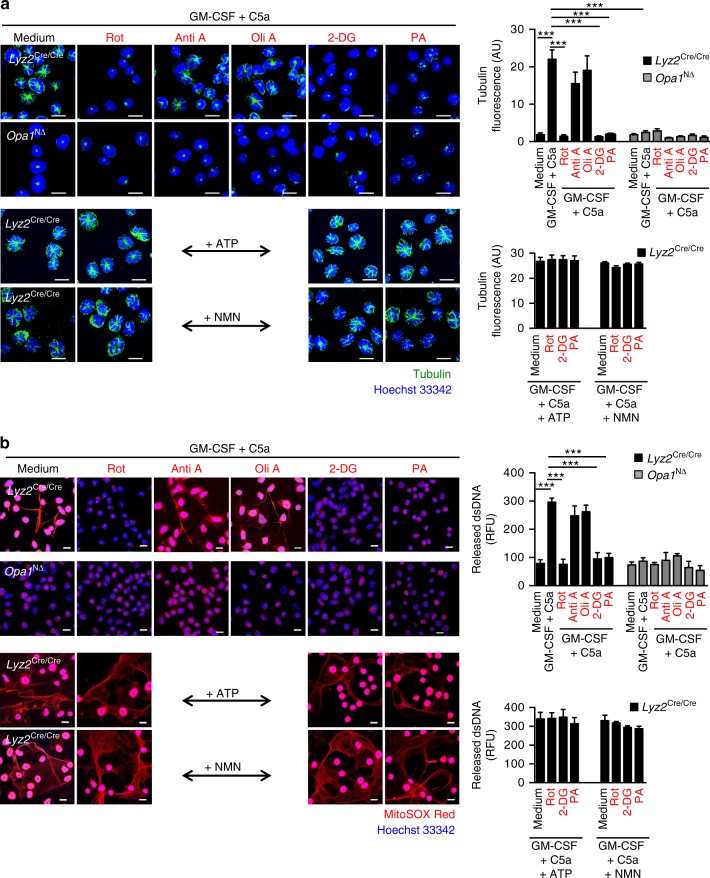
Fig. 6 Pharmacological inhibition of mitochondrial complex I activity and glycolysis blocks microtubule network formation and extracellular DNA release. a Confocal microscopy. Opa1N∆ and control neutrophils were pretreated with 10 µM rotenone (Rot), 5 µg per ml antimycin A (Anti A), 2.5 µg per ml oligomycin A (Oli A), 3 mM 2-DG, or 0.5 µM piericidin A (PA) for 30 min before GM-CSF priming and subsequent C5a activation. Lower panels: control mouse neutrophils were pretreated with 100 µM ATP or 500 µM NMN, incubated in presence or absence of the indicated inhibitors, and subsequently stimulated with GM-CSF/C5a. Microtubules were stained with anti-α-tubulin antibody (green). Bars, 10 µm. Right: Quantification of microtubule network formation was performed by automated analysis of microscopy images using Imaris software. Values are means ± SEM. ***p < 0.001; n = 3. b Confocal microscopy. Neutrophils of Opa1N∆ and control mice were pretreated with 10 µM Rot, 5 µg per ml Anti A, 2.5 µg per ml Oli A, 3 mM 2-DG, or 0.5 µM PA for 30 min before GM-CSF priming and subsequent C5a activation. Lower panels: control mouse neutrophils were pretreated with 100 µM ATP or 500 µM NMN, incubated in presence or absence of the indicated inhibitors, and subsequently stimulated with GM-CSF/C5a. Extracellular DNA was stained with MitoSOX™ Red and the nucleus with Hoechst 33342 (blue). Bars, 10 µm. Right: quantification of released dsDNA in supernatants of activated neutrophils. Values are means ± SEM. ***p < 0.001; n = 3. Additional data using human neutrophils are provided in Supplementary Figs. 7 and 10
Fig. 6 Pharmacological inhibition of mitochondrial complex I activity and glycolysis blocks microtubule network formation and extracellular DNA release. a Confocal microscopy. Opa1N∆ and control neutrophils were pretreated with 10 µM rotenone (Rot), 5 µg per ml antimycin A (Anti A), 2.5 µg per ml oligomycin A (Oli A), 3 mM 2-DG, or 0.5 µM piericidin A (PA) for 30 min before GM-CSF priming and subsequent C5a activation. Lower panels: control mouse neutrophils were pretreated with 100 µM ATP or 500 µM NMN, incubated in presence or absence of the indicated inhibitors, and subsequently stimulated with GM-CSF/C5a. Microtubules were stained with anti-α-tubulin antibody (green). Bars, 10 µm. Right: Quantification of microtubule network formation was performed by automated analysis of microscopy images using Imaris software. Values are means ± SEM. ***p < 0.001; n = 3. b Confocal microscopy. Neutrophils of Opa1N∆ and control mice were pretreated with 10 µM Rot, 5 µg per ml Anti A, 2.5 µg per ml Oli A, 3 mM 2-DG, or 0.5 µM PA for 30 min before GM-CSF priming and subsequent C5a activation. Lower panels: control mouse neutrophils were pretreated with 100 µM ATP or 500 µM NMN, incubated in presence or absence of the indicated inhibitors, and subsequently stimulated with GM-CSF/C5a. Extracellular DNA was stained with MitoSOX™ Red and the nucleus with Hoechst 33342 (blue). Bars, 10 µm. Right: quantification of released dsDNA in supernatants of activated neutrophils. Values are means ± SEM. ***p < 0.001; n = 3. Additional data using human neutrophils are provided in Supplementary Figs. 7 and 10CC BY · PubMed Central
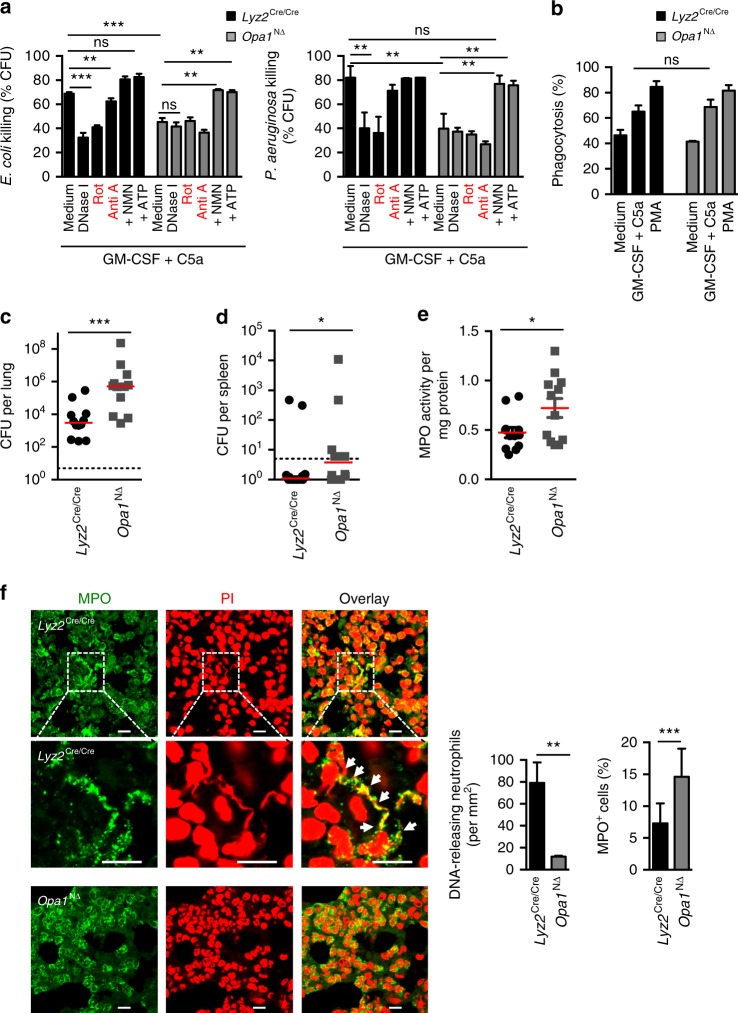
Fig. 7 Anti-microbial response of Opa1N∆ neutrophils and failure to clear P. aeruginosa lung infections. a Bacterial killing assays. Neutrophils of Opa1N∆ and control mice were primed with GM-CSF and subsequently stimulated with C5a before co-culture with E. coli–GFP (left panel) and P. aeruginosa (right panel) in presence or absence of the indicated inhibitors or following 100 μM ATP or 500 μM NMN pre-treatment. Values are means ± SEM. n.s., not significant; **p < 0.01; ***p < 0.001; n = 4. b Phagocytosis assay. Phagocytosis of opsonized E. coli-GFP by Opa1N∆ and control neutrophils was analyzed after 35 min. Values are means ± SEM (n = 3); n.s., not significant. c, d Bacterial clearance in vivo. Opa1N∆ and control mice were intra-nasally inoculated with 2 × 10⁶ CFUs of P. aeruginosa. Total CFU numbers of bacteria were assessed by plating homogenized lungs (c) and spleen (d) on agar plates. The medians are indicated and each symbol represents a value for an individual mouse. *p < 0.05; ***p < 0.001. e MPO enzymatic activity assay. Neutrophil infiltration of lungs in Opa1N∆ and control mice was assessed by MPO activity in total lung homogenates. The medians are indicated and each symbol represents a value for an individual mouse. *p < 0.05. f Confocal microscopy. Lung sections of Opa1N∆ and control mice were obtained after infection with P. aeruginosa and stained with anti-MPO antibody (green) and PI (red). Higher magnifications are shown in the middle panels; white arrows indicate co-localization of extracellular DNA and MPO. Bars, 10 µm. Right: quantification of the DNA-releasing and infiltrating neutrophils in the lungs. Quantification of MPO positive infiltrating neutrophils compared with total PI positive nuclei in the infected lungs using an automated slide scanner. Values are means ± SEM. **p < 0.01; ***p < 0.001; n = 3
Fig. 7 Anti-microbial response of Opa1N∆ neutrophils and failure to clear P. aeruginosa lung infections. a Bacterial killing assays. Neutrophils of Opa1N∆ and control mice were primed with GM-CSF and subsequently stimulated with C5a before co-culture with E. coli–GFP (left panel) and P. aeruginosa (right panel) in presence or absence of the indicated inhibitors or following 100 μM ATP or 500 μM NMN pre-treatment. Values are means ± SEM. n.s., not significant; **p < 0.01; ***p < 0.001; n = 4. b Phagocytosis assay. Phagocytosis of opsonized E. coli-GFP by Opa1N∆ and control neutrophils was analyzed after 35 min. Values are means ± SEM (n = 3); n.s., not significant. c, d Bacterial clearance in vivo. Opa1N∆ and control mice were intra-nasally inoculated with 2 × 10⁶ CFUs of P. aeruginosa. Total CFU numbers of bacteria were assessed by plating homogenized lungs (c) and spleen (d) on agar plates. The medians are indicated and each symbol represents a value for an individual mouse. *p < 0.05; ***p < 0.001. e MPO enzymatic activity assay. Neutrophil infiltration of lungs in Opa1N∆ and control mice was assessed by MPO activity in total lung homogenates. The medians are indicated and each symbol represents a value for an individual mouse. *p < 0.05. f Confocal microscopy. Lung sections of Opa1N∆ and control mice were obtained after infection with P. aeruginosa and stained with anti-MPO antibody (green) and PI (red). Higher magnifications are shown in the middle panels; white arrows indicate co-localization of extracellular DNA and MPO. Bars, 10 µm. Right: quantification of the DNA-releasing and infiltrating neutrophils in the lungs. Quantification of MPO positive infiltrating neutrophils compared with total PI positive nuclei in the infected lungs using an automated slide scanner. Values are means ± SEM. **p < 0.01; ***p < 0.001; n = 3CC BY · PubMed Central

Verification

Claims the paper makes

The claims and statistics of this paper haven’t been checked yet.

Run the check — free, no account needed. It reads the open-access text and checks the sources it cites.

A few free checks a day · papers already verified open instantly · results are public

Claims other papers make about this one

Each is checked against this paper’s own text: does it say what the citing paper says it does?

Self-check

Percentages, sums and reported differences re-computed from the paper’s own numbers.

The self-check needs the paper’s full text.

Citations

Cites

Show all 14 references

Research works printed but not linked: 48

  1. Simon, D., Simon, H. U. & Yousefi, S. Extracellular DNA traps in allergic, infectious, and autoimmune diseases. Allergy 68, 409–416 (2013). · DOI
  2. Garcia-Romo, G. S. et al. Netting neutrophils are major inducers of type I IFN production in pediatric systemic lupus erythematosus. Sci. Transl Med. 3, 73ra20 (2011). · DOI
  3. Lande, R. et al. Neutrophils activate plasmacytoid dendritic cells by releasing self-DNA-peptide complexes in systemic lupus erythematosus. Sci. Transl Med. 3, 73ra19 (2011). · DOI
  4. Yousefi, S. et al. Catapult-like release of mitochondrial DNA by eosinophils contributes to antibacterial defence. Nat. Med. 14, 949–953 (2008). · DOI · Paper page
  5. Shaw, J. M. & Nunnari, J. Mitochondrial dynamics and division in budding yeast. Trends Cell Biol. 12, 178–184 (2002). · DOI · Paper page
  6. Cipolat, S. et al. Mitochondrial rhomboid PARL regulates cytochrome c release during apoptosis via OPA1-dependent cristae remodeling. Cell 126, 163–175 (2006). · DOI
  7. Han, J. et al. OPA1 mutations and mitochondrial DNA haplotypes in autosomal dominant optic atrophy. Genet. Med. 8, 217–225 (2006). · DOI
  8. Zorzano, A., Liesa, M., Sebastián, D., Segalés, J. & Palacín, M. Mitochondrial fusion proteins: dual regulators of morphology and metabolism. Sem. Cell Dev. Biol. 21, 566–574 (2010). · DOI
  9. Alexander, C. et al. OPA1, encoding a dynamin-related GTPase, is mutated in autosomal dominant optic atrophy linked to chromosome 3q28. Nat. Genet. 26, 211–215 (2000). · DOI · Paper page
  10. Yu-Wai-Man, P. et al. Multi-system neurological disease is common in patients with OPA1 mutations. Brain 133, 771–786 (2010). · DOI
  11. Archer, S. L. Mitochondria dynamics-mitochondria fission and fusion in human diseases. N. Engl. J. Med. 369, 2236–2251 (2013). · DOI
  12. Maianski, N. A. et al. Functional characterization of mitochondria in neutrophils: a role restricted to apoptosis. Cell Death Differ. 11, 143–153 (2004). · DOI
  13. Rozman, S. et al. The generation of neutrophils in the bone marrow is controlled by autophagy. Cell Death Differ. 22, 445–456 (2015). · DOI
  14. Amini, P. et al. NET formation can occur independently of RIPK3 and MLKL signaling. Eur. J. Immunol. 46, 178–184 (2016). · DOI
  15. Schimpf, S., Schaich, S. & Wissinger, B. Activation of cryptic splice sites is a frequent splicing defect mechanism caused by mutations in exon and intron sequences of the OPA1 gene. Hum. Genet. 118, 767–771 (2006). · DOI
  16. Chen, H. et al. Mitochondrial fusion is required for mtDNA stability in skeletal muscle and tolerance of mtDNA mutations. Cell 141, 280–289 (2010). · DOI · Paper page
  17. Amati-Bonneau, P. et al. OPA1 mutations induce mitochondrial DNA instability and optic atrophy ‘plus’ phenotypes. Brain 131, 338–351 (2008). · DOI · Paper page
  18. Jackson, C. B., Zbinden, C., Gallati, S. & Schaller, A. Heterologous expression from the human D-loop in organelle. Mitochondrion 17, 67–75 (2014). · DOI
  19. Sitarz, K. S. et al. Opa1 mutations induce mtDNA proliferation in leukocytes of patients with dominant optic atrophy. Neurology 79, 1515–1517 (2012). · DOI
  20. Amati-Bonneaua, P. et al. OPA1-associated disorders: phenotypes and pathophysiology. Biochem. Cell. Biol. 41, 1855–1865 (2009). · DOI
  21. Alavi, M. V. et al. A splice site mutation in the murine Opa1 gene features pathology of autosomal dominant optic atrophy. Brain 130, 1029–1042 (2007). · DOI
  22. Lood, C. et al. Neutrophil extracellular traps enriched in oxidized mitochondrial DNA are interferogenic and contribute to lupus-like disease. Nat. Med. 22, 146–153 (2016). · DOI · Paper page
  23. Amulic, B., Cazalet, C., Hayes, G. L., Metzler, K. D. & Zychlinsky, A. Neutrophil function: from mechanisms to disease. Annu. Rev. Immunol. 30, 459–489 (2012). · DOI
  24. Gray, J. J. et al. N-terminal cleavage of the mitochondrial fusion GTPase OPA1 occurs via a caspase-independent mechanism in cerebellar granule neurons exposed to oxidative or nitrosative stress. Brain Res. 12, 28–43 (2013). · DOI
  25. Mollinedo, F., Nieto, J. M. & Andreu, J. M. Cytoplasmic microtubules in human neutrophil degranulation: Reversible inhibition by the colchicine analogue 2-methoxy-5-(2’,3’,4’trimethoxyphenyl)-2,4,6-cycloheptatrien-1-one. Mol. Pharmacol. 36, 547–555 (1989). · DOI
  26. Xu, J., Wang, F., Van Keymeulen, A., Rentel, M. & Bourne, H. R. Neutrophil microtubules suppress polarity and enhance directional migration. Proc. Natl Acad. Sci. USA 102, 6884–6889 (2005). · DOI
  27. Parker, H., Dragunow, M., Hampton, M. B., Kettle, A. J. & Winterbourn, C. C. Requirements for NADPH oxidase and myeloperoxidase in neutrophil extracellular trap formation differ depending on the stimulus. J. Leukoc. Biol. 92, 841–849 (2012). · DOI · Paper page
  28. Lodi, R. et al. Defective mitochondrial adenosine triphosphate production in skeletal muscle from patients with dominant optic atrophy due to OPA1 mutation. Arch. Neurol. 68, 67–73 (2011). · DOI
  29. Bershadsky, A. D. & Gelfand, V. I. ATP-dependent regulation of cytoplasmic microtubule disassembly. Proc. Natl Acad. Sci. USA 78, 3610–3613 (1981). · DOI
  30. Ying, W. NAD+/NADH and NADP+/NADPH in cellular functions and cell death: regulation and biological consequences. Antioxid. Redox Signal. 10, 179–206 (2008). · DOI · Paper page
  31. Stein, L. R. & Imai, S. I. The dynamic regulation of NAD metabolism in mitochondria. Trends Endocrinol. Metabol. 23, 420–428 (2012). · DOI
  32. van Raam, B. J. et al. Mitochondrial membrane potential in human neutrophils is maintained by complex III activity in the absence of supercomplex organization. PLoS ONE 3, e2013 (2008). · DOI
  33. Benarafa, C., Priebe, G. P. & Remold-O’Donnell, E. The neutrophil serine protease inhibitor Serpinb1 preserves lung defense functions in Pseudomonas aeruginosa infection. J. Exp. Med. 204, 1901–1909 (2007). · DOI
  34. Rehm, S. R., Gross, G. N. & Pierce, A. K. Early bacterial clearance from murine lungs. Species-dependent phagocyte response. J. Clin. Invest. 66, 194–199 (1980). · DOI
  35. Yousefi, S. & Simon, H. U. NETosis – does it really represent nature’s “suicide bomber”? Front. Immunol. 7, 328 (2016). · DOI
  36. Zmijewski, J. W. et al. Mitochondrial respiratory complex I regulates neutrophil activation and severity of lung injury. Am. J. Respir. Crit. Care. Med. 178, 168–179 (2008). · DOI
  37. Bao, Y. et al. Mitochondria regulate neutrophil activation by generating ATP for autocrine purinergic signaling. J. Biol. Chem. 289, 26794–26803 (2014). · DOI
  38. Duanmu, C., Lin, C. M. & Hamel, E. Tubulin polymerization with ATP is mediated through the exchangeable GTP site. Biochim. Biophys. Acta 881, 113–123 (1986). · DOI
  39. Oropesa, M. et al. Apoptotic microtubule network organization and maintenance depend on high cellular ATP levels and energized mitochondria. Apoptosis 16, 404–424 (2011). · DOI
  40. Pedruzzi, E., Fay, M., Elbim, C., Gaudry, M. & Gougerot-Pocidalo, M. A. Differentiation of PLB-985 myeloid cells into mature neutrophils, shown by degranulation of terminally differentiated compartments in response to N-formyl peptide and priming of superoxide anion production by granulocyte–macrophage colony-stimulating factor. Br. J. Haematol. 117, 719–726 (2002). · DOI
  41. Feltrin, D. & Pertz, O. Assessment of Rho GTPase signaling during neurite outgrowth. Methods Mol. Biol. 827, 181–194 (2012). · DOI
  42. Quintana, A. et al. Sustained activity of calcium release-activated calcium channels requires translocation of mitochondria to the plasma membrane. J. Biol. Chem. 281, 40302–40309 (2006). · DOI
  43. Basilico, P., Cremona, T. P., Oevermann, A., Piersigilli, A. & Benarafa, C. Increased myeloid cell production and lung bacterial clearance in mice exposed to cigarette smoke. Am. J. Respir. Cell Mol. Biol. 54, 424–435 (2016). · DOI
  44. Tan, A. S. et al. Mitochondrial genome acquisition restores respiratory function and tumorigenic potential of cancer cells without mitochondrial DNA. Cell. Metab. 21, 81–94 (2015). · DOI · Paper page
  45. Schaller, A. et al. Molecular and biochemical characterization of a novel mutation in POLG associated with Alpers syndrome. BMC Neurol. 11, 4 (2011). · DOI
  46. Uriarte, S. M. et al. Granule exocytosis contributes to priming and activation of neutrophil respiratory burst. J. Immunol. 187, 391–400 (2011). · DOI
  47. Sato, T., Hongu, T., Sakamoto, M., Funakoshi, Y. & Kanaho, Y. Molecular mechanisms of N formyl-methionyl-leucyl-phenylalanine - induced superoxide generation and degranulation in mouse neutrophils: phospholipase D is dispensable. Mol. Cell. Biol. 33, 136–145 (2013). · DOI
  48. Wang, X., He, Z., Liu, H., Yousefi, S. & Simon, H. U. Neutrophil necroptosis is triggered by ligation of adhesion molecules following GM-CSF priming. J. Immunol. 197, 4090–4100 (2016). · DOI

Cited by

See all 194

Metadata

Authors
Amini, P., Stojkov, D., Felser, A., Jackson, C. B., Courage, C., Schaller, A., Gelman, L., Soriano, M. E., Nuoffer, J.-M., Scorrano, L., Benarafa, C., Yousefi, S., & Simon, H.-U.
Venue
Nature Communications
Published
2018-07-27
Volume
9
Issue
1
ISSN
2041-1723
Cited by
194
References
14
Language
en
Funders
Schweizerischer Nationalfonds zur Förderung der Wissenschaftlichen Forschung (310030_166473)

About these checks

Registry, retraction, Cites and statistics results are computed, not judged, with one exception: a printed reference that no index lists is read once by a model before it counts as a citation error. Claims are extracted by a model and kept only when their quote appears verbatim in the text; each cited source is then checked, with a model’s help, for whether it says what the claim relies on. Those verdicts can be wrong — read the claim’s quote and the cited source before relying on one.

Statistics and arithmetic are recomputed, not judged.

Confidence bands are shown only for fields calibrated on our annotated test set. None is calibrated yet, so no band is shown.

What counts as a claim ›How we measure confidence ›How we check this ›

Are you an author, or do you see a problem with this page? Request a review

How to cite

Cite CoChat for the checks on this page, and the paper for its own findings.

This page
CoChat. (2026). Citation check: Neutrophil extracellular trap formation requires OPA1-dependent glycolytic ATP production. https://app.cochat.ai/papers/10.1038/s41467-018-05387-y
The paper
Amini, P., Stojkov, D., Felser, A., Jackson, C. B., Courage, C., Schaller, A., Gelman, L., Soriano, M. E., Nuoffer, J.-M., Scorrano, L., Benarafa, C., Yousefi, S., & Simon, H.-U. (2018). Neutrophil extracellular trap formation requires OPA1-dependent glycolytic ATP production. Nature Communications. https://doi.org/10.1038/s41467-018-05387-y