

The DOI matches its Crossref record; 70 of the 70 references it cites were found in a registry or an index.
Direct protein-lipid interactions shape the conformational landscape of secondary transporters
Open accessAbstract
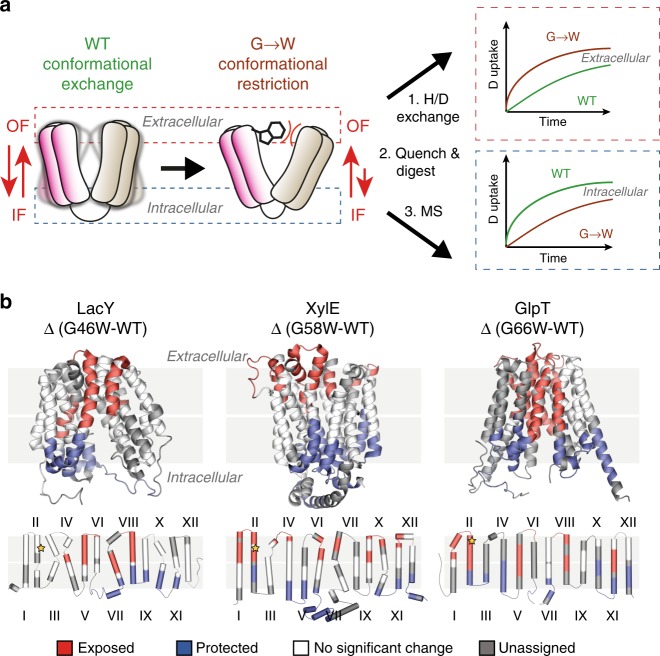
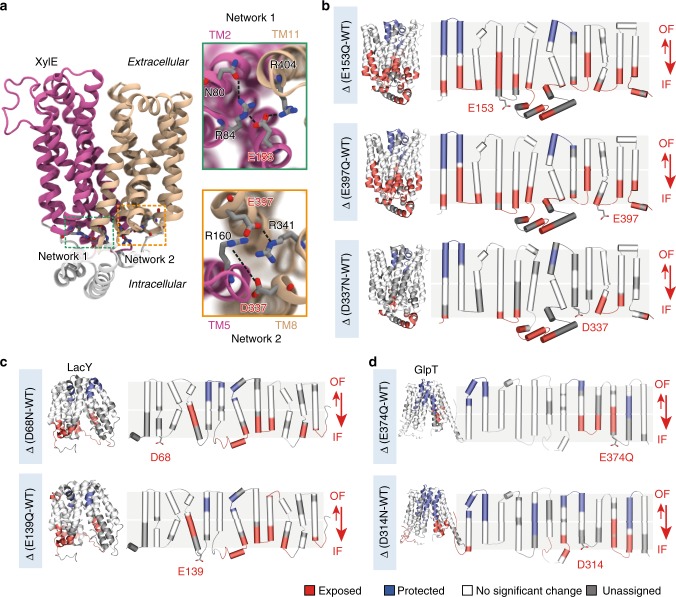
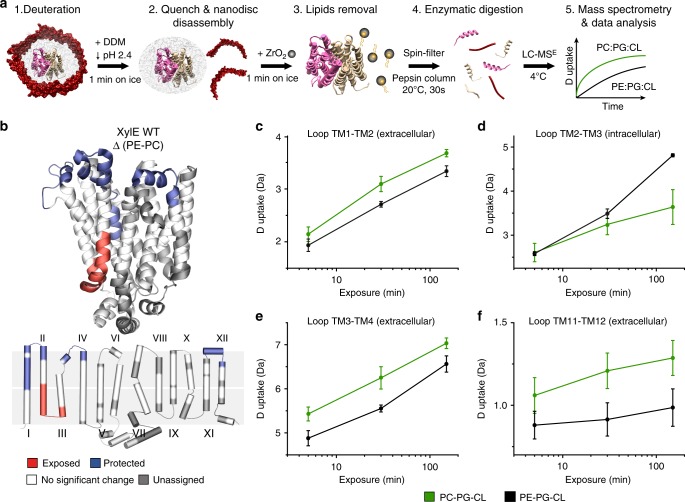
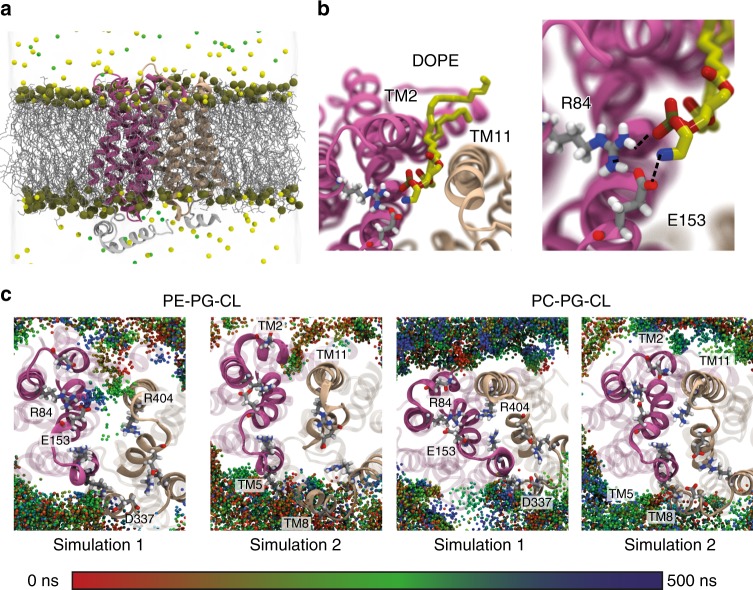
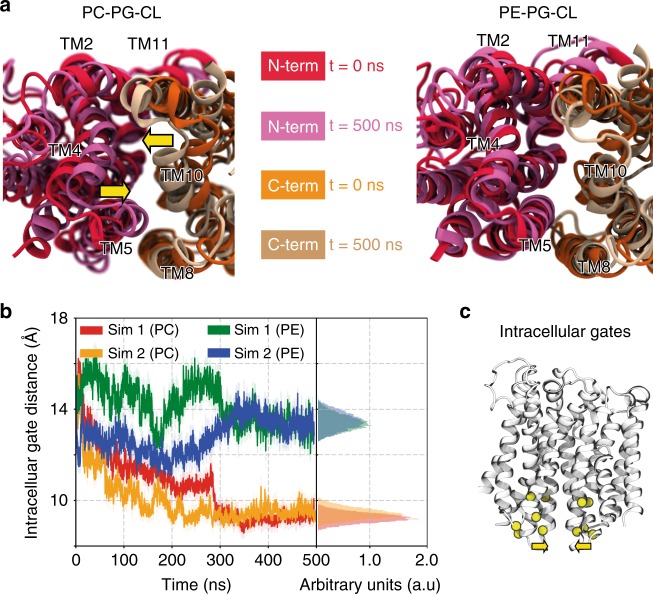
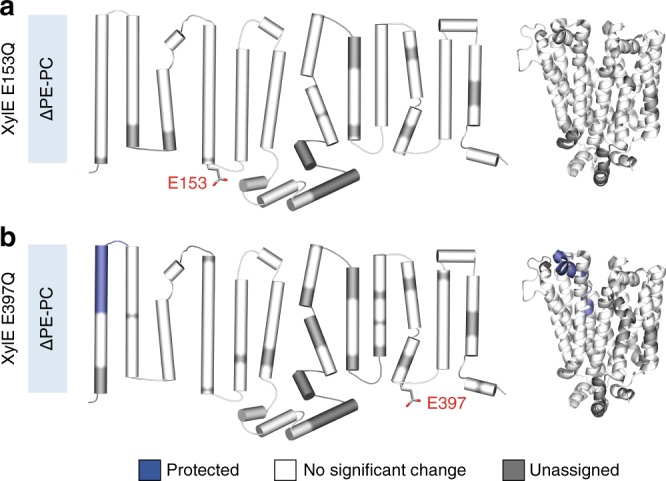
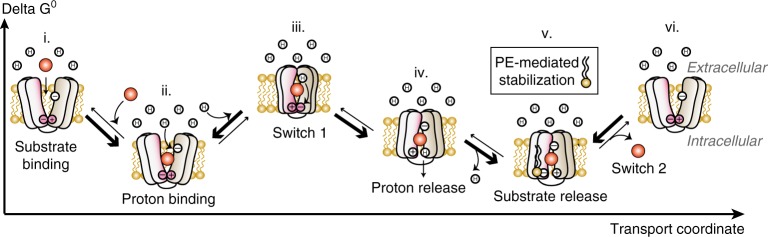
Secondary transporters undergo structural rearrangements to catalyze substrate translocation across the cell membrane - yet how such conformational changes happen within a lipid environment remains poorly understood. Here, we combine hydrogen-deuterium exchange mass spectrometry (HDX-MS) with molecular dynamics (MD) simulations to understand how lipids regulate the conformational dynamics of secondary transporters at the molecular level. Using the homologous transporters XylE, LacY and GlpT from Escherichia coli as model systems, we discover that conserved networks of charged residues act as molecular switches that drive the conformational transition between different states. We reveal that these molecular switches are regulated by interactions with surrounding phospholipids and show that phosphatidylethanolamine interferes with the formation of the conserved networks and favors an inward-facing state. Overall, this work provides insights into the importance of lipids in shaping the conformational landscape of an important class of transporters.
Overview
The claims and statistics of this paper haven’t been checked yet.
Run the check — free, no account needed. It reads the open-access text and checks the sources it cites.
Integrity signals
Registry
Cites
Statistics
Figures
Verification
Claims the paper makes
The claims and statistics of this paper haven’t been checked yet.
Run the check — free, no account needed. It reads the open-access text and checks the sources it cites.
Claims other papers make about this one
Each is checked against this paper’s own text: does it say what the citing paper says it does?
The cited source says what the claim attributes to it.
In the citing paper
“which has been experimentally shown to bias the conformational equilibria of membrane proteins (Martens et al., 2018; Muller et al., 2019; Immadisetty et al., 2019).”
From Sampling alternative conformational states of transporters and receptors with AlphaFold2 (2022) · cites this paper as Martens et al., 2018
Self-check
Percentages, sums and reported differences re-computed from the paper’s own numbers.
The self-check needs the paper’s full text.
Citations
Cites
Comparison of simple potential functions for simulating liquid water
Jorgensen, W. L., Chandrasekhar, J., Madura, J., Impey, R., & Klein, M. (1983) · The Journal of Chemical Physics · doi:10.1063/1.445869 · Cited by 38,397
Particle mesh Ewald: An N⋅log(N) method for Ewald sums in large systems
Darden, T., York, D., & Pedersen, L. (1993) · The Journal of Chemical Physics · doi:10.1063/1.464397 · Cited by 29,638
Scalable molecular dynamics with NAMD
Phillips, J. C., Braun, R., Wang, W., Gumbart, J., Tajkhorshid, E., Villa, E., Chipot, C., Skeel, R. D., Kalé, L., & Schulten, K. (2005) · Journal of Computational Chemistry · doi:10.1002/jcc.20289 · Cited by 16,914
CHARMM‐GUI: A web‐based graphical user interface for CHARMM
Jo, S., Kim, T., Iyer, V. G., & Im, W. (2008) · Journal of Computational Chemistry · doi:10.1002/jcc.20945 · Cited by 9,284
PROPKA3: Consistent Treatment of Internal and Surface Residues in Empirical p K a Predictions
Olsson, M. H. M., Søndergaard, C. R., Rostkowski, M., & Jensen, J. H. (2011) · Journal of Chemical Theory and Computation · doi:10.1021/ct100578z · Cited by 4,425
Update of the CHARMM all-atom additive force field for lipids: Validation on six lipid types
Klauda, J. B., Venable, R., Freites, J. A., O'Connor, J. W., Tobias, D., Mondragon-Ramirez, C., Vorobyov, I., MacKerell, A. D., & Pastor, R. (2010) · Journal of Physical Chemistry B · doi:10.1021/jp101759q · Cited by 4,369
2016 update of the PRIDE database and its related tools
Vizcaíno, J. A., Csordás, A., del‐Toro, N., Dianes, J. A., Griss, J., Lavidas, I., Mayer, G., Pérez‐Riverol, Y., Reisinger, F., Ternent, T., et al. (2015) · Nucleic Acids Research · doi:10.1093/nar/gkv1145 · Cited by 3,440
Pao, S. S., Paulsen, I. T., & Saier, M. H. (1998) · Microbiology and Molecular Biology Reviews · doi:10.1128/mmbr.62.1.1-34.1998 · Cited by 2,297
Simple Allosteric Model for Membrane Pumps
Jardetzky, O. (1966) · Nature · doi:10.1038/211969a0 · Cited by 1,283
Bacterial membrane lipids: diversity in structures and pathways
Sohlenkamp, C., & Geiger, O. (2015) · FEMS Microbiology Reviews · doi:10.1093/femsre/fuv008 · Cited by 1,193
Cited by
Sorted by citations
Computational Modeling of Realistic Cell Membranes
Marrink, . J., Corradi, V., Souza, P. C. T., Ingólfsson, H. I., Tieleman, D. P., & Sansom, M. S. P. (2019) · Chemical Reviews · doi:10.1021/acs.chemrev.8b00460 · Cited by 715
Sampling alternative conformational states of transporters and receptors with AlphaFold2
del Alamo, D., Sala, D., Mchaourab, H. S., & Meiler, J. (2022) · eLife · doi:10.7554/elife.75751 · Cited by 511
“Moreover, AF2 does not directly account for the lipid environment, which has been experimentally shown to bias the conformational equilibria of membrane proteins ( Martens et al., 2018 ; Muller et al., 2019 ; Immadisetty et al., 2019 ).”
BackgroundStructures and General Transport Mechanisms by the Major Facilitator Superfamily (MFS)
Drew, D., North, R. A., Nagarathinam, K., & Tanabe, M. (2021) · Chemical Reviews · doi:10.1021/acs.chemrev.0c00983 · Cited by 488
Emerging Diversity in Lipid–Protein Interactions
Corradi, V., Sejdiu, B. I., Galloso, H. M., Abdizadeh, H., Noskov, S. Y., Marrink, . J., & Tieleman, D. P. (2019) · Chemical Reviews · doi:10.1021/acs.chemrev.8b00451 · Cited by 470
James, E. I., Murphree, T. A., Vorauer, C., Engen, J. R., & Guttman, M. (2021) · Chemical Reviews · doi:10.1021/acs.chemrev.1c00279 · Cited by 308
Muller, M. P., Jiang, T., Sun, C., Lihan, M., Pant, S., Mahinthichaichan, P., Trifan, A., & Tajkhorshid, E. (2019) · Chemical Reviews · doi:10.1021/acs.chemrev.8b00608 · Cited by 282
Self-citationCHARMM-GUI Membrane Builder : Past, Current, and Future Developments and Applications
Feng, S., Park, S., Choi, Y. K., & Im, W. (2023) · Journal of Chemical Theory and Computation · doi:10.1021/acs.jctc.2c01246 · Cited by 197
Hodge, E. A., Benhaim, M. A., & Lee, K. K. (2019) · Protein Science · doi:10.1002/pro.3790 · Cited by 127
Lau, A. M. C., Claesen, J., Hansen, K., & Politis, A. (2020) · Bioinformatics · doi:10.1093/bioinformatics/btaa677 · Cited by 108
Defining how multiple lipid species interact with inward rectifier potassium (Kir2) channels
Duncan, A. L., Corey, R. A., & Sansom, M. S. P. (2020) · Proceedings of the National Academy of Sciences · doi:10.1073/pnas.1918387117 · Cited by 95
Conformational dynamics of the human serotonin transporter during substrate and drug binding
Möller, I. R., Slivacka, M., Nielsen, A. K., Rasmussen, S. G. F., Gether, U., Loland, C. J., & Rand, K. D. (2019) · Nature Communications · doi:10.1038/s41467-019-09675-z · Cited by 83
Jia, R., Martens, C., Shekhar, M., Pant, S., Pellowe, G. A., Lau, A. M. C., Findlay, H. E., Harris, N. J., Tajkhorshid, E., Booth, P. J., et al. (2020) · Nature Communications · doi:10.1038/s41467-020-20032-3 · Cited by 82
An embedded lipid in the multidrug transporter LmrP suggests a mechanism for polyspecificity
Debruycker, V., Hutchin, A., Masureel, M., Ficici, E., Martens, C., Legrand, P., Stein, R. A., Mchaourab, H. S., Faraldo-Gómez, J. D., Remaut, H., et al. (2020) · Nature Structural & Molecular Biology · doi:10.1038/s41594-020-0464-y · Cited by 69
Self-citationIon and lipid orchestration of secondary active transport
Drew, D., & Boudker, O. (2024) · Nature · doi:10.1038/s41586-024-07062-3 · Cited by 80
Lau, A. M. C., Ahdash, Z., Martens, C., & Politis, A. (2019) · Bioinformatics · doi:10.1093/bioinformatics/btz022 · Cited by 71
Structural comparison of GLUT1 to GLUT3 reveal transport regulation mechanism in sugar porter family
Custódio, T. F., Paulsen, P. A., Frain, K. M., & Pedersen, B. P. (2021) · Life Science Alliance · doi:10.26508/lsa.202000858 · Cited by 80
Dynamics of an LPS translocon induced by substrate and an antimicrobial peptide
Fiorentino, F., Sauer, J. B., Qiu, X., Corey, R. A., Cassidy, C. K., Mynors-Wallis, B., Mehmood, S., Bolla, J. R., Stansfeld, P. J., & Robinson, C. V. (2020) · Nature Chemical Biology · doi:10.1038/s41589-020-00694-2 · Cited by 69
Bavnhøj, L., Paulsen, P. A., Flores‐Canales, J. C., Schiøtt, B., & Pedersen, B. P. (2021) · Nature Plants · doi:10.1038/s41477-021-00992-0 · Cited by 65
Martens, C., Shekhar, M., Lau, A. M. C., Tajkhorshid, E., & Politis, A. (2019) · Nature Protocols · doi:10.1038/s41596-019-0219-6 · Cited by 61
Substrate-induced conformational dynamics of the dopamine transporter
Nielsen, A. K., Möller, I. R., Wang, Y., Rasmussen, S. G. F., Lindorff‐Larsen, K., Rand, K. D., & Loland, C. J. (2019) · Nature Communications · doi:10.1038/s41467-019-10449-w · Cited by 60
Pohl, E. E., & Jovanović, O. (2019) · Molecules · doi:10.3390/molecules24244545 · Cited by 63
Structure of the human respiratory complex II
Du, Z., Zhou, X., Lai, Y., Xu, J., Zhang, Y., Zhou, S., Feng, Z., Yu, L., Tang, Y., Wang, W., et al. (2023) · Proceedings of the National Academy of Sciences · doi:10.1073/pnas.2216713120 · Cited by 66
Single‐Molecule FRET of Membrane Transport Proteins
Bartels, K., Lasitza‐Male, T., Hofmann, H., & Löw, C. (2021) · ChemBioChem · doi:10.1002/cbic.202100106 · Cited by 56
Computer simulations of protein–membrane systems
Loschwitz, J., Olubiyi, O. O., Hub, J. S., Strodel, B., & Poojari, C. (2020) · Progress in molecular biology and translational science · doi:10.1016/bs.pmbts.2020.01.001 · Cited by 54
Inward-facing conformation of a multidrug resistance MATE family transporter
Zakrzewska, S., Mehdipour, A. R., Malviya, V. N., Nonaka, T., Koepke, J., Muenke, C., Hausner, W., Hummer, G., Safarian, S., & Michel, H. (2019) · Proceedings of the National Academy of Sciences · doi:10.1073/pnas.1904210116 · Cited by 49
Interpretation of HDX Data by Maximum-Entropy Reweighting of Simulated Structural Ensembles
Bradshaw, R. T., Marinelli, F., Faraldo‐Gómez, J. D., & Forrest, L. R. (2020) · Biophysical Journal · doi:10.1016/j.bpj.2020.02.005 · Cited by 46
Current problems and future avenues in proteoliposome research
Amati, A. M., Graf, S., Deutschmann, S., Dolder, N., & von Ballmoos, C. (2020) · Biochemical Society Transactions · doi:10.1042/bst20190966 · Cited by 43
Current Methods for Detecting Cell Membrane Transient Interactions
Bagheri, Y., Ali, A. A., & You, M. (2020) · Frontiers in Chemistry · doi:10.3389/fchem.2020.603259 · Cited by 41
Stariha, J. T., Hoffmann, R. M., Hamelin, D. J., & Burke, J. E. (2021) · Methods in molecular biology · doi:10.1007/978-1-0716-1197-5_22 · Cited by 42
Hydrogen-deuterium exchange mass spectrometry of membrane proteins in lipid nanodiscs
Redhair, M., Clouser, A. F., & Atkins, W. M. (2019) · Chemistry and Physics of Lipids · doi:10.1016/j.chemphyslip.2019.02.007 · Cited by 42
Martens, C., & Politis, A. (2020) · Protein Science · doi:10.1002/pro.3853 · Cited by 40
Probing membrane protein–lipid interactions
Agasid, M. T., & Robinson, C. V. (2021) · Current Opinion in Structural Biology · doi:10.1016/j.sbi.2021.03.010 · Cited by 44
Sipe, S. N., Patrick, J. W., Laganowsky, A., & Brodbelt, J. S. (2020) · Analytical Chemistry · doi:10.1021/acs.analchem.9b03689 · Cited by 39
Renard, K., & Byrne, B. (2021) · International Journal of Molecular Sciences · doi:10.3390/ijms22169026 · Cited by 41
Toporowska, J., Kapoor, P., Musgaard, M., Gherbi, K., Sengmany, K., Qu, F., Soave, M., Yen, H., Hansen, K., Jazayeri, A., et al. (2024) · Nature Communications · doi:10.1038/s41467-024-53161-0 · Cited by 36
Kovács, T., Zákány, F., & Nagy, P. (2022) · Cancers · doi:10.3390/cancers14040944 · Cited by 37
Crucial functions of gut microbiota on gut–liver repair
Wang, Y., Yan, H., Zheng, Q., & Sun, X. (2025) · hLife · doi:10.1016/j.hlife.2025.01.001 · Cited by 39
The human organic cation transporter OCT1 and its role as a target for drug responses
Brosseau, N., & Ramotar, D. (2019) · Drug Metabolism Reviews · doi:10.1080/03602532.2019.1670204 · Cited by 34
Principles of Alternating Access in LeuT-fold Transporters: Commonalities and Divergences
del Alamo, D., Meiler, J., & Mchaourab, H. S. (2022) · Journal of Molecular Biology · doi:10.1016/j.jmb.2022.167746 · Cited by 32
Suades, A., Qureshi, A. A., McComas, S. E., Coincon, M., Rudling, A., Chatzikyriakidou, Y., Landreh, M., Carlsson, J., & Drew, D. (2023) · Nature Communications · doi:10.1038/s41467-023-39711-y · Cited by 33
Torres, M., Rosselló, C. A., Fernández‐García, P., Lladó, V., Kakhlon, O., & Escribá, P. V. (2020) · International Journal of Molecular Sciences · doi:10.3390/ijms21072322 · Cited by 35
Chatzikyriakidou, Y., Ahn, D.-H., Nji, E., & Drew, D. (2021) · Nature Protocols · doi:10.1038/s41596-021-00619-w · Cited by 32
‘Assembly and analysis of cell-scale membrane envelopes’
Vermaas, J. V., Mayne, C. G., Shinn, E., & Tajkhorshid, E. (2022) · Journal of Chemical Information and Modeling · doi:10.1021/acs.jcim.1c01050 · Cited by 30
Giladi, M., & Khananshvili, D. (2020) · Frontiers in Pharmacology · doi:10.3389/fphar.2020.00070 · Cited by 30
Principles of Alternating Access in Multidrug and Toxin Extrusion (MATE) Transporters
Claxton, D. P., Jagessar, K. L., & Mchaourab, H. S. (2021) · Journal of Molecular Biology · doi:10.1016/j.jmb.2021.166959 · Cited by 29
Computational Dissection of Membrane Transport at a Microscopic Level
Jiang, T., Wen, P., Trebesch, N., Zhao, Z., Pant, S., Kapoor, K., Shekhar, M., & Tajkhorshid, E. (2019) · Trends in Biochemical Sciences · doi:10.1016/j.tibs.2019.09.001 · Cited by 31
Rasmussen, T., Rasmussen, A., Yang, L., Kaul, C., Black, S. S., Galbiati, H., Conway, S. J., Miller, S., Blount, P., & Booth, I. R. (2019) · Journal of Molecular Biology · doi:10.1016/j.jmb.2019.05.043 · Cited by 29
Membrane Chemistry Tunes the Structure of a Peptide Transporter
Lasitza‐Male, T., Bartels, K., Jungwirth, J., Wiggers, F., Rosenblum, G., Hofmann, H., & Löw, C. (2020) · Angewandte Chemie International Edition · doi:10.1002/anie.202008226 · Cited by 25
Jia, R., Bradshaw, R. T., Calvaresi, V., & Politis, A. (2023) · Journal of the American Chemical Society · doi:10.1021/jacs.2c06148 · Cited by 27
Scratching the surface: native mass spectrometry of peripheral membrane protein complexes
Sahin, C., Reid, D. J., Marty, M. T., & Landreh, M. (2020) · Biochemical Society Transactions · doi:10.1042/bst20190787 · Cited by 29
Ahdash, Z., Pyle, E., Allen, W. J., Corey, R. A., Collinson, I. R., & Politis, A. (2019) · eLife · doi:10.7554/elife.47402 · Cited by 21
Korona, D., Dirnberger, B., Giachello, C. N., Queiroz, R. M. L., Popovic, R., Müller, K. H., Minde, D., Deery, M. J., Johnson, G., Firth, L. C., et al. (2022) · eLife · doi:10.7554/elife.74322 · Cited by 25
Mass spectrometry of membrane protein complexes
Bender, J., & Schmidt, C. (2019) · Biological Chemistry · doi:10.1515/hsz-2018-0443 · Cited by 27
The Role of the Membrane in Transporter Folding and Activity
Ernst, M., & Robertson, J. (2021) · Journal of Molecular Biology · doi:10.1016/j.jmb.2021.167103 · Cited by 24
Woubshete, M., Cioccolo, S., & Byrne, B. (2024) · ChemPlusChem · doi:10.1002/cplu.202300678 · Cited by 28
Guellec, J., Elbahnsi, A., Tertre, M. L., Uguen, K., Gourlaouen, I., Férec, C., Ka, C., Callebaut, I., & Gac, G. L. (2019) · The FASEB Journal · doi:10.1096/fj.201901857r · Cited by 21
Membrane Lipid Requirements of the Lysine Transporter Lyp1 from Saccharomyces cerevisiae
Klooster, J. S. V. ’., Cheng, T., Sikkema, H. R., Jeucken, A., Moody, D. B., & Poolman, B. (2020) · Journal of Molecular Biology · doi:10.1016/j.jmb.2020.04.029 · Cited by 22
Clouser, A. F., Alam, Y. H., & Atkins, W. M. (2020) · Biochemistry · doi:10.1021/acs.biochem.0c00824 · Cited by 22
Lipid Interactions Between Flaviviruses and Mosquito Vectors
Vial, T., Marti, G., Missé, D., & Pompon, J. (2021) · Frontiers in Physiology · doi:10.3389/fphys.2021.763195 · Cited by 21
Javed, W., Griffiths, D., & Politis, A. (2023) · Essays in Biochemistry · doi:10.1042/ebc20220173 · Cited by 22
Advances in Mass Spectrometry on Membrane Proteins
Yang, H.-C., Li, W., Sun, J., & Gross, M. L. (2023) · Membranes · doi:10.3390/membranes13050457 · Cited by 23
An Unusually Rapid Protein Backbone Modification Stabilizes the Essential Bacterial Enzyme MurA
Zhang, T., Hansen, K., Politis, A., & Müller, M. M. (2020) · Biochemistry · doi:10.1021/acs.biochem.0c00502 · Cited by 20
On the interplay between lipids and asymmetric dynamics of an NBS degenerate ABC transporter
Tóth, Á., Janaszkiewicz, A., Crespi, V., & Meo, F. D. (2023) · Communications Biology · doi:10.1038/s42003-023-04537-3 · Cited by 19
Intrinsically disordered ectodomain modulates ion permeation through a metal transporter
Aupič, J., Lapenta, F., Janoš, P., & Magistrato, A. (2022) · Proceedings of the National Academy of Sciences · doi:10.1073/pnas.2214602119 · Cited by 18
Tang, H., Li, H. Z., Prakaash, D., Pedebos, C., Qiu, X., Sauer, D. B., Khalid, S., Duerr, K. L., & Robinson, C. V. (2023) · Molecular Cell · doi:10.1016/j.molcel.2023.06.033 · Cited by 18
Membrane Protein Structures in Native Cellular Membranes Revealed by Solid-State NMR Spectroscopy
Zhang, Y., Gan, Y., Zhao, W., Zhang, X., Zhao, Y., Xie, H., & Yang, J. (2023) · JACS Au · doi:10.1021/jacsau.3c00564 · Cited by 17
Assessing the Role of Lipids in the Molecular Mechanism of Membrane Proteins
Jodaitis, L., van Oene, T., & Martens, C. (2021) · International Journal of Molecular Sciences · doi:10.3390/ijms22147267 · Cited by 20
Šolinc, G., Srnko, M., Merzel, F., Crnković, A., Kozorog, M., Podobnik, M., & Anderluh, G. (2025) · Nature Communications · doi:10.1038/s41467-025-58334-z · Cited by 17
Hammerschmid, D., Calvaresi, V., Bailey, C., Lewis, B. R., Politis, A., Morris, M. R., Denbigh, L., Anderson, M., & Reading, E. (2023) · Analytical Chemistry · doi:10.1021/acs.analchem.2c04876 · Cited by 16
Kell, D. B. (2021) · Advances in microbial physiology/Advances in Microbial Physiology · doi:10.1016/bs.ampbs.2021.01.001 · Cited by 16
Plant Sulfate Transporters in the Low Phytic Acid Network: Some Educated Guesses
Sacchi, G. A., & Nocito, F. F. (2019) · Plants · doi:10.3390/plants8120616 · Cited by 16
Janaszkiewicz, A., Tóth, Á., Faucher, Q., Martin, M., Chantemargue, B., Barin-Le Guellec, C., Marquet, P., & Di Meo, F. (2022) · Scientific Reports · doi:10.1038/s41598-022-10755-2 · Cited by 15
Cyclic Ion Mobility for Hydrogen/Deuterium Exchange-Mass Spectrometry Applications
Griffiths, D., Anderson, M., Richardson, K., Inaba‐Inoue, S., Allen, W. J., Collinson, I. R., Beis, K., Morris, M. R., Giles, K., & Politis, A. (2024) · Analytical Chemistry · doi:10.1021/acs.analchem.3c05753 · Cited by 15
Structural predictions of the functions of membrane proteins from HDX-MS
Lau, A. M. C., Jia, R., Bradshaw, R. T., & Politis, A. (2020) · Biochemical Society Transactions · doi:10.1042/bst20190880 · Cited by 13
Flipping the switch: dynamic modulation of membrane transporter activity in bacteria
Elston, R., Mulligan, C., & Thomas, G. H. (2023) · Microbiology · doi:10.1099/mic.0.001412 · Cited by 13
Phospholipids alter activity and stability of mitochondrial membrane-bound ubiquitin ligase MARCH5
Merklinger, L., Bauer, J., Pedersen, P. A., Damgaard, R. B., & Morth, J. P. (2022) · Life Science Alliance · doi:10.26508/lsa.202101309 · Cited by 11
Molecular modeling in cardiovascular pharmacology: Current state of the art and perspectives
Lagoutte‐Renosi, J., Allemand, F., Ramseyer, C., Yesylevskyy, S. O., & Davani, S. (2021) · Drug Discovery Today · doi:10.1016/j.drudis.2021.11.026 · Cited by 12
Linking function to global and local dynamics in an elevator-type transporter
Ciftci, D., Martens, C., Ghani, V. G., Blanchard, S. C., Politis, A., Huysmans, G. H. M., & Boudker, O. (2021) · Proceedings of the National Academy of Sciences · doi:10.1073/pnas.2025520118 · Cited by 11
Rosetta Energy Analysis of AlphaFold2 models: Point Mutations and Conformational EnsemblesPreprint
Stein, R. A., & Mchaourab, H. S. (2023) · bioRxiv (Cold Spring Harbor Laboratory) · doi:10.1101/2023.09.05.556364 · Cited by 11
Comparative analysis of STP6 and STP10 unravels molecular selectivity in sugar transport proteins
Andersen, C. G., Bavnhøj, L., Brag, S., Bohush, A., Chrenková, A., Driller, J. H., & Pedersen, B. P. (2025) · Proceedings of the National Academy of Sciences · doi:10.1073/pnas.2417370122 · Cited by 14
Janaszkiewicz, A., Tóth, Á., Faucher, Q., Arnion, H., Védrenne, N., Guellec, C. B., Marquet, P., & Meo, F. D. (2023) · Biomedicine & Pharmacotherapy · doi:10.1016/j.biopha.2023.114342 · Cited by 14
Integrative Mass Spectrometry–Based Approaches for Modeling Macromolecular Assemblies
Lau, A. M. C., & Politis, A. (2020) · Methods in molecular biology · doi:10.1007/978-1-0716-1126-5_12 · Cited by 9
Sampson, C. D. D., Bellavista, C. F., Stewart, M. J., & Mulligan, C. (2021) · Biochemical Journal · doi:10.1042/bcj20210061 · Cited by 9
MSe Collision Energy Optimization for the Analysis of Membrane Proteins Using HDX-cIMS
Pabon, J. P. R., Akbar, Z., & Politis, A. (2024) · Journal of the American Society for Mass Spectrometry · doi:10.1021/jasms.4c00093 · Cited by 9
Advances in mass spectrometry‐based footprinting of membrane proteins
Sun, J., Li, W., & Gross, M. L. (2022) · PROTEOMICS · doi:10.1002/pmic.202100222 · Cited by 10
Folding of prestin’s anion-binding site and the mechanism of outer hair cell electromotility
Lin, X., Haller, P. R., Bavi, N., Faruk, N. F., Perozo, E., & Sosnick, T. R. (2023) · eLife · doi:10.7554/elife.89635 · Cited by 8
Pant, S., Dehghani‐Ghahnaviyeh, S., Trebesch, N., Rasouli, A., Chen, T., Kapoor, K., Wen, P., & Tajkhorshid, E. (2025) · The Journal of Physical Chemistry B · doi:10.1021/acs.jpcb.5c00104 · Cited by 7
Wallant, K. C. ’., & Martens, C. (2022) · Biochimie · doi:10.1016/j.biochi.2022.08.014 · Cited by 7
In‐Cell Fast Photochemical Oxidation Interrogates the Native Structure of Integral Membrane Proteins
Sun, J., Mierxiati, S., Rempel, D. L., Cao, Q., Chai, M., Li, W., & Gross, M. L. (2025) · Angewandte Chemie International Edition · doi:10.1002/anie.202424779 · Cited by 6
Calvaresi, V., Iacono, L. D., Borghi, S., Luzzi, E., Biolchi, A., Benucci, B., Peschiera, I., Peschiera, I., Giusti, F., Fontana, L. E., et al. (2026) · Nature Communications · doi:10.1038/s41467-026-70059-1 · Cited by 6
Simulations on an undamped electromechanical vibration of microtubules in cytosol
Li, S., Wang, C., & Nithiarasu, P. (2019) · Applied Physics Letters · doi:10.1063/1.5097204 · Cited by 6
Tertre, M. L., Elbahnsi, A., Ka, C., Callebaut, I., & Gac, G. L. (2021) · International Journal of Molecular Sciences · doi:10.3390/ijms22126412 · Cited by 6
Debbiche, R., Elbahnsi, A., Uguen, K., Ka, C., Callebaut, I., & Gac, G. L. (2024) · The FASEB Journal · doi:10.1096/fj.202400337r · Cited by 7
Impact of nanodisc lipid composition on cell-free expression of proton-coupled folate transporter
Do, H. Q., Bassil, C. M., Andersen, E. I., & Jansen, M. (2021) · PLoS ONE · doi:10.1371/journal.pone.0253184 · Cited by 5
Structural comparison of GLUT1 to GLUT3 reveal transport regulation mechanism in Sugar Porter familyPreprint
Custódio, T. F., Paulsen, P. A., Frain, K. M., & Pedersen, B. P. (2020) · bioRxiv (Cold Spring Harbor Laboratory) · doi:10.1101/2020.02.24.962258 · Cited by 5
Dynamic structures of a membrane transporter in native cellular membranes
Xie, H., Gan, Y., Zhao, W., Duan, M., Shen, Y., Tan, H., Zhang, Y., Tong, Q., Zhao, Y., & Yang, J. (2025) · Science Advances · doi:10.1126/sciadv.adv4583 · Cited by 4
Energetic and structural control of polyspecificity in a multidrug transporter
Miller, S. T., Henzler‐Wildman, K. A., & Raman, S. (2025) · Proceedings of the National Academy of Sciences · doi:10.1073/pnas.2511892122 · Cited by 3
Nguyen, K., Strauss, T., Refaeli, B., Hiller, R., Vinogradova, O., & Khananshvili, D. (2024) · International Journal of Molecular Sciences · doi:10.3390/ijms25136909 · Cited by 4
Dionysopoulou, M., & Diallinas, G. (2021) · Journal of Fungi · doi:10.3390/jof7070514 · Cited by 3
Metadata
- Authors
- Martens, C., Shekhar, M., Borysik, A. J., Lau, A. M., Reading, E., Tajkhorshid, E., Booth, P. J., & Politis, A.
- Affiliations
- University of Illinois Urbana-Champaign (US)
- King's College London (GB)
- Corresponding author
- Politis, Argyris
- ORCID
- Venue
- Nature Communications
- Published
- 2018-10-08
- Volume
- 9
- Issue
- 1
- Pages
- 4151-4151
- ISSN
- 2041-1723 (ISSN-L)
- PMC
- PMC6175955
- OpenAlex
- W2894708945
- Cited by
- 134
- References
- 70
- Citations by year
- 2026: 11 · 2025: 11 · 2024: 8 · 2023: 20 · 2022: 13 · 2021: 24 · 2020: 26 · 2019: 21
- FWCI
- 6.31
- Type
- journal article
- Language
- en
- Open access
- gold
- doi.org
- Locations
- Nature Communications (publishedVersion, cc-by)
- Europe PMC (PubMed Central) (publishedVersion, cc-by)
- PubMed Central (publishedVersion, cc-by)
- PubMed (publishedVersion)
- ePrints Soton (University of Southampton) (acceptedVersion, cc-by)
- RePEc: Research Papers in Economics (submittedVersion)
- Dépôt institutionnel de l'Université libre de Bruxelles (Université Libre de Bruxelles) (submittedVersion, other-oa)
- DOAJ (DOAJ: Directory of Open Access Journals) (submittedVersion, cc-by-sa)
- DOAJ (DOAJ: Directory of Open Access Journals) (submittedVersion)
- Research Portal (King's College London) (submittedVersion, cc-by)
- Funders
- Wellcome Trust (109854/Z/15/Z)
- Medical Research Council (MC_PC_15031)
- Biotechnology and Biological Sciences Research Council (BB/N011201/1)
- U.S. Department of Health & Human Services | National Institutes of Health (R01-GM123455)
- Topics
- Life Sciences › Biochemistry, Genetics and Molecular Biology › Molecular Biology › Protein Structure and Dynamics
- Health Sciences › Medicine › Oncology › Drug Transport and Resistance Mechanisms
- Life Sciences › Biochemistry, Genetics and Molecular Biology › Molecular Biology › Lipid Membrane Structure and Behavior
- Keywords
- secondary transporters, protein-lipid interactions, conformational dynamics, molecular switches, phosphatidylethanolamine, XylE, lactose permease, GlpT, Escherichia coli, substrate translocation, membrane transport
- MeSH terms
- Cell Membrane, Escherichia coli, Membrane Lipids, Membrane Proteins, Monosaccharide Transport Proteins, Protein Binding, Protein Conformation, Mass Spectrometry, Membrane Transport Proteins, Symporters, Escherichia coli Proteins, Deuterium Exchange Measurement, Molecular Dynamics Simulation
About these checks
Registry, retraction, Cites and statistics results are computed, not judged, with one exception: a printed reference that no index lists is read once by a model before it counts as a citation error. Claims are extracted by a model and kept only when their quote appears verbatim in the text; each cited source is then checked, with a model’s help, for whether it says what the claim relies on. Those verdicts can be wrong — read the claim’s quote and the cited source before relying on one.
Statistics and arithmetic are recomputed, not judged.
Confidence bands are shown only for fields calibrated on our annotated test set. None is calibrated yet, so no band is shown.
What counts as a claim ›How we measure confidence ›How we check this ›
Are you an author, or do you see a problem with this page? Request a review
