Cited by 130Antifungal resistance and susceptibilityFungal and yeast genetics researchSphingolipid Metabolism and Signaling

The DOI matches its Crossref record; 67 of the 67 references it cites were found in a registry or an index.

Candida albicans gains azole resistance by altering sphingolipid composition

Open access

Abstract

Fungal infections by drug-resistant Candida albicans pose a global public health threat. However, the pathogen's diploid genome greatly hinders genome-wide investigations of resistance mechanisms. Here, we develop an efficient piggyBac transposon-mediated mutagenesis system using stable haploid C. albicans to conduct genome-wide genetic screens. We find that null mutants in either gene FEN1 or FEN12 (encoding enzymes for the synthesis of very-long-chain fatty acids as precursors of sphingolipids) exhibit resistance to fluconazole, a first-line antifungal drug. Mass-spectrometry analyses demonstrate changes in cellular sphingolipid composition in both mutants, including substantially increased levels of several mannosylinositolphosphoceramides with shorter fatty-acid chains. Treatment with fluconazole induces similar changes in wild-type cells, suggesting a natural response mechanism. Furthermore, the resistance relies on a robust upregulation of sphingolipid biosynthesis genes. Our results shed light into the mechanisms underlying azole resistance, and the new transposon-mediated mutagenesis system should facilitate future genome-wide studies of C. albicans.

Overview

The claims and statistics of this paper haven’t been checked yet.

Run the check — free, no account needed. It reads the open-access text and checks the sources it cites.

A few free checks a day · papers already verified open instantly · results are public

Integrity signals

Registry

Crossref · 10.1038/s41467-018-06944-1

Cites

67 of 67 references verified0 citation errors · 0 not checkable

Statistics

Figures

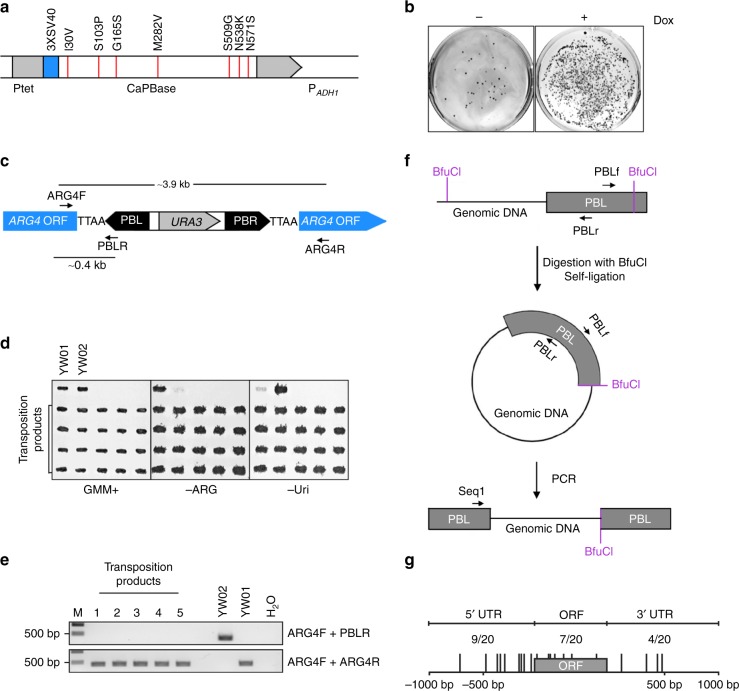
Fig. 1 PB transposition in haploid C. albicans. a Schematic description of the CaPBase construct inserted at the ADH1 locus. Ptet, Tet-On promoter; 3XSV40, SV40 nuclear localization signal; and PADH1, ADH1 promoter. Hyperactive mutations are indicated along the top. b Selection of transformants with PB[URA3] integration on plates. YW01 cells were grown in YPD for 48 h in the presence (+) or absence (−) of Dox before transformation with pPB[URA3]. Transformation products were spread onto GMM plates (90 mm Petri dishes). c Schematic description of the PB[URA3] cassette integrated within ARG4. Arrows indicate the PCR primers used to detect PB excision. d Confirmation of the auxotrophic phenotypes of transposition products of YW02. Strains grown on a GMM+Uri+Arg+His (GMM+) plate were replica-transferred onto a GMM+Uri+His (-Arg) or GMM+Arg+His (-Uri) plate and then incubated at 30 °C overnight. YW01 and YW02 were included as controls. e Precise excision of PB from the ARG4 locus. Representative gel electrophoresis results of PCR products amplified from YW02 transposition products using primers shown in c. f Schematic description of the identification of PB insertion sites by inverse PCR. Arrows indicate the PCR (PBLf and PBLr) and sequencing (Seq1) primers used. g Distribution of PB insertion sites in and around ORFs in YW02 transposition products. Positions in the ORF were determined by treating the entire length of an ORF as 100 and then determining the relative position of an insertion in the ORF. Positions in the 5′ or 3′ region were determined by whether the insertion was closest to the 5′ or 3′ end of an ORF
Fig. 1 PB transposition in haploid C. albicans. a Schematic description of the CaPBase construct inserted at the ADH1 locus. Ptet, Tet-On promoter; 3XSV40, SV40 nuclear localization signal; and PADH1, ADH1 promoter. Hyperactive mutations are indicated along the top. b Selection of transformants with PB[URA3] integration on plates. YW01 cells were grown in YPD for 48 h in the presence (+) or absence (−) of Dox before transformation with pPB[URA3]. Transformation products were spread onto GMM plates (90 mm Petri dishes). c Schematic description of the PB[URA3] cassette integrated within ARG4. Arrows indicate the PCR primers used to detect PB excision. d Confirmation of the auxotrophic phenotypes of transposition products of YW02. Strains grown on a GMM+Uri+Arg+His (GMM+) plate were replica-transferred onto a GMM+Uri+His (-Arg) or GMM+Arg+His (-Uri) plate and then incubated at 30 °C overnight. YW01 and YW02 were included as controls. e Precise excision of PB from the ARG4 locus. Representative gel electrophoresis results of PCR products amplified from YW02 transposition products using primers shown in c. f Schematic description of the identification of PB insertion sites by inverse PCR. Arrows indicate the PCR (PBLf and PBLr) and sequencing (Seq1) primers used. g Distribution of PB insertion sites in and around ORFs in YW02 transposition products. Positions in the ORF were determined by treating the entire length of an ORF as 100 and then determining the relative position of an insertion in the ORF. Positions in the 5′ or 3′ region were determined by whether the insertion was closest to the 5′ or 3′ end of an ORFCC BY · PubMed Central
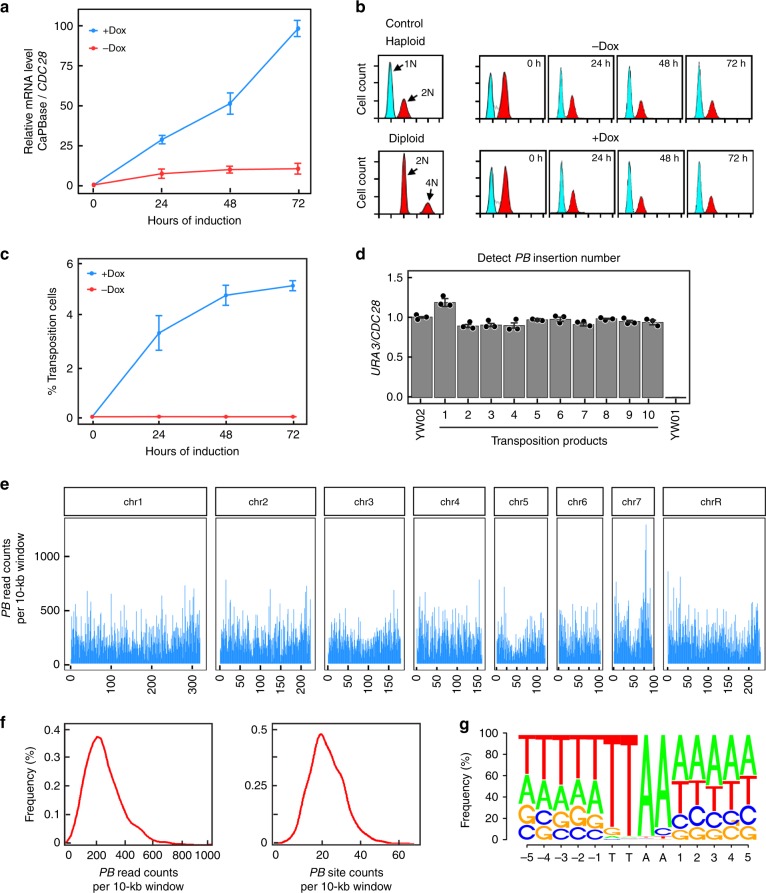
Fig. 2 PB transposition and insert distribution in C. albicans genome. a qPCR analysis of CaPBase expression during transposition induction. CDC28 mRNA level was used for normalization. Error bars represent standard deviation (s.d.) from the mean of triplicate samples. b Ploidy analysis during transposition induction by flow cytometry. The DNA content of induced cells at each time point was compared with that of haploid and diploid control strains. c Estimation of transposition efficiency in YW02. See the text for description. Error bars represent s.d. from the mean of three independent experiments. d Analysis of PB copy number in transposition products by comparing the levels of URA3 and CDC28 DNA using qPCR. YW01 and YW02 were included as controls. Error bars represent s.d. from the mean of triplicate samples. e Genome-wide NGS analysis of PB distribution. PB-specific reads were plotted in 10-kb sliding windows. f Histogram of PB-specific read counts and PB-specific site counts per 10-kb window. g Motif analysis of PB-insertion sites
Fig. 2 PB transposition and insert distribution in C. albicans genome. a qPCR analysis of CaPBase expression during transposition induction. CDC28 mRNA level was used for normalization. Error bars represent standard deviation (s.d.) from the mean of triplicate samples. b Ploidy analysis during transposition induction by flow cytometry. The DNA content of induced cells at each time point was compared with that of haploid and diploid control strains. c Estimation of transposition efficiency in YW02. See the text for description. Error bars represent s.d. from the mean of three independent experiments. d Analysis of PB copy number in transposition products by comparing the levels of URA3 and CDC28 DNA using qPCR. YW01 and YW02 were included as controls. Error bars represent s.d. from the mean of triplicate samples. e Genome-wide NGS analysis of PB distribution. PB-specific reads were plotted in 10-kb sliding windows. f Histogram of PB-specific read counts and PB-specific site counts per 10-kb window. g Motif analysis of PB-insertion sitesCC BY · PubMed Central
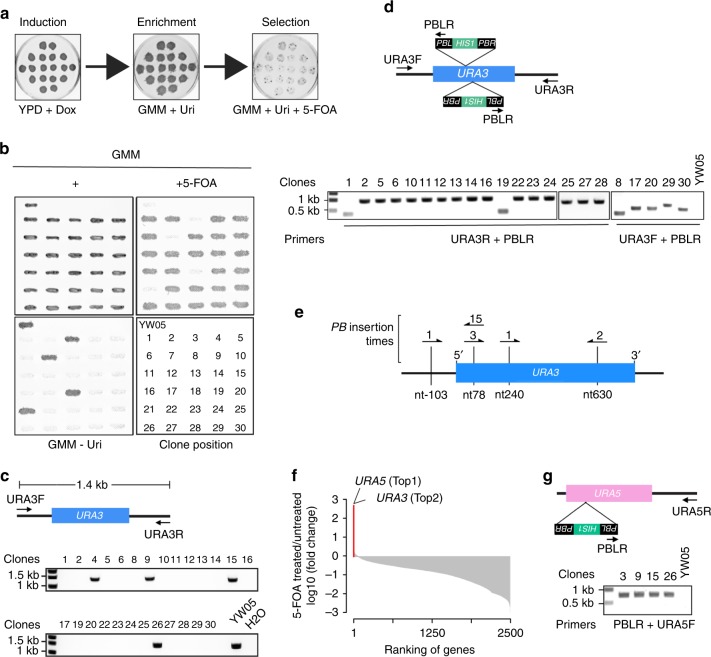
Fig. 3 Genetic screen for 5-FOA-resistant mutants caused by PB transposition. a An illustration of the screening procedure. b Confirmation of the phenotype of 5-FOA-resistant mutants. Strains grown on a GMM+Uri+Arg+His (+) plate were replica-transferred onto a GMM+Uri+5-FOA (+5-FOA) or GMM+Arg+His (GMM–Uri) plate and then incubated at 30 °C overnight. YW05 was included as a control. The lower right panel shows the strain layout. c Characterization of 5-FOA-resistant mutants by colony PCR. Arrows indicate the primers used to detect URA3. d PCR identification of PB insertion sites at the URA3 locus of the true 5-FOA-resistant clones from b. Arrows indicate the primers used. e PB insertion sites identified at the URA3 locus. Sequence analysis identified four different sites indicated by vertical lines. Arrows denote PB insertions, and the direction of arrows indicate the direction of HIS1 transcription in PB. The numbers indicate the number of mutants associated with each insertion site. f Fold changes of genes with PB inserts after growing the mutant library in media containing 5-FOA in comparison with the same library grown in normal media. The top two genes are highlighted in red. g PCR identification of PB insertion sites at the URA5 locus. Arrows denote the primers used
Fig. 3 Genetic screen for 5-FOA-resistant mutants caused by PB transposition. a An illustration of the screening procedure. b Confirmation of the phenotype of 5-FOA-resistant mutants. Strains grown on a GMM+Uri+Arg+His (+) plate were replica-transferred onto a GMM+Uri+5-FOA (+5-FOA) or GMM+Arg+His (GMM–Uri) plate and then incubated at 30 °C overnight. YW05 was included as a control. The lower right panel shows the strain layout. c Characterization of 5-FOA-resistant mutants by colony PCR. Arrows indicate the primers used to detect URA3. d PCR identification of PB insertion sites at the URA3 locus of the true 5-FOA-resistant clones from b. Arrows indicate the primers used. e PB insertion sites identified at the URA3 locus. Sequence analysis identified four different sites indicated by vertical lines. Arrows denote PB insertions, and the direction of arrows indicate the direction of HIS1 transcription in PB. The numbers indicate the number of mutants associated with each insertion site. f Fold changes of genes with PB inserts after growing the mutant library in media containing 5-FOA in comparison with the same library grown in normal media. The top two genes are highlighted in red. g PCR identification of PB insertion sites at the URA5 locus. Arrows denote the primers usedCC BY · PubMed Central
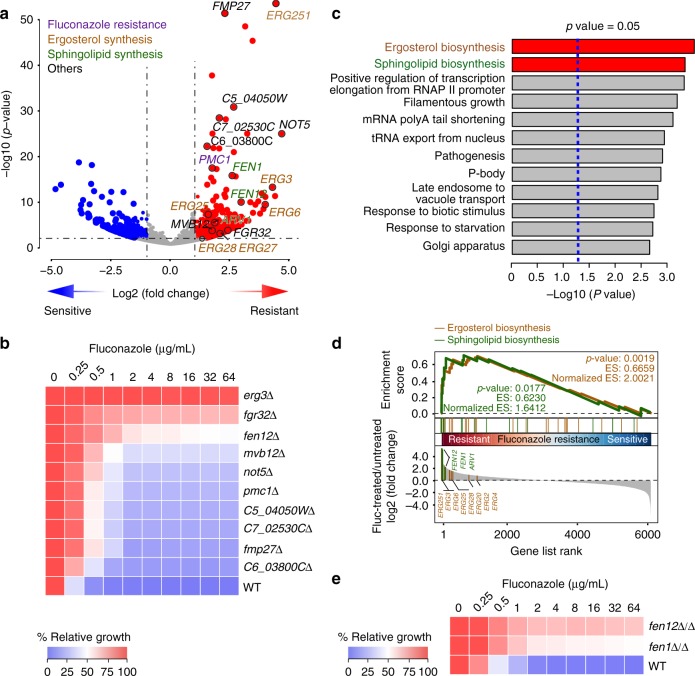
Fig. 4 Genetic screens for fluconazole-resistant mutants. a Volcano plot of fold changes of genes with PB inserts in PB transposition mutants grown in media containing 100 µg/mL fluconazole in comparison with the same mutants grown in normal media. p-Values were calculated using the Wald test. Ten candidates selected for phenotype confirmation are indicated. Genes known to be associated with fluconazole resistance and ergosterol and sphingolipid biosynthesis are shown with different colors. b Gene deletion of 10 candidates randomly selected from the top-ranked genes in a confirms increased resistance to fluconazole. Fluconazole susceptibility was evaluated using the standard CLSI broth microdilution protocol67. Cultures were incubated for 24 h, and growth was measured as OD600 and expressed as a percentage of the growth in the control wells with no drug (DMSO alone) for each strain. c Gene Ontology (GO) analysis of the PB-mutated genes that led to statistically significant fold increases (p < 0.05) after fluconazole treatment. Red bars highlight the ergosterol and sphingolipid biosynthesis pathway. p-Values were from Fisher’s exact test. d Gene Set Enrichment Analysis (GSEA) of the NGS data from a. p-Values were determined using the Kolmogorov–Smirnov test. e Homozygous deletion of FEN1 or FEN12 in BWP17 also results in increased fluconazole resistance. The assay was done as described in b
Fig. 4 Genetic screens for fluconazole-resistant mutants. a Volcano plot of fold changes of genes with PB inserts in PB transposition mutants grown in media containing 100 µg/mL fluconazole in comparison with the same mutants grown in normal media. p-Values were calculated using the Wald test. Ten candidates selected for phenotype confirmation are indicated. Genes known to be associated with fluconazole resistance and ergosterol and sphingolipid biosynthesis are shown with different colors. b Gene deletion of 10 candidates randomly selected from the top-ranked genes in a confirms increased resistance to fluconazole. Fluconazole susceptibility was evaluated using the standard CLSI broth microdilution protocol67. Cultures were incubated for 24 h, and growth was measured as OD600 and expressed as a percentage of the growth in the control wells with no drug (DMSO alone) for each strain. c Gene Ontology (GO) analysis of the PB-mutated genes that led to statistically significant fold increases (p < 0.05) after fluconazole treatment. Red bars highlight the ergosterol and sphingolipid biosynthesis pathway. p-Values were from Fisher’s exact test. d Gene Set Enrichment Analysis (GSEA) of the NGS data from a. p-Values were determined using the Kolmogorov–Smirnov test. e Homozygous deletion of FEN1 or FEN12 in BWP17 also results in increased fluconazole resistance. The assay was done as described in bCC BY · PubMed Central
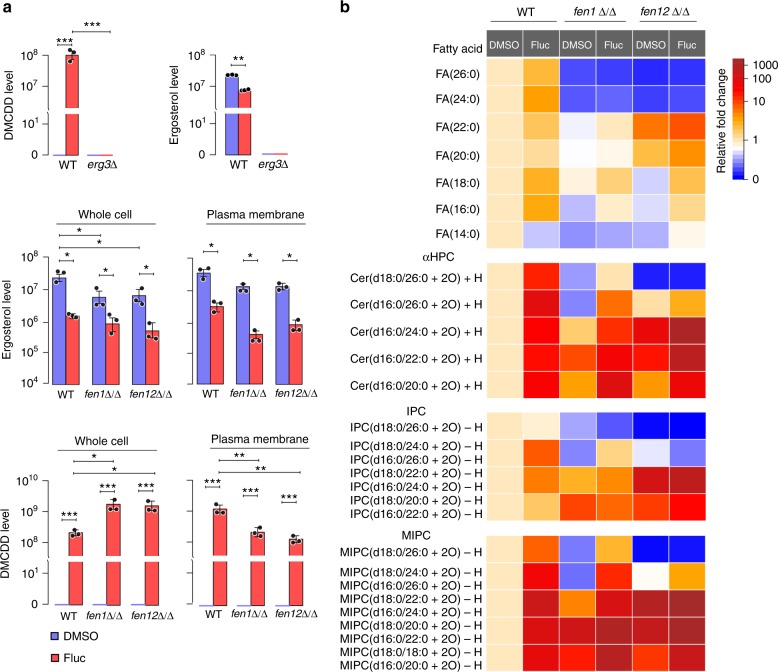
Fig. 5 LC-MS analysis of sterols and lipids in WT and fenΔ/Δ cells. a LC-MS comparison of ergosterol and DMCDD levels in whole cell lysates and the plasma membrane fraction of WT (GZY803 and BWP17), erg3Δ, fen1Δ/Δ, and fen12Δ/Δ cells with or without fluconazole treatment. Error bars represent s.d. from the mean of three independent experiments. Significance was measured using unpaired t-test (*p < 0.05, **p < 0.01, ***p < 0.001). b LC-MS analysis of free fatty acids, αHPC, IPC, and MIPC sphingolipids in WT, fen1Δ/Δ, and fen12Δ/Δ cells with or without fluconazole treatment
Fig. 5 LC-MS analysis of sterols and lipids in WT and fenΔ/Δ cells. a LC-MS comparison of ergosterol and DMCDD levels in whole cell lysates and the plasma membrane fraction of WT (GZY803 and BWP17), erg3Δ, fen1Δ/Δ, and fen12Δ/Δ cells with or without fluconazole treatment. Error bars represent s.d. from the mean of three independent experiments. Significance was measured using unpaired t-test (*p < 0.05, **p < 0.01, ***p < 0.001). b LC-MS analysis of free fatty acids, αHPC, IPC, and MIPC sphingolipids in WT, fen1Δ/Δ, and fen12Δ/Δ cells with or without fluconazole treatmentCC BY · PubMed Central
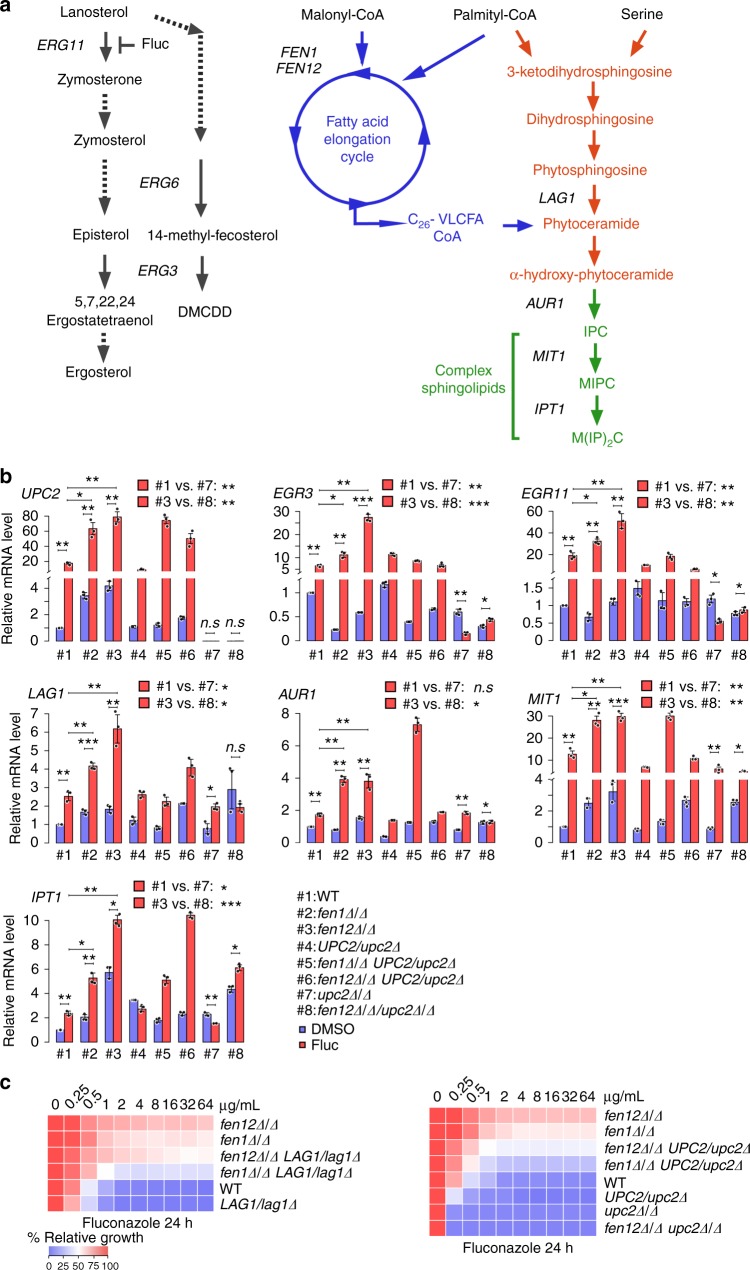
Fig. 6 Sphingolipid overproduction underlies fluconazole resistance of fenΔ/Δ cells. a Illustration of ergosterol and sphingolipid biosynthesis pathways. b qPCR analysis of UPC2, ERG3, ERG11, LAG1, AUR1, MIT1, and IPT1 expression in WT, fen1Δ/Δ, and fen12Δ/Δ mutants with UPC2 single or double knockout in the presence or absence of fluconazole. Error bars represent s.d. from the mean of three independent experiments. Significance was measured using unpaired t-test (*p < 0.05, **p < 0.01, ***p < 0.001, n.s., not significant). c Fluconazole susceptibility of WT and the indicated mutants was evaluated using the standard CLSI broth microdilution protocol. Following 24 h of incubation, growth was measured as OD600 and expressed as a percentage of the growth in the control wells with no drug (DMSO alone) for each strain
Fig. 6 Sphingolipid overproduction underlies fluconazole resistance of fenΔ/Δ cells. a Illustration of ergosterol and sphingolipid biosynthesis pathways. b qPCR analysis of UPC2, ERG3, ERG11, LAG1, AUR1, MIT1, and IPT1 expression in WT, fen1Δ/Δ, and fen12Δ/Δ mutants with UPC2 single or double knockout in the presence or absence of fluconazole. Error bars represent s.d. from the mean of three independent experiments. Significance was measured using unpaired t-test (*p < 0.05, **p < 0.01, ***p < 0.001, n.s., not significant). c Fluconazole susceptibility of WT and the indicated mutants was evaluated using the standard CLSI broth microdilution protocol. Following 24 h of incubation, growth was measured as OD600 and expressed as a percentage of the growth in the control wells with no drug (DMSO alone) for each strainCC BY · PubMed Central

Verification

Claims the paper makes

The claims and statistics of this paper haven’t been checked yet.

Run the check — free, no account needed. It reads the open-access text and checks the sources it cites.

A few free checks a day · papers already verified open instantly · results are public

Claims other papers make about this one

Each is checked against this paper’s own text: does it say what the citing paper says it does?

Self-check

Percentages, sums and reported differences re-computed from the paper’s own numbers.

The self-check needs the paper’s full text.

Citations

Cites

Show all 67 references

Research works printed but not linked: 2

  1. Jones, E. W. & Fink, G. R. Regulation of amino acid and nucleotide biosynthesis in yeast. In The Molecular Biology of the Yeast Saccharomyces: Metabolism and Gene Expression (eds Strathern, J. N. et al.) 181–299 (Cold Spring Harbor Laboratory Press, Cold Spring Harbor, NY, 1982).
  2. Rex, J. H. et al. Clinical and Laboratory Standards Institute (CLSI). Reference Method for Broth Dilution Antifungal Susceptibility Testing of Yeasts, Approved Standard-Third Edition, CLSI document M27-A3 (ISBN 1-56238-666-2) (Clinical and Laboratory Standards Institute, 940 West Valley Road, Suite 1400, Wayne, Pennsylvania 19087-1898, USA, 2008).

Cited by

Sorted by citations

See all 130

Metadata

Authors
Gao, J., Wang, H., Li, Z., Wong, A. H.-H., Wang, Y.-Z., Guo, Y., Lin, X., Zeng, G., Liu, H., Wang, Y., & Wang, J.
Affiliations
  • University of California, Irvine (US)
  • Agency for Science, Technology and Research (SG)
  • Tsinghua University (CN)
  • University of Macau (MO)
  • Center for Life Sciences (CN)
Corresponding author
  • Wang, Yi-Zheng
  • Wang, Yue
  • Wang, Jianbin
Venue
Nature Communications
Published
2018-10-29
Volume
9
Issue
1
Pages
4495-4495
ISSN
2041-1723 (ISSN-L)
OpenAlex
W2896788073
Cited by
130
References
67
Citations by year
2026: 13 · 2025: 14 · 2024: 21 · 2023: 14 · 2022: 18 · 2021: 16 · 2020: 21 · 2019: 13
FWCI
9.46
Type
journal article
Language
en
Open access
Locations
  • Nature Communications (publishedVersion, cc-by)
  • Europe PMC (PubMed Central) (publishedVersion, other-oa)
  • PubMed Central (publishedVersion, cc-by)
  • PubMed (publishedVersion)
  • National University of Singapore (submittedVersion, cc-by)
  • RePEc: Research Papers in Economics (submittedVersion)
  • DOAJ (DOAJ: Directory of Open Access Journals) (submittedVersion)
  • DOAJ (DOAJ: Directory of Open Access Journals) (submittedVersion, cc-by-sa)
Funders
  • National Natural Science Foundation of China (21675098, 2016YFC0900103)
  • National Institutes of Health
  • Biomedical Research Council
  • National Institute of General Medical Sciences (R01GM117111)
  • National Institute of Allergy and Infectious Diseases (R01AI099190)
Topics
  • Health Sciences › Medicine › Infectious Diseases › Antifungal resistance and susceptibility
  • Life Sciences › Biochemistry, Genetics and Molecular Biology › Molecular Biology › Fungal and yeast genetics research
  • Life Sciences › Biochemistry, Genetics and Molecular Biology › Molecular Biology › Sphingolipid Metabolism and Signaling
Keywords
Candida albicans, azole resistance, fluconazole resistance, sphingolipid biosynthesis, very long chain fatty acids, FEN1, haploid yeast, genome-wide screen, antifungal resistance, fungal infection
MeSH terms
Azoles, Base Sequence, Candida albicans, DNA Transposable Elements, Genes, Fungal, Genetic Testing, Haploidy, Mutation, Sphingolipids, Sterols, Mutagenesis, Drug Resistance, Fungal

About these checks

Registry, retraction, Cites and statistics results are computed, not judged, with one exception: a printed reference that no index lists is read once by a model before it counts as a citation error. Claims are extracted by a model and kept only when their quote appears verbatim in the text; each cited source is then checked, with a model’s help, for whether it says what the claim relies on. Those verdicts can be wrong — read the claim’s quote and the cited source before relying on one.

Statistics and arithmetic are recomputed, not judged.

Confidence bands are shown only for fields calibrated on our annotated test set. None is calibrated yet, so no band is shown.

What counts as a claim ›How we measure confidence ›How we check this ›

Are you an author, or do you see a problem with this page? Request a review