

The DOI matches its Crossref record; 46 of the 46 references it cites were found in a registry or an index.
High-resolution genome-wide functional dissection of transcriptional regulatory regions and nucleotides in human
Open accessPublished version of a preprint
Abstract
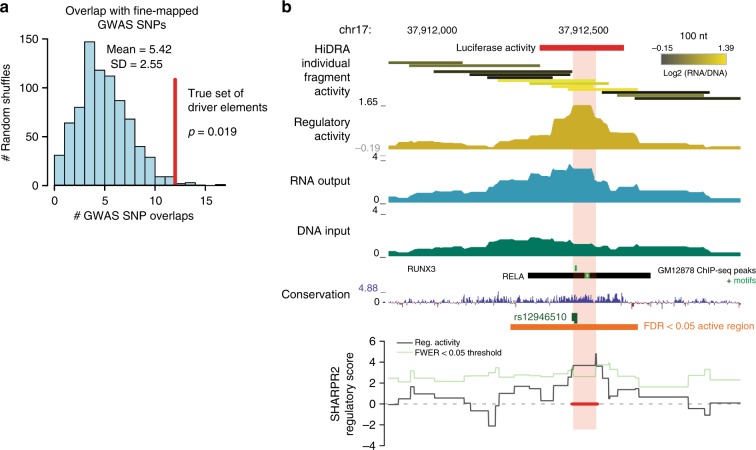
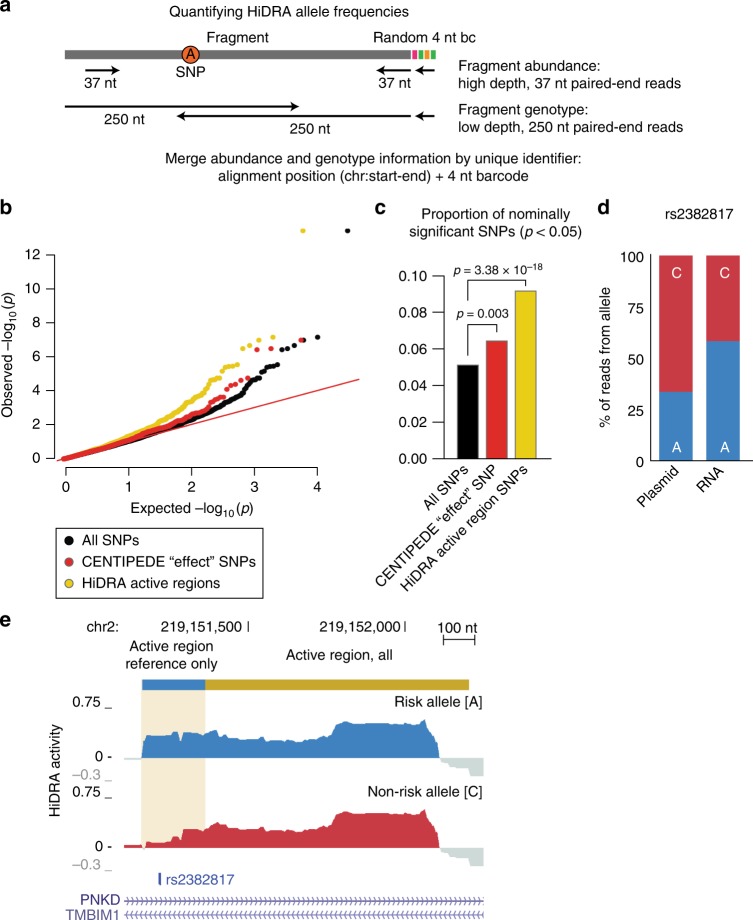
Genome-wide epigenomic maps have revealed millions of putative enhancers and promoters, but experimental validation of their function and high-resolution dissection of their driver nucleotides remain limited. Here, we present HiDRA (High-resolution Dissection of Regulatory Activity), a combined experimental and computational method for high-resolution genome-wide testing and dissection of putative regulatory regions. We test ~7 million accessible DNA fragments in a single experiment, by coupling accessible chromatin extraction with self-transcribing episomal reporters (ATAC-STARR-seq). By design, fragments are highly overlapping in densely-sampled accessible regions, enabling us to pinpoint driver regulatory nucleotides by exploiting differences in activity between partially-overlapping fragments using a machine learning model (SHARPR-RE). In GM12878 lymphoblastoid cells, we find ~65,000 regions showing enhancer function, and pinpoint ~13,000 high-resolution driver elements. These are enriched for regulatory motifs, evolutionarily-conserved nucleotides, and disease-associated genetic variants from genome-wide association studies. Overall, HiDRA provides a high-throughput, high-resolution approach for dissecting regulatory regions and driver nucleotides.
Overview
The claims and statistics of this paper haven’t been checked yet.
Run the check — free, no account needed. It reads the open-access text and checks the sources it cites.
Integrity signals
Registry
Cites
Statistics
Figures
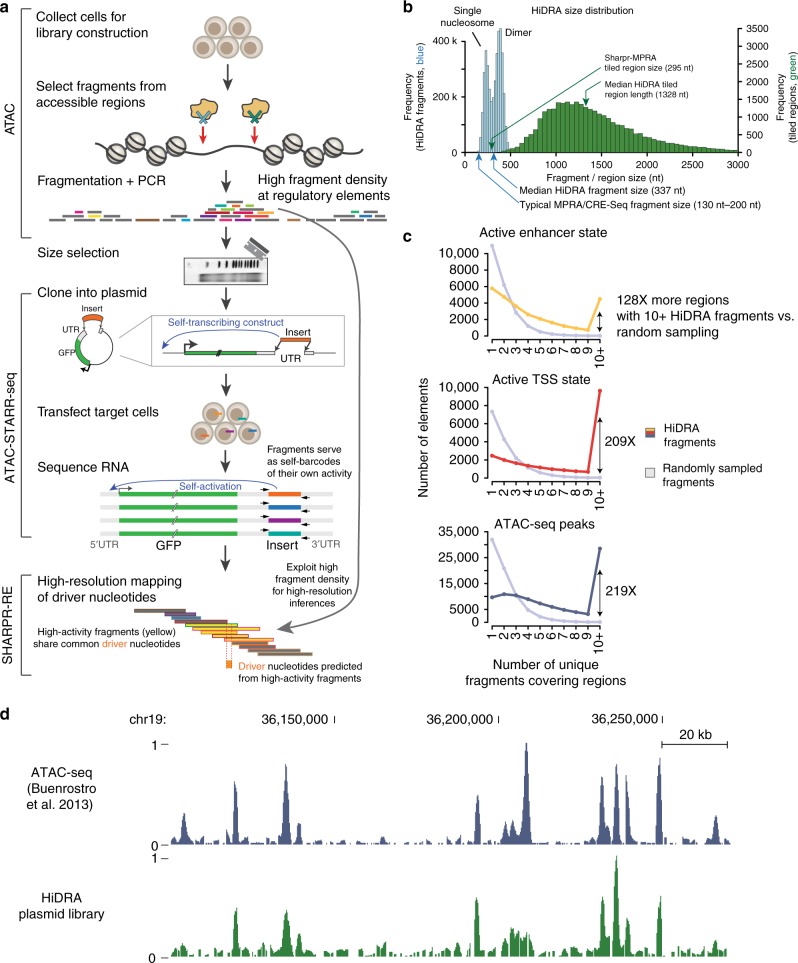
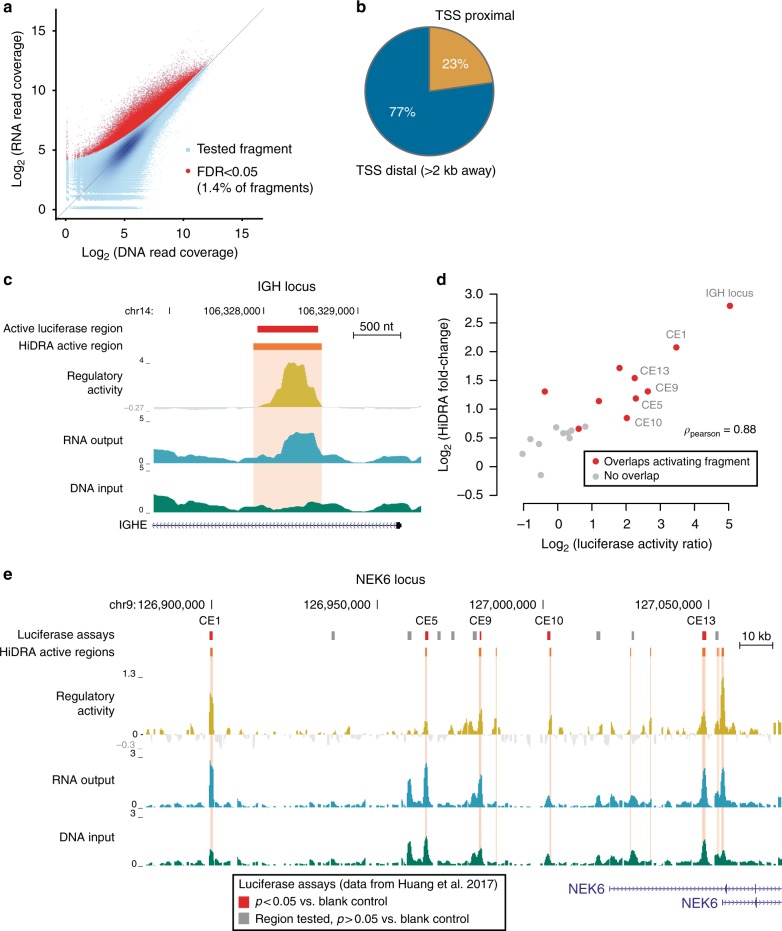
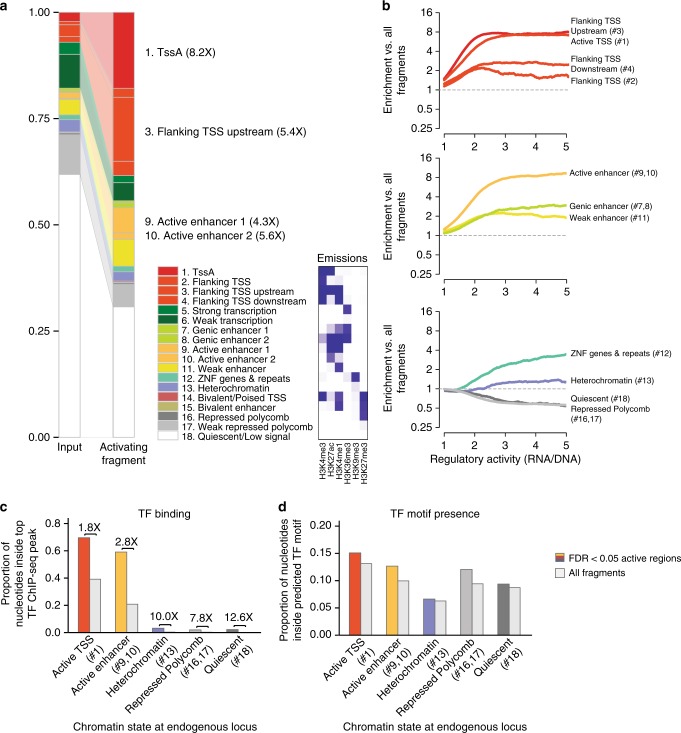
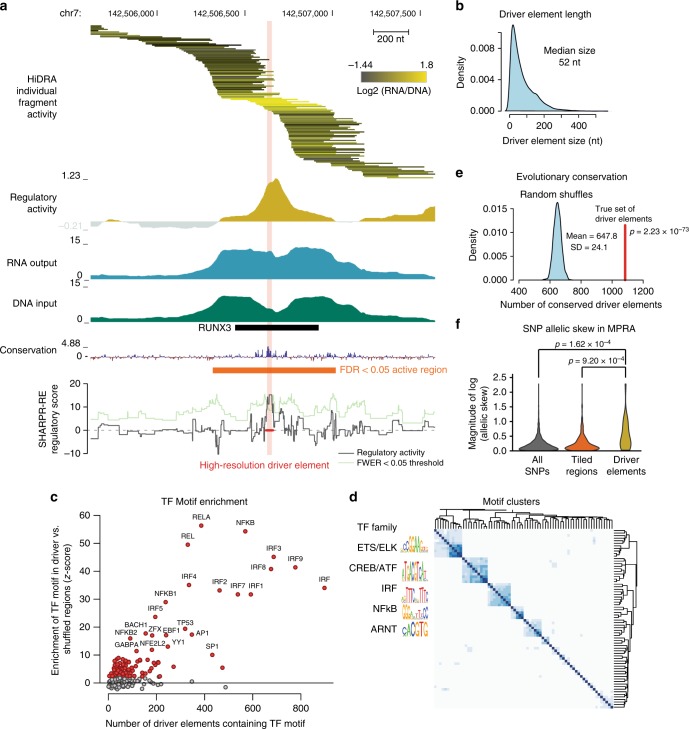
Verification
Claims the paper makes
The claims and statistics of this paper haven’t been checked yet.
Run the check — free, no account needed. It reads the open-access text and checks the sources it cites.
Claims other papers make about this one
Each is checked against this paper’s own text: does it say what the citing paper says it does?
The source backs part of the claim, not all of it — or backs it for a different population, condition or comparison.
In the citing paper
“Although enriched, histone modification and cofactor binding is not completely predictive of enhancer activity54,58,72,77,105.”
From Towards a comprehensive catalogue of validated and target-linked human enhancers (2020) · cites this paper as [77]
Experimental — accuracy not yet measuredThe source backs part of the claim, not all of it — or backs it for a different population, condition or comparison.
In the citing paper
“In fact, it remains entirely possible that many biochemically identified enhancers may not be enhancing transcription of anything77.”
From Towards a comprehensive catalogue of validated and target-linked human enhancers (2020) · cites this paper as [77]
Experimental — accuracy not yet measuredThe source backs part of the claim, not all of it — or backs it for a different population, condition or comparison.
In the citing paper
“MPRAs have been applied to assess biochemically annotated candidate enhancers77,176-178, candidate enhancers harbouring variants that potentially mediate eQTLs179-182, and even scans of the entire human genome108,183.”
From Towards a comprehensive catalogue of validated and target-linked human enhancers (2020) · cites this paper as [77]
Experimental — accuracy not yet measuredIn the citing paper
“To address this, there has been rapid maturation of technologies, such as massively parallel reporter assays121–123 and CRISPR genome editing, to support functional characterization of targeted sequence perturbations at scale.”
From A brief history of human disease genetics (2020) · cites this paper as [123]
Self-check
Percentages, sums and reported differences re-computed from the paper’s own numbers.
The self-check needs the paper’s full text.
Citations
Cites
Moderated estimation of fold change and dispersion for RNA-seq data with DESeq2
Love, M. I., Huber, W., & Anders, S. (2014) · Genome Biology · doi:10.1186/s13059-014-0550-8 · Cited by 95,106
BEDTools: a flexible suite of utilities for comparing genomic features
Quinlan, A. R., & Hall, I. M. (2010) · Bioinformatics · doi:10.1093/bioinformatics/btq033 · Cited by 27,437
An integrated encyclopedia of DNA elements in the human genome
The ENCODE Project Consortium (2012) · Nature · doi:10.1038/nature11247 · Cited by 18,072
Self-citationBuenrostro, J. D., Giresi, P. G., Zaba, L. C., Chang, H. Y., & Greenleaf, W. J. (2013) · Nature Methods · doi:10.1038/nmeth.2688 · Cited by 6,422
Integrative analysis of 111 reference human epigenomes
Roadmap Epigenomics Consortium, Kundaje, A., Meuleman, W., Ernst, J., Bilenky, M., Yen, A., Heravi-Moussavi, A., Kheradpour, P., Zhang, Z., Wang, J., et al. (2015) · Nature · doi:10.1038/nature14248 · Cited by 6,368
Self-citationThe Genotype-Tissue Expression (GTEx) pilot analysis: Multitissue gene regulation in humans
The GTEx Consortium, Ardlie, K. G., Deluca, D. S., Segrè, A. V., Sullivan, T. J., Young, T. R., Gelfand, E. T., Trowbridge, C. A., Maller, J. B., Tukiainen, T., et al. (2015) · Science · doi:10.1126/science.1262110 · Cited by 5,062
Self-citationHost–microbe interactions have shaped the genetic architecture of inflammatory bowel disease
The International IBD Genetics Consortium (IIBDGC), Jostins, L., Ripke, S., Weersma, R. K., Duerr, R. H., McGovern, D. P., Hui, K. Y., Lee, J. C., Philip Schumm, L., Sharma, Y., et al. (2012) · Nature · doi:10.1038/nature11582 · Cited by 4,722
Systematic Localization of Common Disease-Associated Variation in Regulatory DNA
Maurano, M. T., Humbert, R., Rynes, E., Thurman, R. E., Haugen, E., Wang, H., Reynolds, A. P., Sandstrom, R., Qu, H., Brody, J., et al. (2012) · Science · doi:10.1126/science.1222794 · Cited by 3,716
Mapping and analysis of chromatin state dynamics in nine human cell types
Ernst, J., Kheradpour, P., Mikkelsen, T. S., Shoresh, N., Ward, L. D., Epstein, C. B., Zhang, X., Wang, L., Issner, R., Coyne, M., et al. (2011) · Nature · doi:10.1038/nature09906 · Cited by 2,898
Self-citationA unique chromatin signature uncovers early developmental enhancers in humans
Rada-Iglesias, A., Bajpai, R., Swigut, T., Brugmann, S. A., Flynn, R. A., & Wysocka, J. (2011) · Nature · doi:10.1038/nature09692 · Cited by 2,233
Cited by
Sorted by citations
BrainGNN: Interpretable Brain Graph Neural Network for fMRI Analysis
Li, X., Zhou, Y., Dvornek, N. C., Zhang, M., Gao, S., Zhuang, J., Scheinost, D., Staib, L. H., Ventola, P. E., & Duncan, J. S. (2021) · Medical Image Analysis · doi:10.1016/j.media.2021.102233 · Cited by 845
A brief history of human disease genetics
Claussnitzer, M., Cho, J. H., Collins, R., Cox, N. J., Dermitzakis, E. T., Hurles, M. E., Kathiresan, S., Kenny, E. E., Lindgren, C. M., MacArthur, D. G., et al. (2020) · Nature · doi:10.1038/s41586-019-1879-7 · Cited by 697
Self-citationTowards a comprehensive catalogue of validated and target-linked human enhancers
Gasperini, M., Tome, J. M., & Shendure, J. (2020) · Nature Reviews Genetics · doi:10.1038/s41576-019-0209-0 · Cited by 396
Deciphering eukaryotic gene-regulatory logic with 100 million random promoters
de Boer, C. G., Vaishnav, E. D., Sadeh, R., Abeyta, E. L., Friedman, N., & Regev, A. (2020) · Nature Biotechnology · doi:10.1038/s41587-019-0315-8 · Cited by 283
A systematic evaluation of the design and context dependencies of massively parallel reporter assays
Klein, J. C., Agarwal, V., Inoue, F., Keith, A., Martin, B., Kircher, M., Ahituv, N., & Shendure, J. (2020) · Nature Methods · doi:10.1038/s41592-020-0965-y · Cited by 226
Resolving systematic errors in widely used enhancer activity assays in human cells
Muerdter, F., Boryń, Ł. M., Woodfin, A. R., Neumayr, C., Rath, M., Zabidi, M. A., Pagani, M., Haberle, V., Kazmar, T., Catarino, R. R., et al. (2018) · Nature Methods · doi:10.1038/nmeth.4534 · Cited by 208
Chromatin accessibility profiling methods
Minnoye, L., Marinov, G. K., Krausgruber, T., Pan, L., Marand, A. P., Secchia, S., Greenleaf, W. J., Furlong, E. E. M., Zhao, K., Schmitz, R. J., et al. (2021) · Nature Reviews Methods Primers · doi:10.1038/s43586-020-00008-9 · Cited by 206
Sequence determinants of human gene regulatory elements
Sahu, B., Hartonen, T., Pihlajamaa, P., Wei, B., Dave, K., Zhu, F., Kaasinen, E., Lidschreiber, K., Lidschreiber, M., Daub, C. O., et al. (2022) · Nature Genetics · doi:10.1038/s41588-021-01009-4 · Cited by 198
FlashFry: A fast and flexible tool for large-scale CRISPR target design
McKenna, A., & Shendure, J. (2018) · BMC Biology · doi:10.1186/s12915-018-0545-0 · Cited by 152
Relevance of Multi-Omics Studies in Cardiovascular Diseases
León‐Mimila, P., Wang, J., & Huertas‐Vázquez, A. (2019) · Frontiers in Cardiovascular Medicine · doi:10.3389/fcvm.2019.00091 · Cited by 162
Inoue, F., Kreimer, A., Ashuach, T., Ahituv, N., & Yosef, N. (2019) · Cell stem cell · doi:10.1016/j.stem.2019.09.010 · Cited by 109
Identification of Plant Enhancers and Their Constituent Elements by STARR-seq in Tobacco Leaves
Jores, T., Tonnies, J., Dorrity, M. W., Cuperus, J. T., Fields, S., & Queitsch, C. (2020) · The Plant Cell · doi:10.1105/tpc.20.00155 · Cited by 102
Transcription imparts architecture, function and logic to enhancer units
Tippens, N. D., Liang, J. H., Leung, A. K.-Y., Wierbowski, S. D., Ozer, A., Booth, J. G., Lis, J. T., & Yu, H. (2020) · Nature Genetics · doi:10.1038/s41588-020-0686-2 · Cited by 104
Li, Y., Liang, J. H., Ozer, A., Leung, A. K.-Y., Lis, J. T., & Yu, H. (2022) · Nature Biotechnology · doi:10.1038/s41587-022-01211-7 · Cited by 84
Ranking of non-coding pathogenic variants and putative essential regions of the human genome
Wells, A. C., Heckerman, D. E., Torkamani, A., Li, Y., Sebat, J. L., Ren, B., Telenti, A., & di Iulio, J. (2019) · Nature Communications · doi:10.1038/s41467-019-13212-3 · Cited by 79
Scalable Functional Assays for the Interpretation of Human Genetic Variation
Tabet, D. R., Parikh, V. N., Mali, P., Roth, F. P., & Claussnitzer, M. (2022) · Annual Review of Genetics · doi:10.1146/annurev-genet-072920-032107 · Cited by 84
Self-citationWidespread Enhancer Activity from Core Promoters
Medina-Rivera, A., Santiago-Algarra, D., Puthier, D., & Spicuglia, S. (2018) · Trends in Biochemical Sciences · doi:10.1016/j.tibs.2018.03.004 · Cited by 78
Cui, Y., Cao, Q., Li, Y., He, M., & Liu, X. (2023) · Journal of Experimental Botany · doi:10.1093/jxb/erad248 · Cited by 77
Neumayr, C., Pagani, M., Stark, A., & Arnold, C. D. (2019) · Current Protocols in Molecular Biology · doi:10.1002/cpmb.105 · Cited by 73
Perenthaler, E., Yousefi, S., Niggl, E., & Barakat, T. S. (2019) · Frontiers in Cellular Neuroscience · doi:10.3389/fncel.2019.00352 · Cited by 75
Transcriptional regulation by promoters with enhancer function
Dao, L. T. M., & Spicuglia, S. (2018) · Transcription · doi:10.1080/21541264.2018.1486150 · Cited by 69
Hansen, T. J., & Hodges, E. C. (2022) · Genome Research · doi:10.1101/gr.276766.122 · Cited by 71
Interpreting the impact of noncoding structural variation in neurodevelopmental disorders
D’haene, E., & Vergult, S. (2020) · Genetics in Medicine · doi:10.1038/s41436-020-00974-1 · Cited by 63
STARRPeaker: uniform processing and accurate identification of STARR-seq active regions
Lee, D., Shi, M., Moran, J. R., Wall, M., Zhang, J., Liu, J. J., Fitzgerald, D., Kyono, Y., Ma, L., White, K. P., et al. (2020) · Genome biology · doi:10.1186/s13059-020-02194-x · Cited by 59
Leveraging massively parallel reporter assays for evolutionary questions
Romero, I. G., & Lea, A. J. (2023) · Genome biology · doi:10.1186/s13059-023-02856-6 · Cited by 61
Levings, D. C., Wang, X., Kohlhase, D., Bell, D. A., & Slattery, M. G. (2018) · Redox Biology · doi:10.1016/j.redox.2018.07.026 · Cited by 53
Self-citationGenome-Wide Association Studies of CKD and Related Traits
Tin, A., & Köttgen, A. (2020) · Clinical Journal of the American Society of Nephrology · doi:10.2215/cjn.00020120 · Cited by 56
Identification of Functional Variant Enhancers Associated With Atrial Fibrillation
van Ouwerkerk, A. F., Bosada, F. M., Liu, J., Zhang, J., van Duijvenboden, K., Chaffin, M. D., Tucker, N. R., Pijnappels, D. A., Ellinor, P. T., Barnett, P., et al. (2020) · Circulation Research · doi:10.1161/circresaha.119.316006 · Cited by 46
Resolving mechanisms of immune‐mediated disease in primary CD4 T cells
Bourges, C., Groff, A. F., Burren, O. S., Gerhardinger, C., Mattioli, K., Hutchinson, A., Hu, T. X., Anand, T., Epping, M. W., Wallace, C., et al. (2020) · EMBO Molecular Medicine · doi:10.15252/emmm.202012112 · Cited by 45
Kreimer, A., Ashuach, T., Inoue, F., Khodaverdian, A., Deng, C., Yosef, N., & Ahituv, N. (2022) · Nature Communications · doi:10.1038/s41467-022-28659-0 · Cited by 44
Enhancer reprogramming: critical roles in cancer and promising therapeutic strategies
Yang, J., Zhou, F., Luo, X., Fang, Y., Wang, X., Liu, X., Xiao, R., Jiang, D., Tang, Y., Yang, G., et al. (2025) · Cell Death Discovery · doi:10.1038/s41420-025-02366-3 · Cited by 56
Self-citationWesolowska‐Andersen, A., Yu, G. Z., Nylander, V., Abaitua, F., Thurner, M., Torres, J., Mahajan, A., Gloyn, A. L., & McCarthy, M. I. (2020) · eLife · doi:10.7554/elife.51503 · Cited by 46
From Genetic Association to Molecular Mechanisms for Islet-cell Dysfunction in Type 2 Diabetes
Mattis, K. K., & Gloyn, A. L. (2020) · Journal of Molecular Biology · doi:10.1016/j.jmb.2019.12.045 · Cited by 39
Mulvey, B., Lagunas, T., & Dougherty, J. D. (2020) · Biological Psychiatry · doi:10.1016/j.biopsych.2020.06.011 · Cited by 41
Santiago‐Algarra, D., Souaid, C., Singh, H. N., Dao, L. T. M., Hussain, S., Medina-Rivera, A., Ramirez-Navarro, L., Castro-Mondragon, J. A., Sadouni, N., Charbonnier, G., et al. (2021) · Nature Communications · doi:10.1038/s41467-021-26861-0 · Cited by 40
High-throughput characterization of genetic effects on DNA–protein binding and gene transcriptionPreprint
Kalita, C. A., Brown, C. D., Freiman, A., Isherwood, J., Wen, X., Piqué-Regi, R., & Luca, F. (2018) · Genome Research · doi:10.1101/gr.237354.118 · Cited by 36
Pervasive and CpG-dependent promoter-like characteristics of transcribed enhancers
Steinhaus, R., Gonzalez, T., Seelow, D., & Robinson, P. N. (2020) · Nucleic Acids Research · doi:10.1093/nar/gkaa223 · Cited by 29
Functional characterization of human genomic variation linked to polygenic diseases
Fabo, T., & Khavari, P. A. (2023) · Trends in Genetics · doi:10.1016/j.tig.2023.02.014 · Cited by 32
Ramaker, R. C., Hardigan, A. A., Goh, S.-T., Partridge, E. C., Wold, B. J., Cooper, S. J., & Myers, R. (2020) · Genome Research · doi:10.1101/gr.260463.119 · Cited by 35
Sobczyk, M., Richardson, T. G., Zuber, V., Min, J. L., GoDMC, Gaunt, T. R., & Paternoster, L. (2021) · Journal of Investigative Dermatology · doi:10.1016/j.jid.2021.03.027 · Cited by 28
Gaining insight into metabolic diseases from human genetic discoveries
Claussnitzer, M., & Suszták, K. (2021) · Trends in Genetics · doi:10.1016/j.tig.2021.07.005 · Cited by 28
Self-citationSheng, T., Ho, S. W. T., Ooi, W. F., Xu, C., Xing, M., Padmanabhan, N., Huang, K. K., Ma, L., Ray, M., Guo, Y. A., et al. (2021) · Genome Medicine · doi:10.1186/s13073-021-00970-3 · Cited by 27
Analysis of long and short enhancers in melanoma cell states
Mauduit, D., Minnoye, L., Taskiran, I. I., Waegeneer, M. D., Christiaens, V., Hulselmans, G., Demeulemeester, J., Wouters, J., & Aerts, S. (2021) · eLife · doi:10.7554/elife.71735 · Cited by 28
Maqbool, M. A., Pioger, L., Aabidine, A. Z. E., Karasu, N., Molitor, A. M., Dao, L. T. M., Charbonnier, G., Laethem, F. V., Fenouil, R., Koch, F., et al. (2020) · Cell Reports · doi:10.1016/j.celrep.2020.108048 · Cited by 31
Renganaath, K., Chong, R., Day, L., Kosuri, S., Kruglyak, L., & Albert, F. W. (2020) · eLife · doi:10.7554/elife.62669 · Cited by 24
An autoimmune transcriptional circuit drives FOXP3 + regulatory T cell dysfunction
Sumida, T. S., Lincoln, M. R., He, L., Park, Y., Ota, M., Oguchi, A., Son, R., Yi, A., Stillwell, H. A., Leissa, G. A., et al. (2024) · Science Translational Medicine · doi:10.1126/scitranslmed.adp1720 · Cited by 25
Self-citationAccurate prediction of cis -regulatory modules reveals a prevalent regulatory genome of humans
Ni, P., & Su, Z. (2021) · NAR Genomics and Bioinformatics · doi:10.1093/nargab/lqab052 · Cited by 23
The Current State of Genetic Testing Platforms for Inherited Retinal Diseases
Mustafi, D., Hisama, F. M., Huey, J., & Chao, J. R. (2022) · Ophthalmology Retina · doi:10.1016/j.oret.2022.03.011 · Cited by 22
Epigenetics of neural differentiation: Spotlight on enhancers
Giacoman-Lozano, M., Meléndez-Ramírez, C., Martínez-Ledesma, E., Durán, R. C., & Velasco, I. (2022) · Frontiers in Cell and Developmental Biology · doi:10.3389/fcell.2022.1001701 · Cited by 23
Designing synthetic regulatory elements using the generative AI framework DNA-Diffusion
daSilva, L. F., Senan, S., Kribelbauer, J. F., Patel, Z., Louis, L. K., Reddy, A. J., Gabbita, S., Rosen, J. D., Nussbaum, Z., Cordova, C. M. V., et al. (2025) · Nature Genetics · doi:10.1038/s41588-025-02441-6 · Cited by 36
Hansen, T. J., Fong, S., Day, J. K., Capra, J. A., & Hodges, E. C. (2024) · Cell Genomics · doi:10.1016/j.xgen.2024.100536 · Cited by 20
Regulatory genome variants in human susceptibility to infection
Telenti, A., & di Iulio, J. (2019) · Human Genetics · doi:10.1007/s00439-019-02091-9 · Cited by 19
Challenges and considerations for reproducibility of STARR-seq assaysPreprint
Das, M., Hossain, A., Banerjee, D., Praul, C. A., & Girirajan, S. (2023) · Genome Research · doi:10.1101/gr.277204.122 · Cited by 18
Ni, P., Moe, J., & Su, Z. (2022) · BMC Biology · doi:10.1186/s12915-022-01426-9 · Cited by 18
Emerging insights into enhancer biology and function
Arnold, M., & Stengel, K. R. (2023) · Transcription · doi:10.1080/21541264.2023.2222032 · Cited by 20
Bergeron, B. P., Diedrich, J. D., Zhang, Y., Barnett, K. R., Dong, Q., Ferguson, D. C. J., Autry, R. J., Yang, W., Hansen, B. S., Smith, C. J., et al. (2022) · Leukemia · doi:10.1038/s41375-022-01685-z · Cited by 19
Brown, A. R., Fox, G. A., Kaplow, I. M., Lawler, A. J., Phan, B. N., Gadey, L., Wirthlin, M. E., Ramamurthy, E., May, G. E., Chen, Z., et al. (2025) · Frontiers in Genetics · doi:10.3389/fgene.2025.1533900 · Cited by 18
Morova, T., Ding, Y., Huang, C.-C. F., Sar, F., Schwarz, T., Giambartolomei, C., Baca, S. C., Grishin, D., Hach, F., Gusev, A., et al. (2022) · Nucleic Acids Research · doi:10.1093/nar/gkac1198 · Cited by 17
Short tandem repeats are important contributors to silencer elements in T cells
Hussain, S., Sadouni, N., van Essen, D., Dao, L. T. M., Ferré, Q., Charbonnier, G., Torres, M., Gallardo, F., Lecellier, C., Sexton, T., et al. (2023) · Nucleic Acids Research · doi:10.1093/nar/gkad187 · Cited by 14
Glaser, L. V., Steiger, M., Fuchs, A., van Bömmel, A., Einfeldt, E., Chung, H., Vingron, M., & Meijsing, S. H. (2021) · Nucleic Acids Research · doi:10.1093/nar/gkab1100 · Cited by 14
Rampersaud, A., Lodato, N. J., Shin, A., & Waxman, D. J. (2019) · Toxicological Sciences · doi:10.1093/toxsci/kfz148 · Cited by 15
Novel Approaches for Identifying the Molecular Background of Schizophrenia
Golov, A. K., Kondratyev, N. V., Kostyuk, G. P., & Golimbet, A. V. E. (2020) · Cells · doi:10.3390/cells9010246 · Cited by 15
Epromoters are new players in the regulatory landscape with potential pleiotropic roles
Malfait, J., Wan, J., & Spicuglia, S. (2023) · BioEssays · doi:10.1002/bies.202300012 · Cited by 19
MPRAbase a Massively Parallel Reporter Assay databasePreprint
Zhao, J., Baltoumas, F. A., Konnaris, M. A., Mouratidis, I., Liu, Z., Sims, J., Agarwal, V., Pavlopoulos, G. A., Georgakopoulos‐Soares, I., & Ahituv, N. (2025) · Genome Research · doi:10.1101/gr.280387.124 · Cited by 12
The non-coding genome in genetic brain disorders: new targets for therapy?
Salsench, E. M., Karkala, F., Lanko, K., & Barakat, T. S. (2021) · Essays in Biochemistry · doi:10.1042/ebc20200121 · Cited by 11
Íñiguez-Muñoz, S., Llinàs‐Arias, P., Ensenyat-Méndez, M., Bedoya-López, A. F., Orozco, J. I. J., Cortés, J., Roy, A., Forsberg‐Nilsson, K., DiNome, M. L., & Marzese, D. M. (2024) · Cellular and Molecular Life Sciences · doi:10.1007/s00018-024-05314-z · Cited by 11
Epigenome rewiring in human pluripotent stem cells
Yan, J., & Huangfu, D. (2021) · Trends in Cell Biology · doi:10.1016/j.tcb.2021.12.001 · Cited by 11
Castelijns, B., Baak, M. L., Geeven, G., Vermunt, M. W., Wiggers, C. R. M., Timpanaro, I. S., Kondova, I. I., de Laat, W. L., & Creyghton, M. P. (2020) · Cell Reports · doi:10.1016/j.celrep.2020.107799 · Cited by 11
A Transcription Start Site Map in Human Pancreatic Islets Reveals Functional Regulatory Signatures
Varshney, A., Kyono, Y., Elangovan, V. R., Wang, C., Erdos, M. R., Narisu, N., Albanus, R. D., Orchard, P., Stitzel, M. L., Collins, F. S., et al. (2021) · Diabetes · doi:10.2337/db20-1087 · Cited by 12
Deciphering eukaryotic cis -regulatory logic with 100 million random promotersPreprint
de Boer, C. G., Vaishnav, E. D., Sadeh, R., Abeyta, E. L., Friedman, N., & Regev, A. (2017) · bioRxiv (Cold Spring Harbor Laboratory) · doi:10.1101/224907 · Cited by 13
Klein, J. C., Agarwal, V., Inoue, F., Keith, A., Martin, B., Kircher, M., Ahituv, N., & Shendure, J. (2020) · doi:10.21203/rs.3.pex-1065/v1 · Cited by 11
Schmitt, M. J., Dramaretska, Y., Serresi, M., Kertalli, S., Jiang, B., Yin, J., Aguzzi, A., Barozzi, I., & Gargiulo, G. (2024) · Nature Communications · doi:10.1038/s41467-024-45069-6 · Cited by 13
Identification and prediction of developmental enhancers in sea urchin embryos
Arenas‐Mena, C., Miljovska, S., Rice, E. J., Gurges, J., Shashikant, T., Wang, Z., Ercan, S., & Danko, C. G. (2021) · BMC Genomics · doi:10.1186/s12864-021-07936-0 · Cited by 10
Strategies for activity analysis of single nucleotide polymorphisms associated with human diseases
Ren, N., Dai, S., Ma, S., & Yang, F. (2022) · Clinical Genetics · doi:10.1111/cge.14282 · Cited by 12
Enhancers as potential targets for engineering salinity stress tolerance in crop plants
Jain, M., & Garg, R. (2021) · Physiologia Plantarum · doi:10.1111/ppl.13421 · Cited by 9
Datsomor, A. K., Wilberg, R., Torgersen, J. S., Sandve, S. R., & Harvey, T. N. (2023) · G3 Genes Genomes Genetics · doi:10.1093/g3journal/jkad039 · Cited by 10
Monsen, Ø., Grønvold, L., Datsomor, A. K., Harvey, T. N., Kijas, J., Suh, A., Hvidsten, T. R., & Sandve, S. R. (2025) · Genome Research · doi:10.1101/gr.278931.124 · Cited by 8
Identification, Design, and Application of Noncoding Cis-Regulatory Elements
Xu, L., & Liu, Y. (2024) · Biomolecules · doi:10.3390/biom14080945 · Cited by 9
The spectrum of covariance matrices of randomly connected recurrent neuronal networksPreprint
Hu, Y., & Sompolinsky, H. (2020) · bioRxiv (Cold Spring Harbor Laboratory) · doi:10.1101/2020.08.31.274936 · Cited by 8
Variant-to-function approaches for adipose tissue: Insights into cardiometabolic disorders
Metz, S., Belanich, J. R., Claussnitzer, M., & Kilpeläinen, T. O. (2025) · Cell Genomics · doi:10.1016/j.xgen.2025.100844 · Cited by 7
Self-citationUnderlying causes for prevalent false positives and false negatives in STARR-seq data
Ni, P., Wu, S., & Su, Z. (2023) · NAR Genomics and Bioinformatics · doi:10.1093/nargab/lqad085 · Cited by 8
Uvarova, A. N., Ткаченко, Е. А., Stasevich, E. M., Zheremyan, E. A., Korneev, K. V., & Kuprash, D. V. (2024) · Biochemistry (Moscow) · doi:10.1134/s0006297924060026 · Cited by 7
Zhang, J., Leung, A. K.-Y., Zhu, Y., Yao, L., Willis, A., Pan, X., Ozer, A., Zhou, Z., Siklenka, K., Barrera, A., et al. (2025) · Genome biology · doi:10.1186/s13059-025-03828-8 · Cited by 7
Scott, T. J., Hansen, T. J., McArthur, E., & Hodges, E. C. (2023) · BMC Genomics · doi:10.1186/s12864-023-09622-9 · Cited by 7
Abdalla, M., Abdalla, M., McCarthy, M. I., & Holmes, C. C. (2022) · PLoS Computational Biology · doi:10.1371/journal.pcbi.1010028 · Cited by 7
Cis-regulatory atlas of primary human CD4+ T cells
Stefan, K., & Barski, A. (2023) · BMC Genomics · doi:10.1186/s12864-023-09288-3 · Cited by 6
Genome-wide strand asymmetry in massively parallel reporter activity favors genic strandsPreprint
Roberts, B. S., Partridge, E. C., Moyers, B. A., Agarwal, V., Newberry, K. M., Martin, B., Shendure, J., Myers, R., & Cooper, G. M. (2021) · Genome Research · doi:10.1101/gr.270751.120 · Cited by 6
Non-coding variants impact cis-regulatory coordination in a cell type-specific manner
Pushkarev, O., van Mierlo, G., Kribelbauer, J. F., Saelens, W., Gardeux, V., & Deplancke, B. (2024) · Genome biology · doi:10.1186/s13059-024-03333-4 · Cited by 8
Mulvey, B., Lagunas, T., & Dougherty, J. D. (2020) · bioRxiv (Cold Spring Harbor Laboratory) · doi:10.1101/2020.02.02.931337 · Cited by 4
The landscape of fitness effects of putatively functional noncoding mutations in humansPreprint
Di, C., Ramesh, S., Ernst, J., & Lohmueller, K. E. (2025) · bioRxiv (Cold Spring Harbor Laboratory) · doi:10.1101/2025.05.14.654124 · Cited by 5
Applications of high-throughput reporter assays to gene regulation studies
D’Elia, B., & Bass, J. I. F. (2025) · Current Opinion in Structural Biology · doi:10.1016/j.sbi.2025.103105 · Cited by 4
Prevalent use and evolution of exonic regulatory sequences in the human genome
Chen, J., Ni, P., Wu, S., Niu, M., Guo, J., & Su, Z. (2023) · Natural Sciences · doi:10.1002/ntls.20220058 · Cited by 4
HDI-STARR-seq: Condition-specific enhancer discovery in mouse liver in vivo
Chang, T.-Y., & Waxman, D. J. (2024) · BMC Genomics · doi:10.1186/s12864-024-11162-9 · Cited by 4
Tovar, A., Kyono, Y., Nishino, K., Bose, M., Varshney, A., Parker, S. C. J., & Kitzman, J. O. (2026) · Human Genetics and Genomics Advances · doi:10.1016/j.xhgg.2026.100606 · Cited by 4
Approches haut débit pour l’étude des séquences cis-régulatrices
España, A. P., Santiago‐Algarra, D., Pradel, L. C., & Spicuglia, S. (2017) · Biologie Aujourd hui · doi:10.1051/jbio/2018015 · Cited by 4
Integration of high-throughput reporter assays identify a critical enhancer of the Ikzf1 gene
Alomairi, J., Molitor, A. M., Sadouni, N., Hussain, S., Torres, M., Saadi, W., Dao, L. T. M., Charbonnier, G., Santiago‐Algarra, D., Andrau, J., et al. (2020) · PLoS ONE · doi:10.1371/journal.pone.0233191 · Cited by 4
Identification of essential regulatory elements in the human genomePreprint
Wells, A. C., Heckerman, D. E., Torkamani, A., Li, Y., Ren, B., Telenti, A., & di Iulio, J. (2018) · bioRxiv (Cold Spring Harbor Laboratory) · doi:10.1101/444562 · Cited by 5
Glaser, L. V., Steiger, M., Fuchs, A., van Bömmel, A., Einfeldt, E., Chung, H.-R., Vingron, M., & Meijsing, S. H. (2021) · bioRxiv (Cold Spring Harbor Laboratory) · doi:10.1101/2021.06.04.446899 · Cited by 5
Haplotype-aware single-cell multiomics uncovers functional effects of somatic structural variationPreprint
Jeong, H., Grimes, K., Bruch, P., Rausch, T., Hasenfeld, P., Sabarinathan, R., Porubskỳ, D., Herbst, S. A., Erarslan-Uysal, B., Jann, J.-C., et al. (2021) · bioRxiv (Cold Spring Harbor Laboratory) · doi:10.1101/2021.11.11.468039 · Cited by 4
Context transcription factors establish cooperative environments and mediate enhancer communicationPreprint
Kribelbauer-Swietek, J. F., Pushkarev, O., Gardeux, V., Russeil, J., van Mierlo, G., & Deplancke, B. (2023) · bioRxiv (Cold Spring Harbor Laboratory) · doi:10.1101/2023.05.05.539543 · Cited by 4
Metadata
- Authors
- Wang, X., He, L., Goggin, S. M., Saadat, A., Wang, L., Sinnott-Armstrong, N., Claussnitzer, M., & Kellis, M.
- Affiliations
- Broad Institute (US)
- Corresponding author
- Claussnitzer, Melina
- Kellis, Manolis
- ORCID
- Venue
- Nature Communications
- Published
- 2018-12-19
- Volume
- 9
- Issue
- 1
- Pages
- 5380-5380
- ISSN
- 2041-1723 (ISSN-L)
- PMC
- PMC6300699
- OpenAlex
- W2903823332
- Cited by
- 159
- References
- 45
- Citations by year
- 2026: 5 · 2025: 16 · 2024: 27 · 2023: 18 · 2022: 18 · 2021: 23 · 2020: 30 · 2019: 12 · 2018: 7
- FWCI
- 6.46
- Type
- journal article
- Language
- en
- Open access
- gold
- doi.org
- Locations
- Nature Communications (publishedVersion, cc-by)
- bioRxiv (Cold Spring Harbor Laboratory) (acceptedVersion)
- Europe PMC (PubMed Central) (publishedVersion, cc-by)
- PubMed Central (publishedVersion, cc-by)
- PubMed (publishedVersion)
- RePEc: Research Papers in Economics (submittedVersion)
- DOAJ (DOAJ: Directory of Open Access Journals) (submittedVersion, cc-by-sa)
- DOAJ (DOAJ: Directory of Open Access Journals) (submittedVersion)
- DSpace@MIT (Massachusetts Institute of Technology) (submittedVersion, cc-by-nc)
- Nature
- Funders
- National Institutes of Health (GM12878, NIH-R01)
- McDonnell Center for Systems Neuroscience
- National Human Genome Research Institute (U01HG007610, R01HG008155, U01HG009088)
- National Institute of General Medical Sciences (R01GM113708)
- Topics
- Life Sciences › Biochemistry, Genetics and Molecular Biology › Molecular Biology › Genomics and Chromatin Dynamics
- Life Sciences › Biochemistry, Genetics and Molecular Biology › Molecular Biology › Chromatin Remodeling and Cancer
- Life Sciences › Biochemistry, Genetics and Molecular Biology › Molecular Biology › Epigenetics and DNA Methylation
- Keywords
- HIDRA, enhancer function, transcriptional regulatory sequences, chromatin accessibility, machine learning, regulatory motifs, disease-associated variants
- MeSH terms
- Gene Expression Regulation, Genetic Techniques, Humans, Regulatory Sequences, Nucleic Acid, Genome, Human, Polymorphism, Single Nucleotide, Genome-Wide Association Study
About these checks
Registry, retraction, Cites and statistics results are computed, not judged, with one exception: a printed reference that no index lists is read once by a model before it counts as a citation error. Claims are extracted by a model and kept only when their quote appears verbatim in the text; each cited source is then checked, with a model’s help, for whether it says what the claim relies on. Those verdicts can be wrong — read the claim’s quote and the cited source before relying on one.
Statistics and arithmetic are recomputed, not judged.
Confidence bands are shown only for fields calibrated on our annotated test set. None is calibrated yet, so no band is shown.
What counts as a claim ›How we measure confidence ›How we check this ›
Are you an author, or do you see a problem with this page? Request a review
